SVG charts in tables
This template draws a small chart in each row of a table. A metric returns an SVG string, and the table cell renders it.
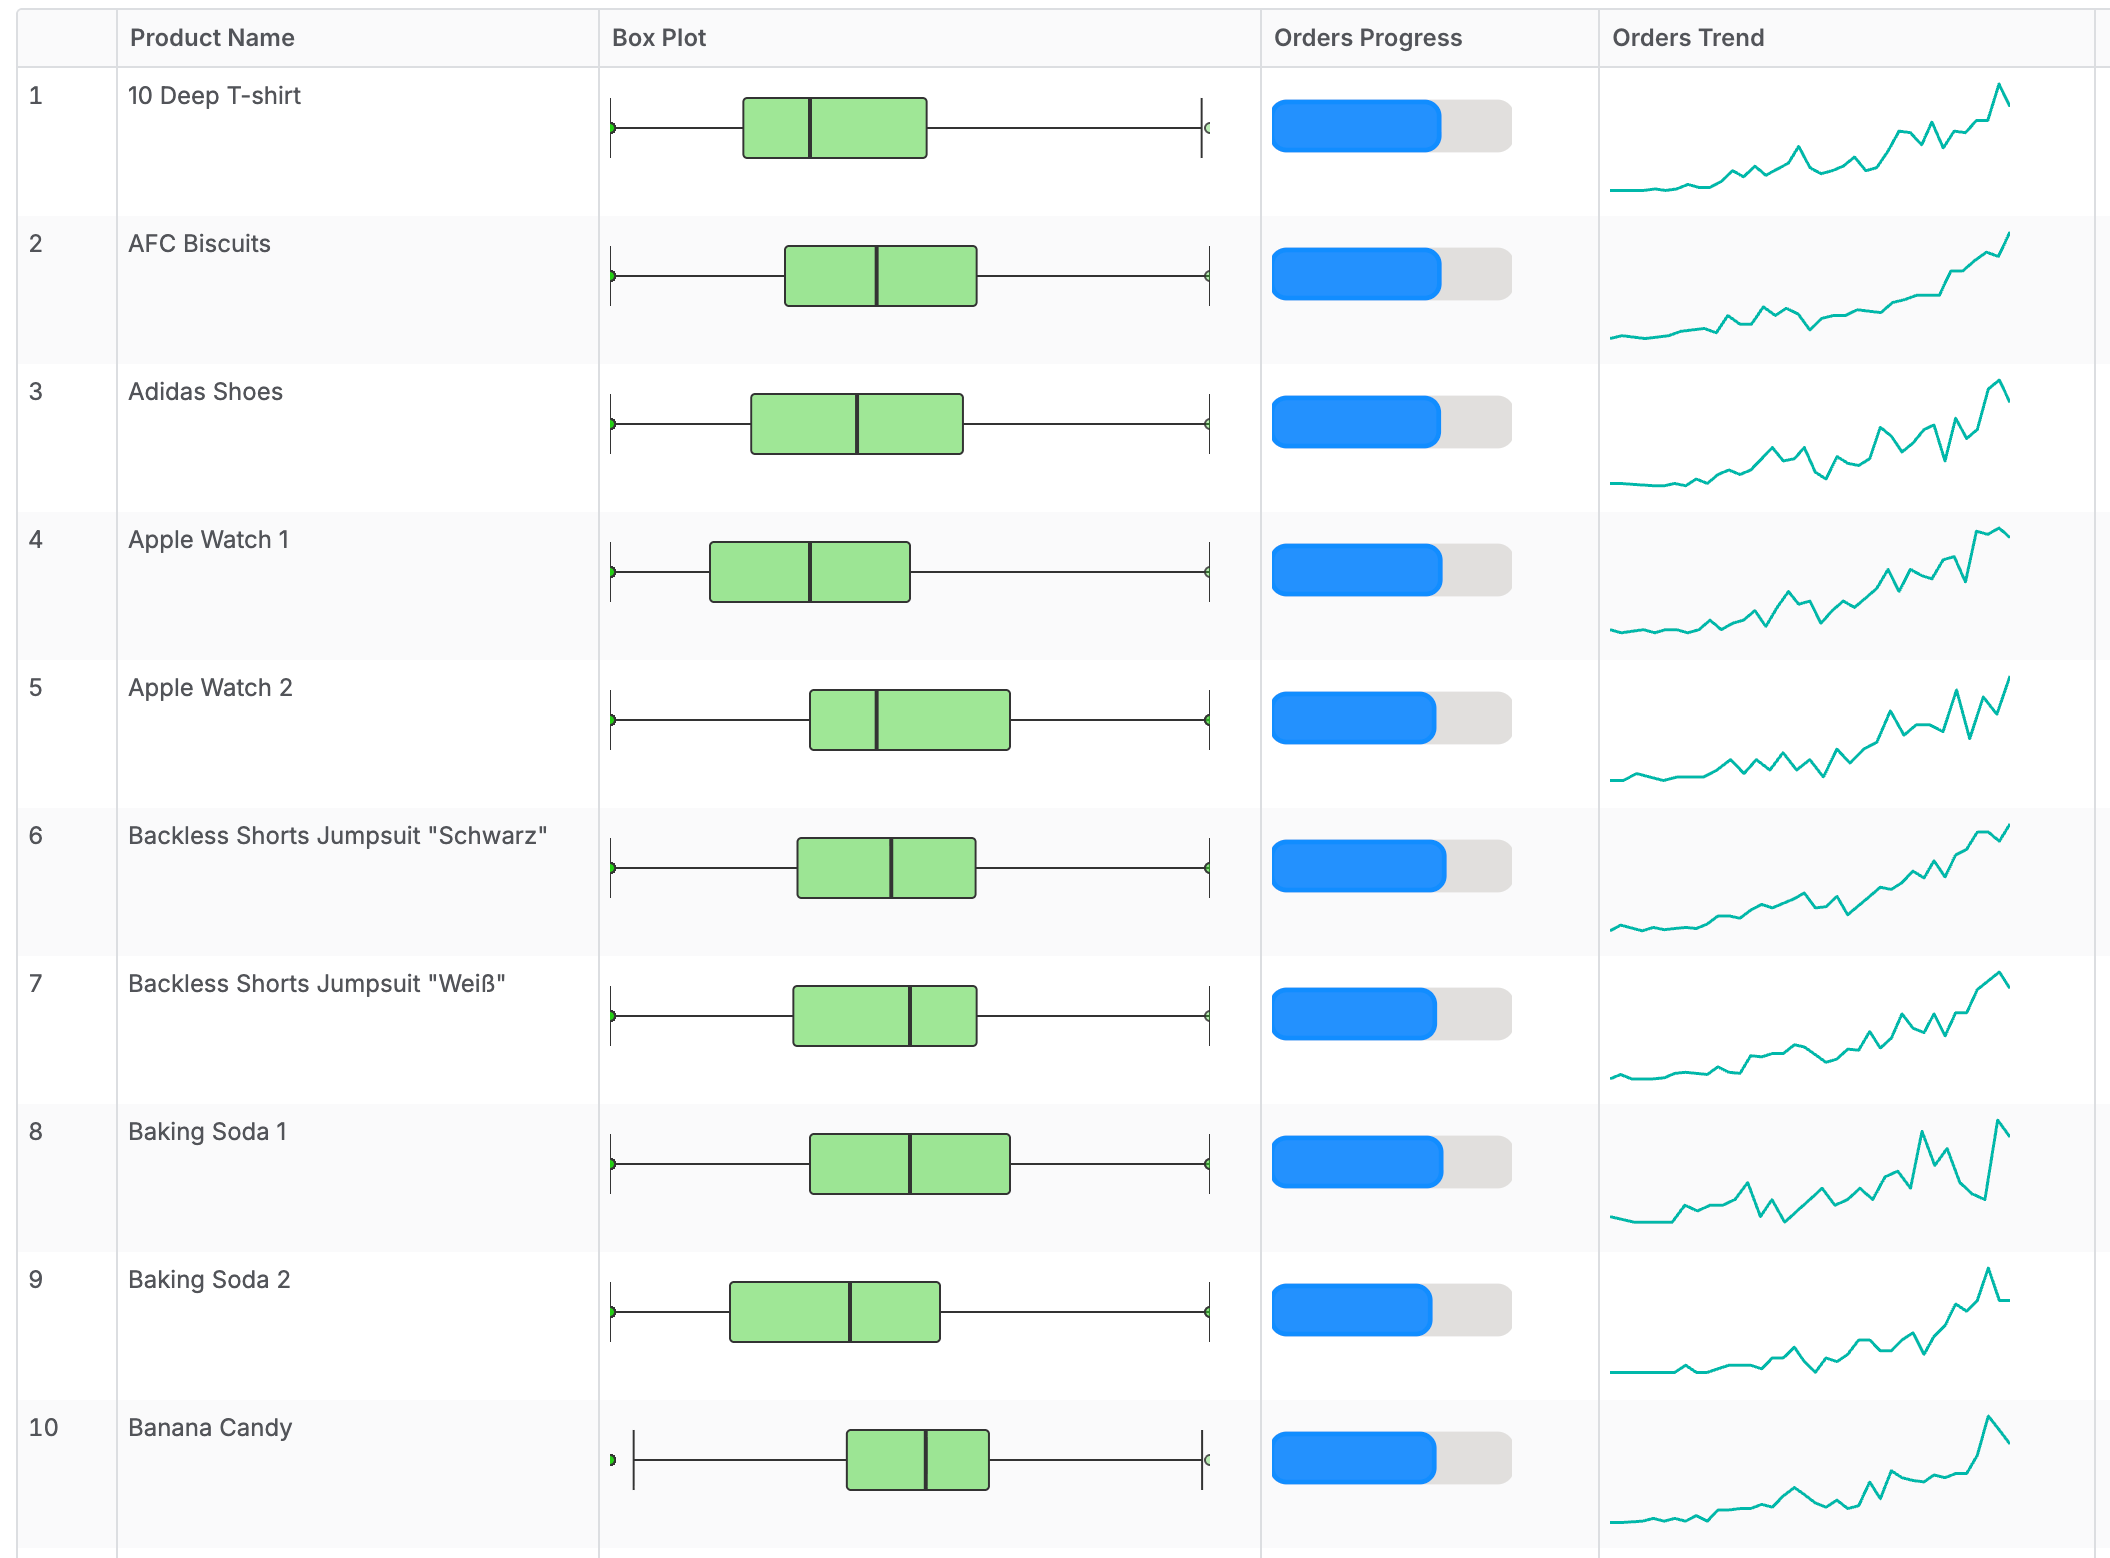
- Box Plot: the spread of a measure per row.
- Progress Bar: a value against a target per row.
- Line Chart: the trend of a measure over time per row.
All charts use the same function library, so set the library up once on this page.
How it works
Each chart is built from layers of small functions. Each layer calls the one below it.
| Module | What it does |
|---|---|
SVG.Viz | The chart you call from a metric. Wraps a Compound function in an <svg> element. |
SVG.Compound | The chart body: the shapes and the layout math. |
SVG.Element | One SVG shape each: Rect, Circle, Line, Polyline. |
SVG.Attr | Builds the attribute string for a shape, such as fill and stroke. |
SVG.Scale | Maps a data value to a pixel position. |
SVG.Axis | Per-row statistics for the box plot and line chart: min, max, percentile and count. |
SVG.Html | Pins the chart to a fixed size inside the table cell. |
The library is a port of the DaxLib daxlib.svg package (MIT) to AQL.
Step 1: Add the function library
Add this AqlFunctionModule to your project. It only needs to exist once.
library/aql-functions/svg.aml
AqlFunctionModule SVG {
// Wraps shapes in an <svg> element.
function SVG {
param pWidth {
type: 'text'
}
param pHeight {
type: 'text'
}
param pViewbox {
type: 'text'
}
param pContents {
type: 'text'
}
param pSortValue {
type: 'number'
}
return_type: 'text'
definition: @aql
concat(
"<svg ",
"width='", pWidth, "' height='", pHeight, "' ",
case(when: pViewbox is not null, then: concat("viewBox='", pViewbox, "' "), else: ''),
"xmlns='http://www.w3.org/2000/svg'>",
case(when: pSortValue is not null, then: concat('<desc>', cast(pSortValue, 'text'), '</desc>'), else: ''),
pContents,
"</svg>"
)
;;
}
module Color: AqlFunctionModule {
// Palette lookup by theme name and variant.
function Theme {
param pThemeName {
type: 'text'
}
param pVariant {
type: 'number'
}
return_type: 'text'
definition: @aql
case(
when: pThemeName == 'Power BI' and pVariant == 1, then: '#118DFF',
when: pThemeName == 'Power BI' and pVariant == 2, then: '#12239E',
when: pThemeName == 'Power BI' and pVariant == 3, then: '#E66C37',
when: pThemeName == 'Power BI' and pVariant == 4, then: '#6B007B',
when: pThemeName == 'Power BI' and pVariant == 5, then: '#E044A7',
when: pThemeName == 'Power BI' and pVariant == 6, then: '#744EC2',
when: pThemeName == 'Power BI' and pVariant == 7, then: '#D9B300',
when: pThemeName == 'Power BI' and pVariant == 8, then: '#D64550',
else: '#000000'
)
;;
}
}
module Attr: AqlFunctionModule {
// Builds name='value' when the value is not null, and an empty string otherwise.
function Opt {
param pName {
type: 'text'
}
param pValue {
type: 'text'
}
return_type: 'text'
definition: @aql
case(when: pValue is not null, then: concat(pName, "='", pValue, "' "), else: '')
;;
}
// Same as Opt, for a number.
function OptNum {
param pName {
type: 'text'
}
param pValue {
type: 'number'
}
return_type: 'text'
definition: @aql
case(when: pValue is not null, then: concat(pName, "='", cast(pValue, 'text'), "' "), else: '')
;;
}
// fill, fill-opacity, fill-rule, stroke, stroke-width, stroke-opacity, opacity
function Shapes {
param pFill {
type: 'text'
}
param pFillOpacity {
type: 'number'
}
param pFillRule {
type: 'text'
}
param pStroke {
type: 'text'
}
param pStrokeWidth {
type: 'number'
}
param pStrokeOpacity {
type: 'number'
}
param pOpacity {
type: 'number'
}
return_type: 'text'
definition: @aql
concat(
Opt ('fill', pFill),
OptNum('fill-opacity', pFillOpacity),
Opt ('fill-rule', pFillRule),
Opt ('stroke', pStroke),
OptNum('stroke-width', pStrokeWidth),
OptNum('stroke-opacity', pStrokeOpacity),
OptNum('opacity', pOpacity)
)
;;
}
}
module Element: AqlFunctionModule {
function Rect {
param pX {
type: 'text'
}
param pY {
type: 'text'
}
param pWidth {
type: 'text'
}
param pHeight {
type: 'text'
}
param pRx {
type: 'text'
}
param pRy {
type: 'text'
}
param pAttributes {
type: 'text'
}
param pTransforms {
type: 'text'
}
return_type: 'text'
definition: @aql
concat(
'<rect',
" x='", pX, "'",
" y='", pY, "'",
" width='", pWidth, "'",
" height='", pHeight, "'",
case(when: pRx is not null, then: concat(" rx='", pRx, "'"), else: ''),
case(when: pRy is not null, then: concat(" ry='", pRy, "'"), else: ''),
case(when: pAttributes is not null, then: concat(' ', pAttributes, ' '), else: ''),
case(when: pTransforms is not null, then: concat(" transform='", pTransforms, "'"), else: ''),
'/>'
)
;;
}
function Circle {
param pCx {
type: 'text'
}
param pCy {
type: 'text'
}
param pR {
type: 'text'
}
param pAttributes {
type: 'text'
}
param pTransforms {
type: 'text'
}
return_type: 'text'
definition: @aql
concat(
'<circle',
" cx='", pCx, "'",
" cy='", pCy, "'",
" r='", pR, "'",
case(when: pAttributes is not null, then: concat(' ', pAttributes, ' '), else: ''),
case(when: pTransforms is not null, then: concat(" transform='", pTransforms, "'"), else: ''),
'/>'
)
;;
}
function Line {
param pX1 {
type: 'text'
}
param pY1 {
type: 'text'
}
param pX2 {
type: 'text'
}
param pY2 {
type: 'text'
}
param pAttributes {
type: 'text'
}
param pTransforms {
type: 'text'
}
return_type: 'text'
definition: @aql
concat(
'<line',
" x1='", pX1, "'",
" y1='", pY1, "'",
" x2='", pX2, "'",
" y2='", pY2, "'",
case(when: pAttributes is not null, then: concat(' ', pAttributes, ' '), else: ''),
case(when: pTransforms is not null, then: concat(" transform='", pTransforms, "'"), else: ''),
'/>'
)
;;
}
// A polyline through space-separated "x,y" points.
function Polyline {
param pPoints {
type: 'text'
}
param pAttributes {
type: 'text'
}
param pTransforms {
type: 'text'
}
return_type: 'text'
definition: @aql
concat(
"<polyline points='", pPoints, "'",
case(when: pAttributes is not null, then: concat(' ', pAttributes, ' '), else: ''),
case(when: pTransforms is not null, then: concat(" transform='", pTransforms, "'"), else: ''),
'/>'
)
;;
}
}
module Scale: AqlFunctionModule {
// Linear map of a value from one range to another.
function Normalize {
param pInputValue {
type: 'number'
}
param pFromMin {
type: 'number'
}
param pFromMax {
type: 'number'
}
param pToMin {
type: 'number'
}
param pToMax {
type: 'number'
}
return_type: 'number'
definition: @aql
pToMin + ((pInputValue - pFromMin) / (pFromMax - pFromMin)) * (pToMax - pToMin)
;;
}
}
module Compound: AqlFunctionModule {
// Layout helpers. Offset is the padded start of an axis, Plot is its padded length.
function Offset {
param pCoord {
type: 'number'
}
param pSize {
type: 'number'
}
param pPad {
type: 'number'
}
return_type: 'number'
definition: @aql pCoord + (pSize * (coalesce(pPad, 0) / 2)) ;;
}
function Plot {
param pSize {
type: 'number'
}
param pPad {
type: 'number'
}
return_type: 'number'
definition: @aql pSize * (1 - coalesce(pPad, 0)) ;;
}
// Progress bar helpers.
function Orient {
param p {
type: 'text'
}
return_type: 'text'
definition: @aql case(when: p == 'Vertical', then: 'Vertical', else: 'Horizontal') ;;
}
function MaxRef {
param pVal {
type: 'number'
mode: 'expr'
}
param pTrack {
type: 'number'
mode: 'expr'
}
return_type: 'number'
definition: @aql
case(
when: pTrack is null,
then: case(when: abs(pVal) > 1, then: abs(pVal), else: 1),
else: case(when: abs(pTrack) > 1, then: abs(pTrack), else: 1)
)
;;
}
function Pct {
param pVal {
type: 'number'
mode: 'expr'
}
param pMax {
type: 'number'
mode: 'expr'
}
return_type: 'number'
definition: @aql
case(
when: coalesce(safe_divide(pVal, pMax), 0) > 1, then: 1,
when: coalesce(safe_divide(pVal, pMax), 0) < 0, then: 0,
else: coalesce(safe_divide(pVal, pMax), 0)
)
;;
}
function ProgressBar {
param pX {
type: 'number'
}
param pY {
type: 'number'
}
param pWidth {
type: 'number'
}
param pHeight {
type: 'number'
}
param pPaddingX {
type: 'number'
}
param pPaddingY {
type: 'number'
}
param pValueRef {
type: 'number'
mode: 'expr'
}
param pTrackRef {
type: 'number'
mode: 'expr'
}
param pFillColor {
type: 'text'
}
param pTrackColor {
type: 'text'
}
param pOrientation {
type: 'text'
}
return_type: 'text'
definition: @aql
case(
when: pValueRef is not null
and Plot(pWidth, pPaddingX) > 0
and Plot(pHeight, pPaddingY) > 0,
then: concat(
Element.Rect(
cast(Offset(pX, pWidth, pPaddingX), 'text'),
cast(Offset(pY, pHeight, pPaddingY), 'text'),
cast(Plot(pWidth, pPaddingX), 'text'),
cast(Plot(pHeight, pPaddingY), 'text'),
'3', '3',
Attr.Shapes(
coalesce(pTrackColor, '#E1DFDD'), 1, null,
coalesce(pTrackColor, '#E1DFDD'), 1, null, null
),
null
),
Element.Rect(
cast(Offset(pX, pWidth, pPaddingX), 'text'),
cast(
case(
when: Orient(pOrientation) == 'Horizontal',
then: Offset(pY, pHeight, pPaddingY),
else: Offset(pY, pHeight, pPaddingY)
+ Plot(pHeight, pPaddingY) * (1 - Pct(pValueRef, MaxRef(pValueRef, pTrackRef)))
),
'text'
),
cast(
case(
when: Orient(pOrientation) == 'Horizontal',
then: Plot(pWidth, pPaddingX) * Pct(pValueRef, MaxRef(pValueRef, pTrackRef)),
else: Plot(pWidth, pPaddingX)
),
'text'
),
cast(
case(
when: Orient(pOrientation) == 'Horizontal',
then: Plot(pHeight, pPaddingY),
else: Plot(pHeight, pPaddingY) * Pct(pValueRef, MaxRef(pValueRef, pTrackRef))
),
'text'
),
'3', '3',
Attr.Shapes(
coalesce(pFillColor, '#0F6CBD'), 0.95, null,
coalesce(pFillColor, '#0F6CBD'), 1, null, null
),
null
)
),
else: ''
)
;;
}
function Boxplot {
param pX {
type: 'number'
}
param pY {
type: 'number'
}
param pWidth {
type: 'number'
}
param pHeight {
type: 'number'
}
param pPaddingX {
type: 'number'
}
param pPaddingY {
type: 'number'
}
param pAxisModel {
type: 'model'
}
param pAxisRef {
type: 'dimension'
mode: 'expr'
}
param pMeasureRef {
type: 'number'
mode: 'expr'
}
param pFillColor {
type: 'text'
}
param pStrokeColor {
type: 'text'
}
return_type: 'text'
definition: @aql
const lo = Offset(pX, pWidth, pPaddingX);
const hi = Offset(pX, pWidth, pPaddingX) + Plot(pWidth, pPaddingX);
const center_y = Offset(pY, pHeight, pPaddingY) + Plot(pHeight, pPaddingY) * 0.5;
const cap_top = Offset(pY, pHeight, pPaddingY) + Plot(pHeight, pPaddingY) * 0.2;
const cap_bot = Offset(pY, pHeight, pPaddingY) + Plot(pHeight, pPaddingY) * 0.8;
const box_h = Plot(pHeight, pPaddingY) * 0.6;
const axis_min = Axis.Min(pAxisModel, pAxisRef, pMeasureRef);
const axis_max = Axis.Max(pAxisModel, pAxisRef, pMeasureRef);
const p25 = Axis.Percentile(pAxisModel, pAxisRef, pMeasureRef, 0.25);
const p50 = Axis.Percentile(pAxisModel, pAxisRef, pMeasureRef, 0.5);
const p75 = Axis.Percentile(pAxisModel, pAxisRef, pMeasureRef, 0.75);
const iqr = p75 - p25;
const lower_whisker_value = case(when: axis_min > (p25 - 1.5 * iqr), then: axis_min, else: p25 - 1.5 * iqr);
const upper_whisker_value = case(when: axis_max < (p75 + 1.5 * iqr), then: axis_max, else: p75 + 1.5 * iqr);
const q1_x = Scale.Normalize(p25, axis_min, axis_max, lo, hi);
const q3_x = Scale.Normalize(p75, axis_min, axis_max, lo, hi);
const median_x = Scale.Normalize(p50, axis_min, axis_max, lo, hi);
const lower_whisker_x = Scale.Normalize(lower_whisker_value, axis_min, axis_max, lo, hi);
const upper_whisker_x = Scale.Normalize(upper_whisker_value, axis_min, axis_max, lo, hi);
concat(
Element.Line(cast(lower_whisker_x, 'text'), cast(center_y, 'text'), cast(q1_x, 'text'), cast(center_y, 'text'), Attr.Shapes(null, null, null, pStrokeColor, 1, null, null), null),
Element.Line(cast(q3_x, 'text'), cast(center_y, 'text'), cast(upper_whisker_x, 'text'), cast(center_y, 'text'), Attr.Shapes(null, null, null, pStrokeColor, 1, null, null), null),
Element.Line(cast(lower_whisker_x, 'text'), cast(cap_top, 'text'), cast(lower_whisker_x, 'text'), cast(cap_bot, 'text'), Attr.Shapes(null, null, null, pStrokeColor, 1, null, null), null),
Element.Line(cast(upper_whisker_x, 'text'), cast(cap_top, 'text'), cast(upper_whisker_x, 'text'), cast(cap_bot, 'text'), Attr.Shapes(null, null, null, pStrokeColor, 1, null, null), null),
Element.Rect(cast(q1_x, 'text'), cast(cap_top, 'text'), cast(q3_x - q1_x, 'text'), cast(box_h, 'text'), '2', '2', Attr.Shapes(pFillColor, 0.5, null, pStrokeColor, 1, null, null), null),
Element.Line(cast(median_x, 'text'), cast(cap_top, 'text'), cast(median_x, 'text'), cast(cap_bot, 'text'), Attr.Shapes(null, null, null, pStrokeColor, 2, null, null), null),
coalesce(
unique(pAxisRef)
| select(v: pMeasureRef)
| filter(v < lower_whisker_x
or v > upper_whisker_x)
| select(
svg: Element.Circle(
cast(Scale.Normalize(
v,
axis_min,
axis_max,
lo,
hi,
), 'text'),
cast(center_y, 'text'),
'2.5',
Attr.Shapes(coalesce(pFillColor, Color.Theme('Power BI', 1)), 0.35, null, pStrokeColor, 1, 0.85, null),
null
)
)
| string_agg(svg, sep: ''),
''
),
)
;;
}
// The line chart body: one point per axis value, scaled to the plot area.
function Line {
param pX {
type: 'number'
}
param pY {
type: 'number'
}
param pWidth {
type: 'number'
}
param pHeight {
type: 'number'
}
param pPaddingX {
type: 'number'
}
param pPaddingY {
type: 'number'
}
param pAxisModel {
type: 'model'
}
param pAxisRef {
type: 'dimension'
mode: 'expr'
}
param pMeasureRef {
type: 'number'
mode: 'expr'
}
param pLineColor {
type: 'text'
}
return_type: 'text'
definition: @aql
const color = coalesce(pLineColor, '#01B8AA');
const n = Axis.Count(pAxisModel, pAxisRef, pMeasureRef);
const v_min = Axis.Min(pAxisModel, pAxisRef, pMeasureRef);
const v_max = Axis.Max(pAxisModel, pAxisRef, pMeasureRef);
const d_min = Axis.Min(pAxisModel, pAxisRef, min(epoch(pAxisRef)) / 86400);
const d_max = Axis.Max(pAxisModel, pAxisRef, min(epoch(pAxisRef)) / 86400);
const y_lo = case(when: v_min > 0, then: 0, else: v_min);
const y_hi = case(when: v_max > y_lo, then: v_max, else: y_lo + 1);
const x_span = case(when: d_max > d_min, then: d_max - d_min, else: 1);
case(
when: n == 1,
then: Element.Circle(
cast(Offset(pX, pWidth, pPaddingX) + Plot(pWidth, pPaddingX) / 2, 'text'),
cast(Scale.Normalize(v_max, y_lo, y_hi, Offset(pY, pHeight, pPaddingY) + Plot(pHeight, pPaddingY), Offset(pY, pHeight, pPaddingY)), 'text'),
'2',
Attr.Shapes(color, null, null, null, null, null, null),
null
),
when: n > 1,
then: concat(
"<svg x='", cast(Offset(pX, pWidth, pPaddingX), 'text'),
"' y='", cast(Offset(pY, pHeight, pPaddingY), 'text'),
"' width='", cast(Plot(pWidth, pPaddingX), 'text'),
"' height='", cast(Plot(pHeight, pPaddingY), 'text'),
"' viewBox='", cast(d_min, 'text'), ' ', cast(0 - y_hi, 'text'), ' ', cast(x_span, 'text'), ' ', cast(y_hi - y_lo, 'text'),
"' preserveAspectRatio='none' overflow='visible'>",
Element.Polyline(
coalesce(
unique(pAxisRef)
| select(v: pMeasureRef, d: min(epoch(pAxisRef)) / 86400)
| filter(v is not null)
| select(pt: concat(lpad(cast(d, 'text'), 10, '0'), ',', cast(0 - v, 'text')))
| string_agg(pt, sep: ' ', order: 'asc'),
''
),
concat(
Attr.Shapes('none', null, null, color, 1.5, null, null),
"stroke-linejoin='round' vector-effect='non-scaling-stroke' "
),
null
),
'</svg>'
),
else: ''
)
;;
}
}
// The charts you call from a metric.
module Viz: AqlFunctionModule {
function ProgressBar {
param pValueRefExpr {
type: 'number'
mode: 'expr'
}
param pTrackRefExpr {
type: 'number'
mode: 'expr'
}
param pColor {
type: 'text'
}
param pOrientation {
type: 'text'
}
param pWidth {
type: 'number'
}
param pHeight {
type: 'number'
}
return_type: 'text'
definition: @aql
SVG(
'100%',
'100%',
concat('0 0 ', cast(coalesce(pWidth, 120), 'text'), ' ', cast(coalesce(pHeight, 48), 'text')),
Compound.ProgressBar(
0, 0,
coalesce(pWidth, 120),
coalesce(pHeight, 48),
0, 0,
pValueRefExpr,
pTrackRefExpr,
coalesce(pColor, Color.Theme('Power BI', 1)),
'#E1DFDD',
pOrientation
),
null
)
;;
}
function Boxplot {
param pAxisModel {
type: 'model'
}
param pAxisRef {
type: 'dimension'
mode: 'expr'
}
param pMeasureRef {
type: 'number'
mode: 'expr'
}
param pFillColor {
type: 'text'
}
param pStrokeColor {
type: 'text'
}
param pWidth {
type: 'number'
}
param pHeight {
type: 'number'
}
return_type: 'text'
definition: @aql
SVG(
'100%',
'100%',
concat('0 0 ', cast(coalesce(pWidth, 120), 'text'), ' ', cast(coalesce(pHeight, 48), 'text')),
Compound.Boxplot(
0, 0,
coalesce(pWidth, 120),
coalesce(pHeight, 48),
0, 0,
pAxisModel,
pAxisRef,
pMeasureRef,
coalesce(pFillColor, Color.Theme('Power BI', 1)),
coalesce(pStrokeColor, '#333333')
),
null
)
;;
}
function Line {
param pAxisModel {
type: 'model'
}
param pAxisRef {
type: 'dimension'
mode: 'expr'
}
param pMeasureRef {
type: 'number'
mode: 'expr'
}
param pColor {
type: 'text'
}
param pWidth {
type: 'number'
}
param pHeight {
type: 'number'
}
return_type: 'text'
definition: @aql
SVG(
'100%',
'100%',
concat('0 0 ', cast(coalesce(pWidth, 120), 'text'), ' ', cast(coalesce(pHeight, 48), 'text')),
Compound.Line(
0, 0,
coalesce(pWidth, 120),
coalesce(pHeight, 48),
0, 0.1,
pAxisModel,
pAxisRef,
pMeasureRef,
pColor
),
null
)
;;
}
}
// Per-row statistics for the box plot and line chart.
// Each one aggregates the measure across the values of pAxisRef, for the current row.
module Axis: AqlFunctionModule {
function Min {
param pAxisModel {
type: 'model'
}
param pAxisRef {
type: 'dimension'
mode: 'expr'
}
param pMeasureRef {
type: 'number'
mode: 'expr'
}
return_type: 'number'
definition: @aql
unique(pAxisRef)
| select(x: pMeasureRef)
| min(x)
| of_all(pAxisRef)
;;
}
function Max {
param pAxisModel {
type: 'model'
}
param pAxisRef {
type: 'dimension'
mode: 'expr'
}
param pMeasureRef {
type: 'number'
mode: 'expr'
}
return_type: 'number'
definition: @aql
unique(pAxisRef)
| select(x: pMeasureRef)
| max(x)
| of_all(pAxisRef)
;;
}
function Percentile {
param pAxisModel {
type: 'model'
}
param pAxisRef {
type: 'dimension'
mode: 'expr'
}
param pMeasureRef {
type: 'number'
mode: 'expr'
}
param pPercentile {
type: 'number'
}
return_type: 'number'
definition: @aql
unique(pAxisRef)
| select(x: pMeasureRef)
| percentile_cont(x, pPercentile)
| of_all(pAxisRef)
;;
}
// Number of axis values with a non-null measure.
function Count {
param pAxisModel {
type: 'model'
}
param pAxisRef {
type: 'dimension'
mode: 'expr'
}
param pMeasureRef {
type: 'number'
mode: 'expr'
}
return_type: 'number'
definition: @aql
unique(pAxisRef)
| select(x: pMeasureRef)
| count(x)
| of_all(pAxisRef)
;;
}
}
// Pins the chart to a fixed size inside a table cell.
module Html: AqlFunctionModule {
function Box {
param pWidth {
type: 'number'
}
param pHeight {
type: 'number'
}
param pContents {
type: 'text'
}
return_type: 'text'
definition: @aql
concat(
'<span style="display:inline-block; width:',
cast(pWidth, 'text'),
'px; height:',
cast(pHeight, 'text'),
'px;">',
pContents,
'</span>'
)
;;
}
}
}
Step 2: Import it into a dataset
Dataset ecommerce {
  models: [orders, order_items, products]

  function_module SVG: SVG
}
Step 3: Pick a chart
Credits
Built by Tan Huynh. Ported from DaxLib's daxlib.svg, released under the MIT license.