Basic aggregations
Basic aggregations summarize values in a group into a single metric.
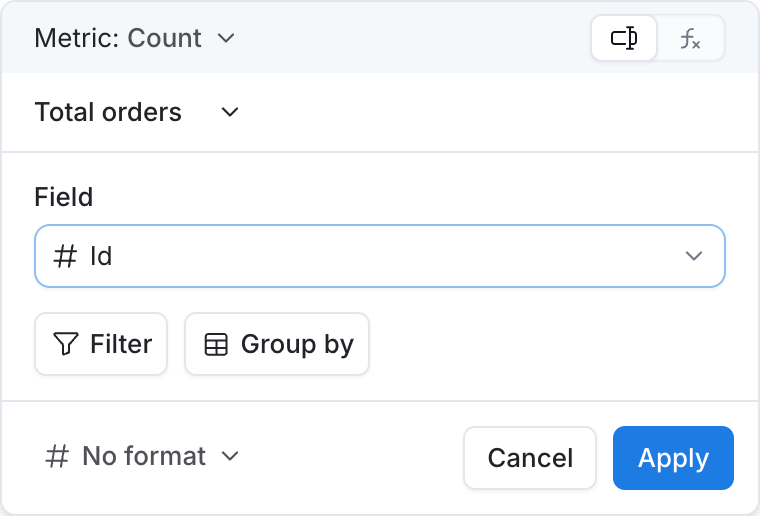
Count
Counts the total number of items in a group.
Inputs
| Input | Required? | Description |
|---|---|---|
| Field | Yes | The dimension whose values to count. |
Use cases
- Number of orders
- Number of support tickets
- Count of line items per invoice
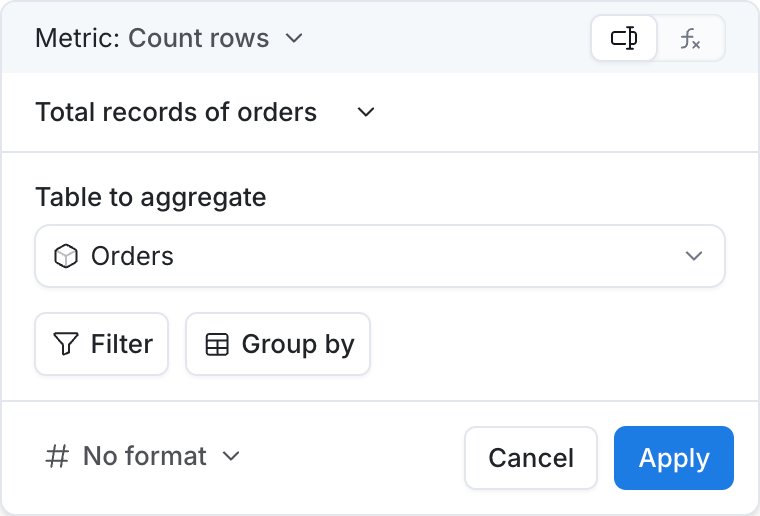
Count rows
Counts the number of rows in a table.
Inputs
| Input | Required? | Description |
|---|---|---|
| Table to aggregate | Yes | The table (data model) whose rows to count. |
Use cases
- Number of records in a model
- Row count of events after filters
- Size of a staging table
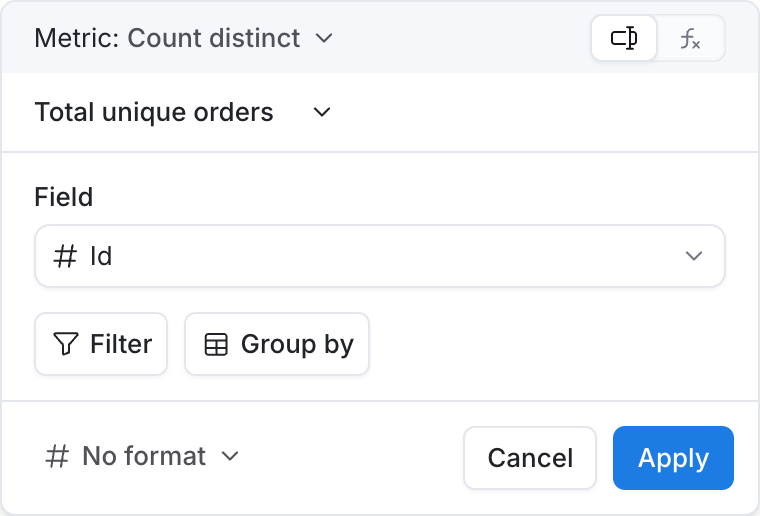
Count distinct
Counts the total number of distinct items in a group.
Inputs
| Input | Required? | Description |
|---|---|---|
| Field | Yes | The dimension whose unique values to count. |
Use cases
- Number of unique customers
- Distinct products sold
- Unique countries with orders
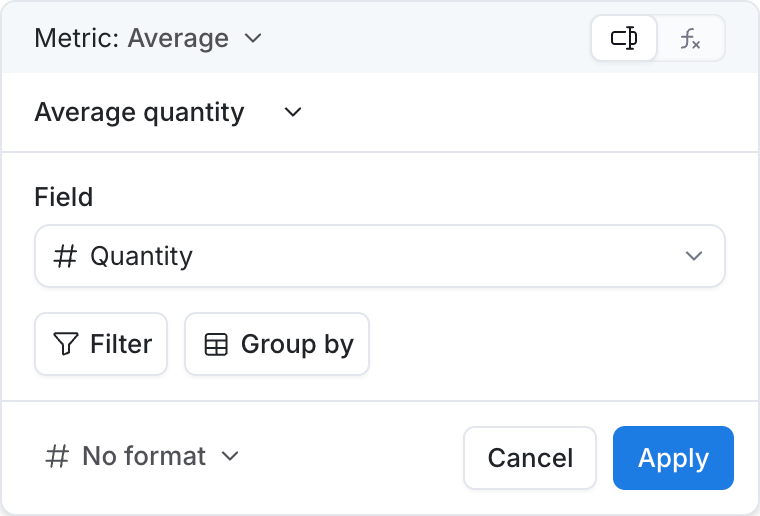
Average
Calculates the average of values in a group.
Inputs
| Input | Required? | Description |
|---|---|---|
| Field | Yes | The numeric dimension to average. |
Use cases
- Average order value
- Mean session duration
- Average items per cart
Min
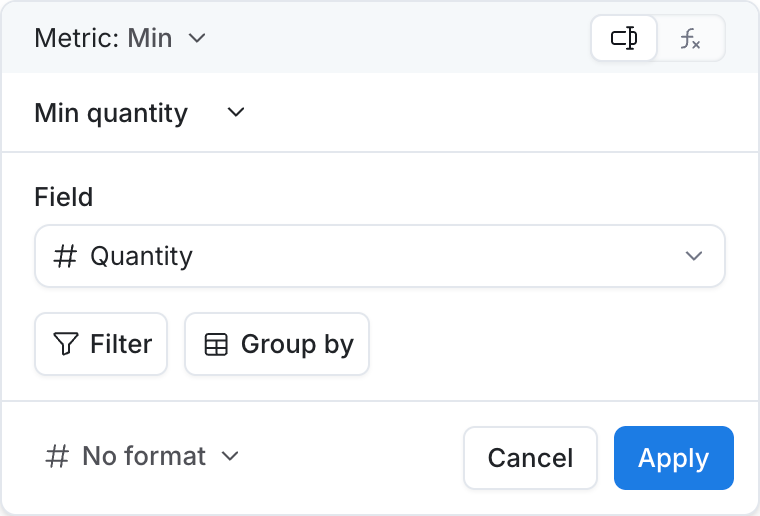
Returns the item in the group with the smallest value.
Inputs
| Input | Required? | Description |
|---|---|---|
| Field | Yes | The dimension to find the minimum of. |
Use cases
- Earliest signup date
- Lowest order amount
- First event timestamp
Max
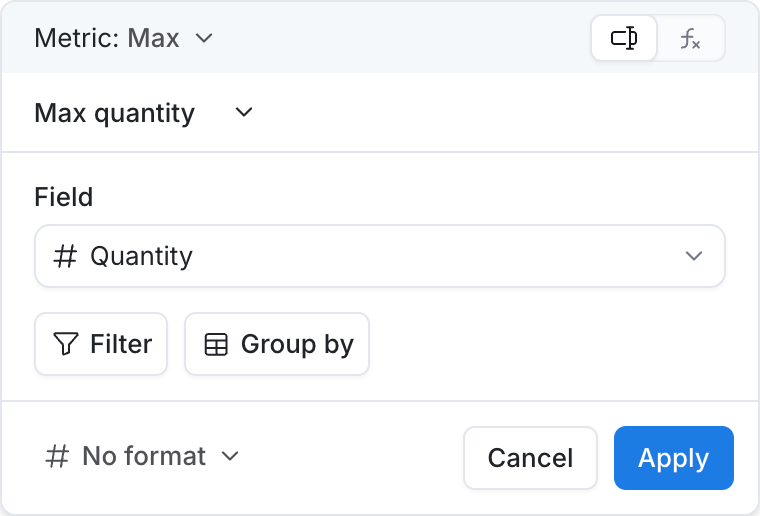
Returns the item in the group with the largest value.
Inputs
| Input | Required? | Description |
|---|---|---|
| Field | Yes | The dimension to find the maximum of. |
Use cases
- Highest order amount
- Latest login time
- Peak daily active users
Sum
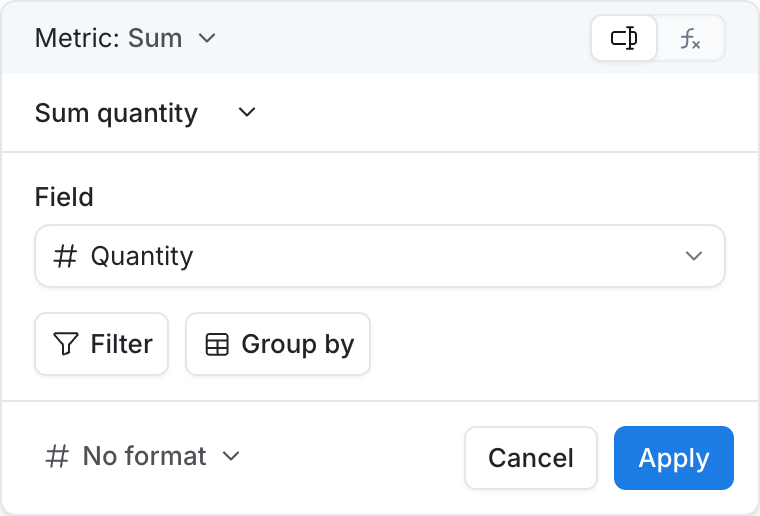
Calculates the sum of values in the group.
Inputs
| Input | Required? | Description |
|---|---|---|
| Field | Yes | The numeric dimension to add up. |
Use cases
- Total revenue
- Sum of quantities ordered
- Total discount amount
Median
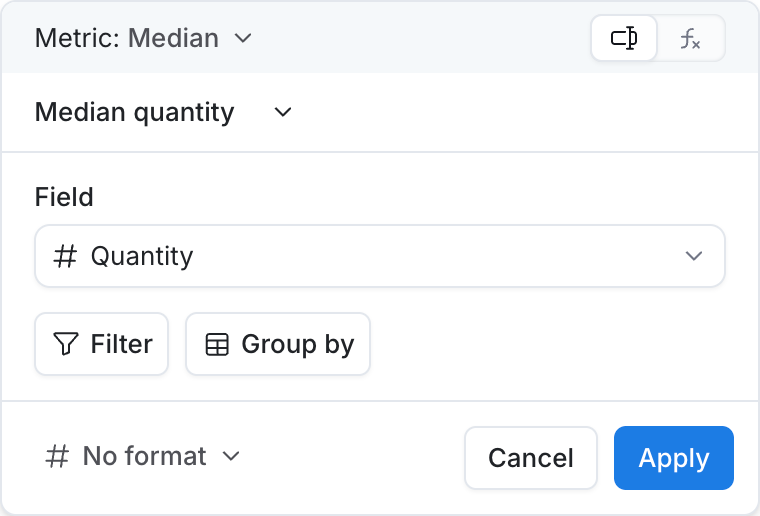
Computes the median of the values in the group.
Inputs
| Input | Required? | Description |
|---|---|---|
| Field | Yes | The numeric dimension to find the median of. |
Use cases
- Median order value
- Median time to first response
- Median household income in a segment
Continuous percentile
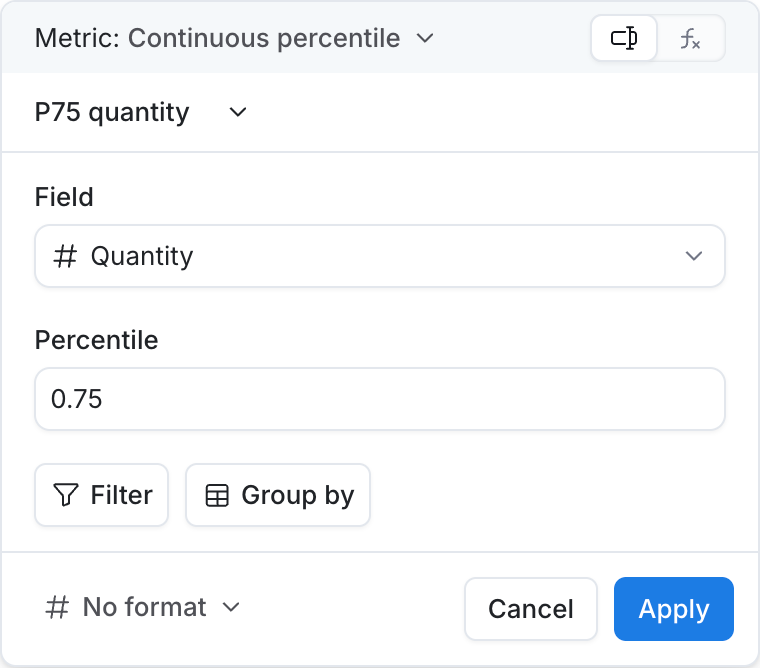
Returns the value at the given percentile of the sorted expression values, interpolating between adjacent values if needed.
Inputs
| Input | Required? | Description |
|---|---|---|
| Field | Yes | The numeric dimension to compute the percentile of. |
| Percentile | Yes | Where in the distribution to read the value:
|
Use cases
- 95th percentile of response time (P95 preset)
- P75 order value for pricing decisions
- P50 as a continuous median of session duration
Discrete percentile
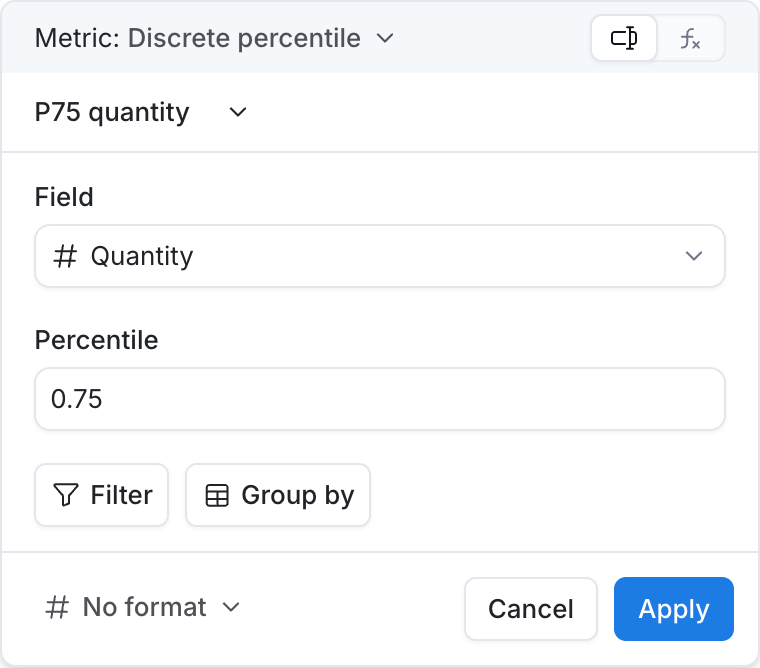
Returns the value at the given percentile of the sorted expression values. If the percentile falls between two values, one of them will be returned (the logic to select the value is database dependent).
Inputs
| Input | Required? | Description |
|---|---|---|
| Field | Yes | The numeric dimension to compute the percentile of. |
| Percentile | Yes | Where in the distribution to read the value:
|
Use cases
- 90th percentile of order value (P90 preset)
- Discrete P50 when you need an actual observed value, not an interpolated one
- P99 query latency without interpolation
Sample standard deviation
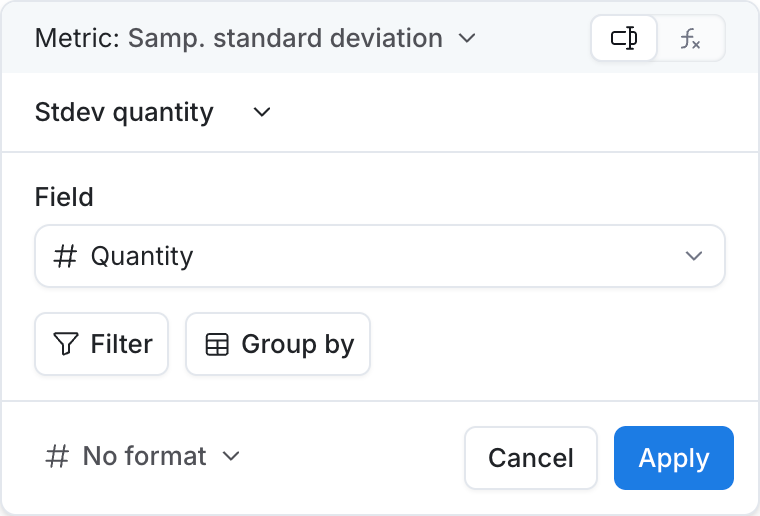
Computes the sample standard deviation of the values in the group.
Inputs
| Input | Required? | Description |
|---|---|---|
| Field | Yes | The numeric dimension to measure spread for (sample). |
Use cases
- Variability of order value (sample)
- Spread of delivery times across a sample of shipments
- Volatility of daily signups in a sampled window
Population standard deviation
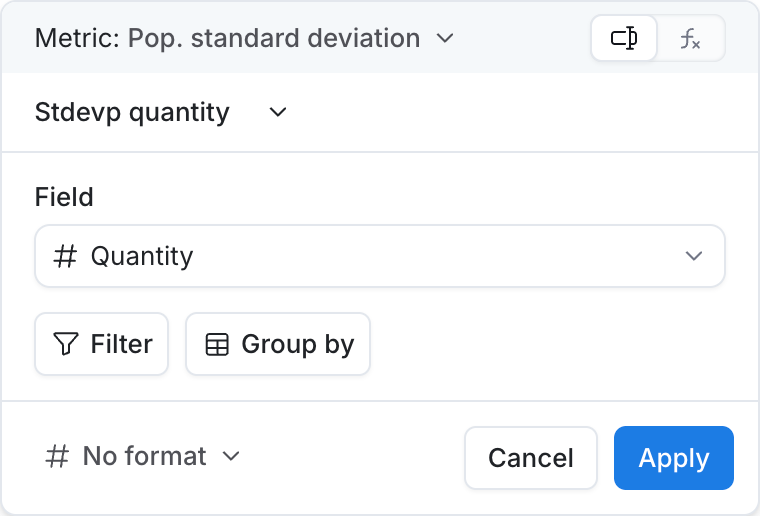
Computes the population standard deviation of the values in the group.
Inputs
| Input | Required? | Description |
|---|---|---|
| Field | Yes | The numeric dimension to measure spread for (population). |
Use cases
- Variability of order value (population)
- Spread of all scores in an exam
- Volatility across the full set of daily returns
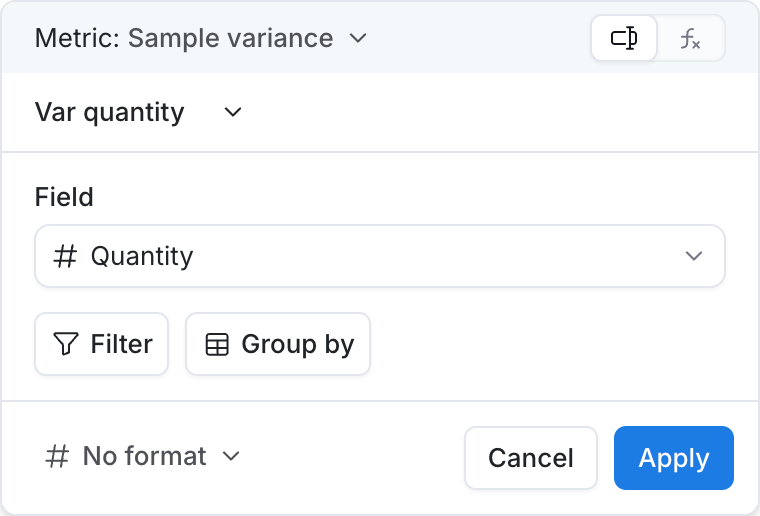
Sample variance
Returns the sample variance of the values in the group.
Inputs
| Input | Required? | Description |
|---|---|---|
| Field | Yes | The numeric dimension to compute sample variance for. |
Use cases
- Sample order-value variance
- Variance of response times in a sample
- Variance of basket sizes in an A/B test sample
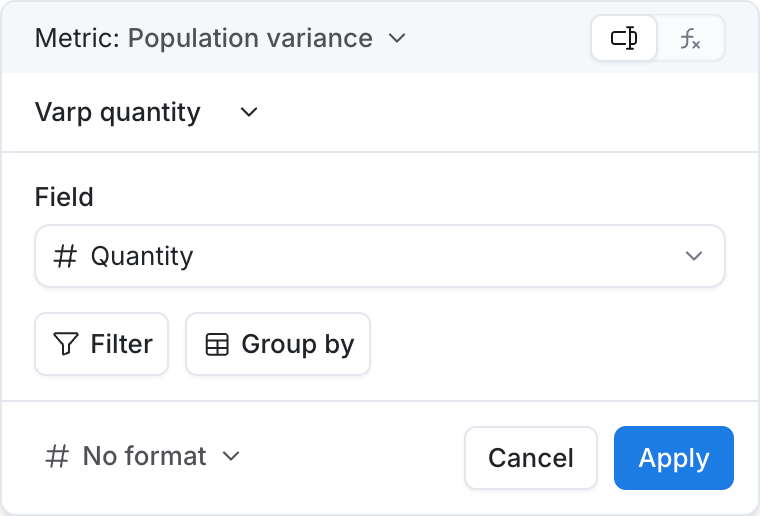
Population variance
Returns the population variance of the values in the group.
Inputs
| Input | Required? | Description |
|---|---|---|
| Field | Yes | The numeric dimension to compute population variance for. |
Use cases
- Population order-value variance
- Variance of all monthly revenues in the dataset
- Variance of completion times for every attempt