Comparative calculations
Comparative calculations put a metric in context, either against a total (its share of the whole) or against a past period (how it changed).
Percent of total
Calculates the percentage of a metric relative to the original value of that metric.
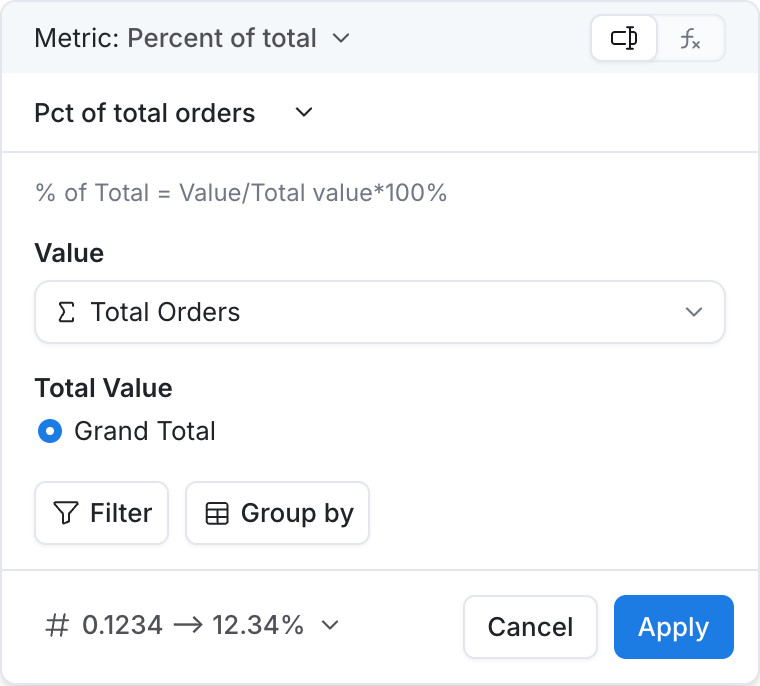
Inputs
| Input | Required? | Description |
|---|---|---|
| Value | Yes | The metric to turn into a share. |
| Total Value | Yes | Which total to divide by:
|
Use cases
- Revenue share by product category
- Gender mix within each signup year
- Region's share of orders within a channel
- Product share of revenue within each country
Period over period
Calculates the change of a metric between two periods.
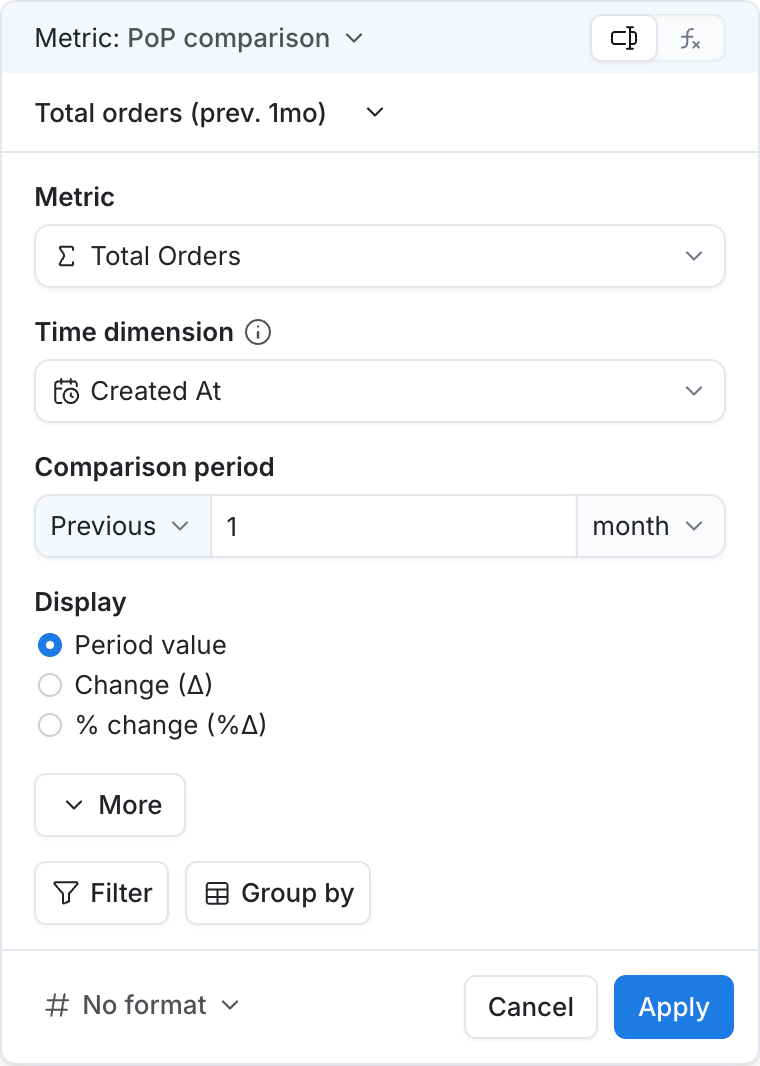
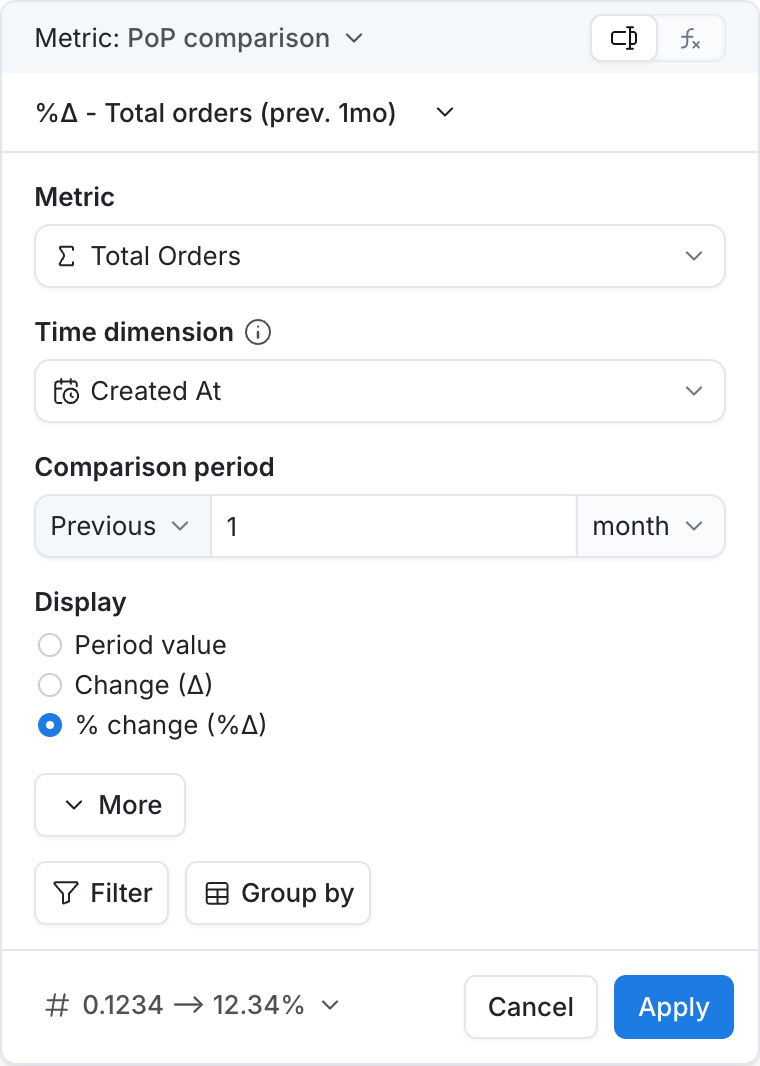
Inputs
| Input | Required? | Description |
|---|---|---|
| Metric | Yes | The metric to compare across periods. |
| Time dimension | Yes | The date/time field to shift along. On the viz where this period over period metric is used, include this time dimension with at least hour granularity. |
| Comparison period | Yes | How far to compare:
|
| Display | Yes | What to show for each row:
|
Use cases
- This month's orders vs same month last year
- Weekly revenue vs the prior week
- Today's signups vs same weekday last week
- Campaign week GMV vs a fixed baseline week