Window calculations
Window calculations rank, accumulate, or smooth values across related rows.
Rank
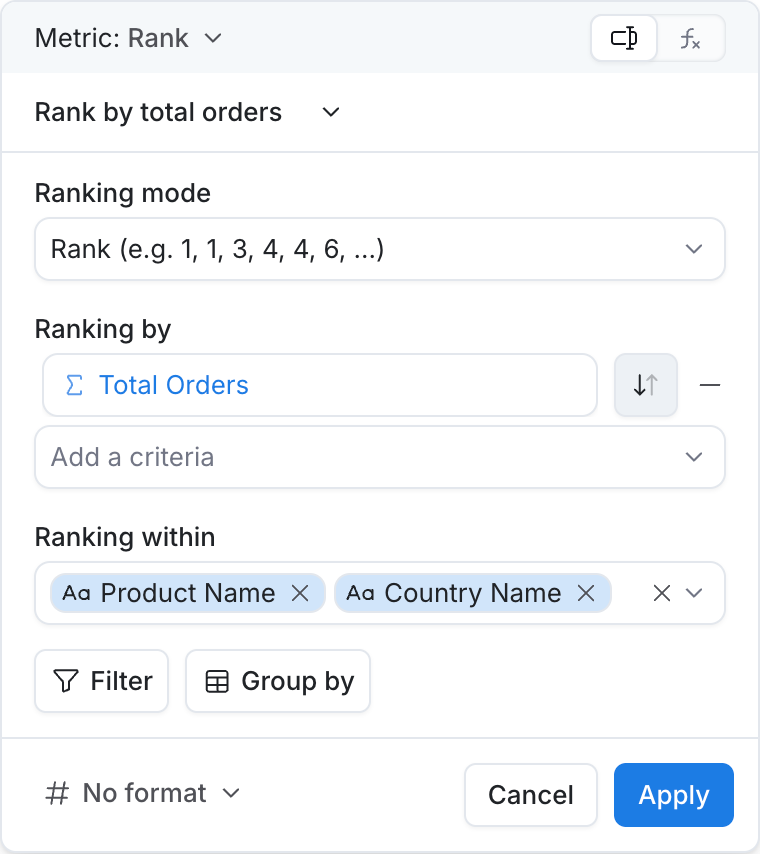
Assigns a rank to each record based on the order of specified fields, optionally within partitions.
Inputs
| Input | Required? | Description |
|---|---|---|
| Ranking mode | Yes | How ties are numbered:
|
| Ranking by | Yes | One or more fields to sort by, each ascending or descending. |
| Ranking within | No | Restart the ranking within each group (partition). |
Use cases
- Rank products by total sales
- Top customers by revenue within each region
- Leaderboard of support agents by tickets closed
Running total
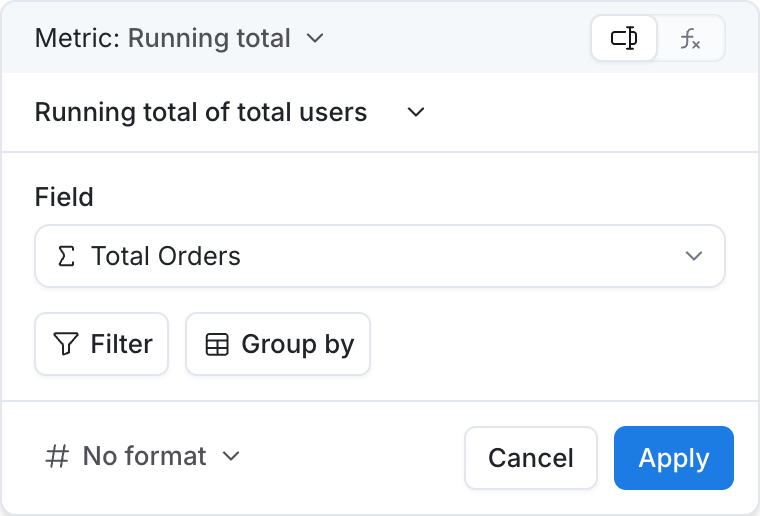
Calculates a running sum, average, min, or max of a metric along a date dimension on the viz.
Note: To run along a non-date dimension, switch to Formula mode and use running_total.
Inputs
| Input | Required? | Description |
|---|---|---|
| Field | Yes | The metric (or dimension) to accumulate along the date dimension on the viz. |
| Dimension aggregation | Yes (when Field is a dimension) | How to aggregate the dimension before running (e.g. Count, Sum). |
Use cases
- Cumulative total users over time
- Year-to-date revenue by quarter
- Running count of orders since launch
Moving calculations
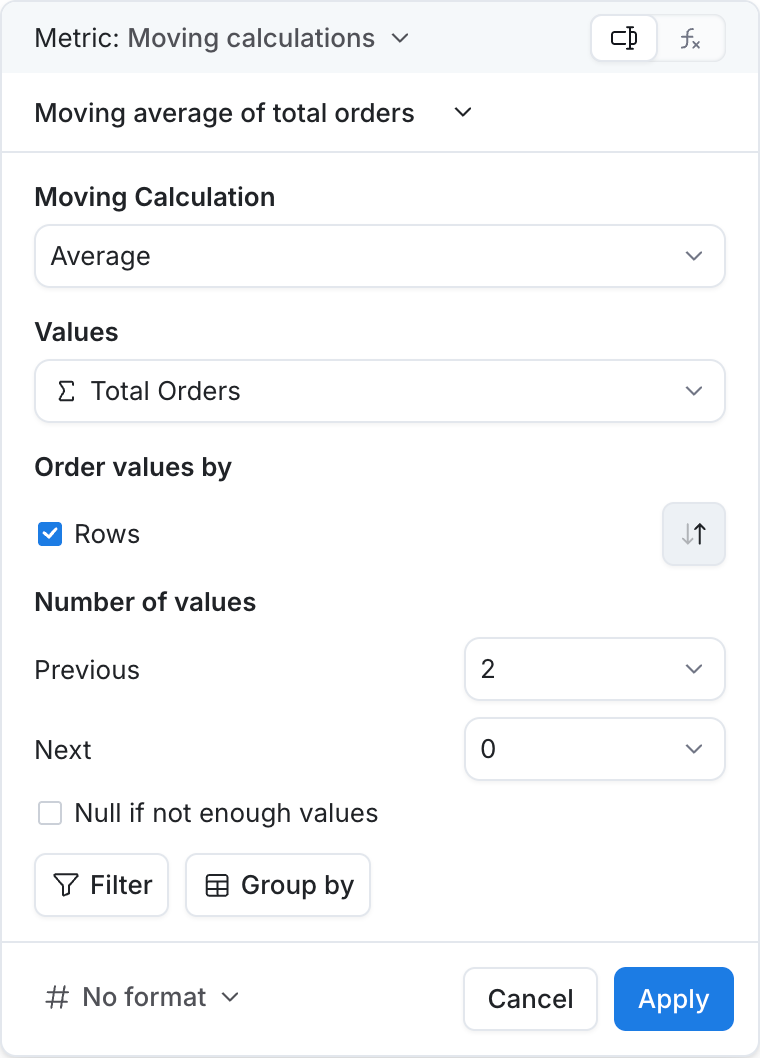
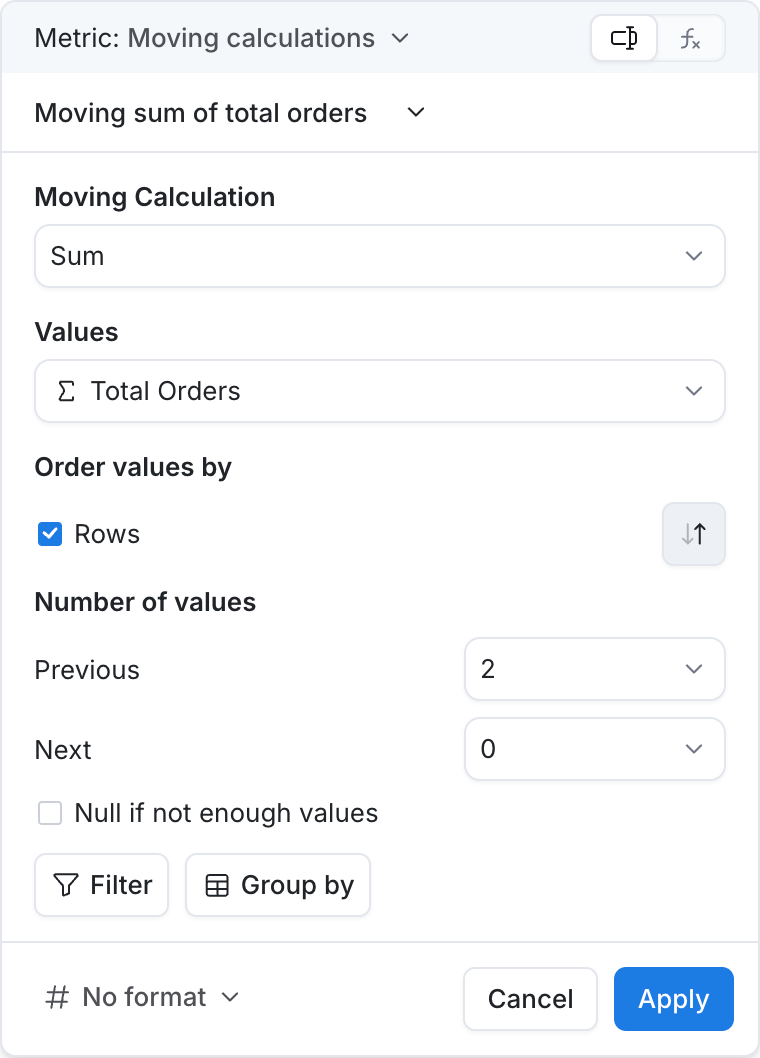
Calculate a moving calculation on a metric.
Inputs
| Input | Required? | Description |
|---|---|---|
| Moving Calculation | Yes | The function over the window (full list):
|
| Values | Yes | The metric to compute over the moving window. |
| Order values by | Yes | The direction the window slides. Only options that fit the current viz are shown:
|
| Number of values | Yes | Window size as Previous (behind) and Next (ahead), plus the current value:
|
| Null if not enough values | No | What to do when the window is incomplete (start/end of the series):
|
Use cases
- 7-day moving average of orders
- Rolling 4-week revenue sum
- Moving max of daily active users over the last 14 days