Box Plot
A box plot summarizes the distribution of quantitative values by visualizing the median, first, and third quartiles in a single chart. Each box shows the interquartile range, the line inside marks the median, and the whiskers reach out to the rest of the spread.
- Good for: comparing distributions across categories, spotting spread and skew, surfacing outliers in a metric.
- Not great for: showing a single total or count per category (use a bar chart), trends over time (use a line chart), or part-to-whole composition (use a pie or treemap chart).
Syntax
Three variants are available, all taking the same two fields:
- Basic Box Plot: vertical boxes with a minimal option set.
- Horizontal Box Plot: boxes laid out left to right, with color and outlier controls.
- Vertical Box Plot: vertical boxes with the same color and outlier controls as the horizontal variant.
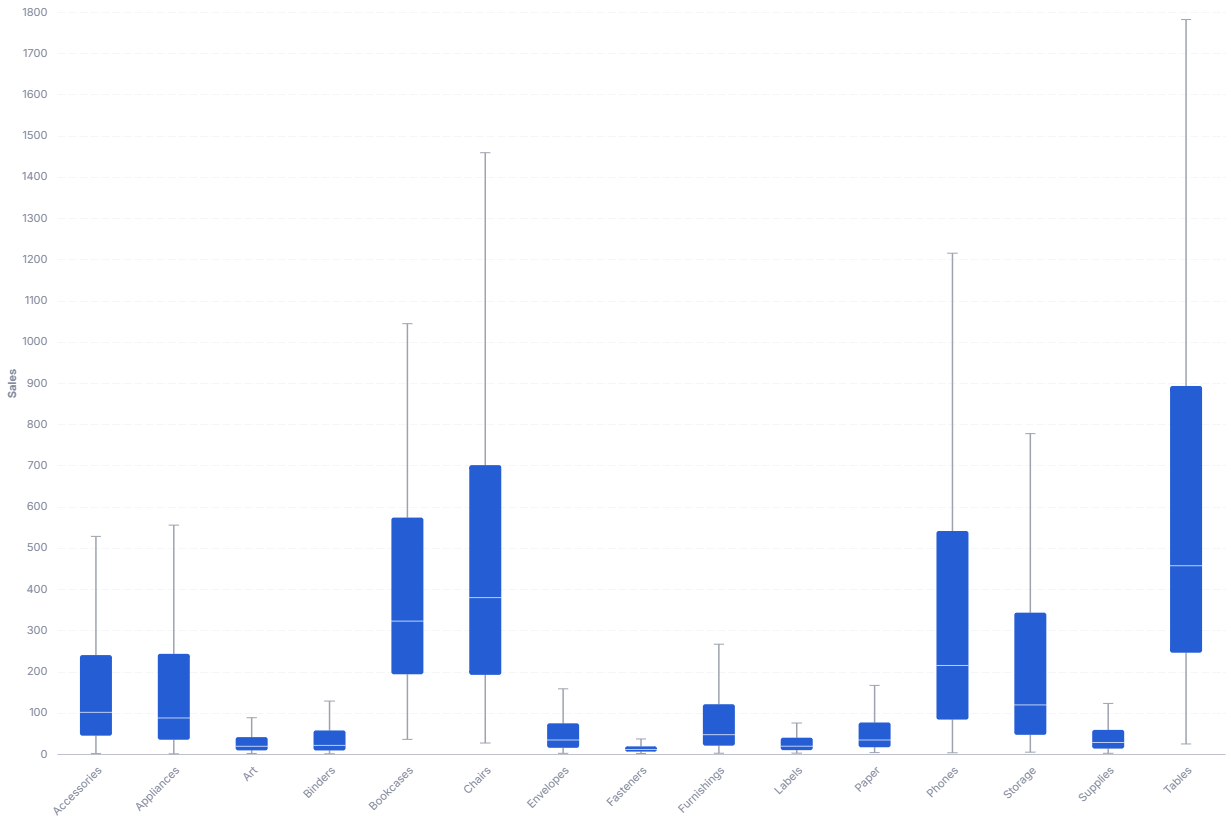
Basic Box Plot
CustomChartDef box_plot {
  label: 'Box Plot'
  description: 'To summarize the distribution of a quantitative value across categories by showing the median, quartiles, and range.'
  fields {
    field dimension {
      label: 'Dimension'
      type: 'dimension'
      sort {
        apply_order: 1
        direction: 'asc'
      }
    }
    field value {
      label: 'Value'
      type: 'dimension'
      data_type: 'number'
      sort {
        apply_order: 2
        direction: 'asc'
      }
    }
  }

  options {
    option tooltip {
      type: 'toggle'
      label: 'Show tooltip'
      default_value: true
    }
    option show_outliers {
      type: 'toggle'
      label: 'Show outliers'
      default_value: false
    }
  }

  template: @vgl {
    "data": {
      "values": @{values}
    },

    "layer": [
      {
        "mark": {
          "type": "boxplot",
          "extent": 1.5,
          "size": 32,
          "outliers": @{options.show_outliers.value},
          "box": {"cornerRadius": 2},
          "median": {"color": "white", "strokeWidth": 2},
          "rule": {"color": "#9CA3AF", "size": 1.5},
          "ticks": {"color": "#9CA3AF", "size": 10},
          "tooltip": @{options.tooltip.value}
        },
        "encoding": {
          "x": {
            "field": @{fields.dimension.name},
            "type": "nominal"
          },
          "y": {
            "field": @{fields.value.name},
            "type": "quantitative",
            "scale": {"zero": false},
            "axis": {"format": @{fields.value.format}, "formatType": "holisticsFormat"}
          },
          "color": {"value": "#255DD4"}
        }
      },
      {
        "params": [
          {"name": "normalPointSelection", "select": {"type": "point", "fields": [@{fields.dimension.name}], "toggle": "true", "clear": "mouseup"}},
          {"name": "hoverPointSelection", "select": {"type": "point", "fields": [@{fields.dimension.name}], "on": "mouseover", "clear": "mouseout"}}
        ],
        "mark": {"type": "rule", "opacity": 0, "size": 40},
        "encoding": {
          "x": {"field": @{fields.dimension.name}, "type": "nominal"}
        }
      }
    ],

    "holisticsConfig": {
      "crossFilterSignals": ["normalPointSelection"],
      "contextMenuSignals": ["hoverPointSelection"]
    },

    "config": {
      "background": null,
      "view": {"stroke": null},
      "font": "Inter",
      "axis": {
        "title": null,
        "ticks": false,
        "labelPadding": 10,
        "labelFontSize": 11,
        "labelColor": "#858B9E",
        "titleColor": "#858B9E",
        "labelOverlap": "parity",
        "gridDash": [8, 3],
        "gridColor": "#F4F6F8",
        "domainColor": "#bec1cb"
      },
      "axisX": {"grid": false, "labelAngle": -45},
      "axisY": {"domain": false, "grid": true}
    }
  };;
}
Legacy syntax
CustomChart {
  fields {
    field a {                    // this is to define to holistics the first field input
      type: "dimension"
      label: "Categorical field"
    }
    field b {                  // this is to define to holistics the second field input
      type: "dimension"
      label: "Quantitative field"
    }
  }

  options {
    option tooltip {
      type: 'toggle'
      label: 'Show tooltip'
      default_value: true
    }
  }

  template: @vgl {
    "data": {
      "values": @{values}
    },

    "mark": {
      "type": "boxplot",
      "extent": "min-max",
      "tooltip": @{options.tooltip.value}
    },

    "encoding": {
      "x": {
        "field": @{fields.a.name},
        "type": "nominal"
      },

      "color": {
        "field": @{fields.a.name},
        "type": "nominal",
        "legend": null
      },

      "y": {
        "field": @{fields.b.name},
        "type": "quantitative",
        "scale": {"zero": false}
      }
    }
  };;
}
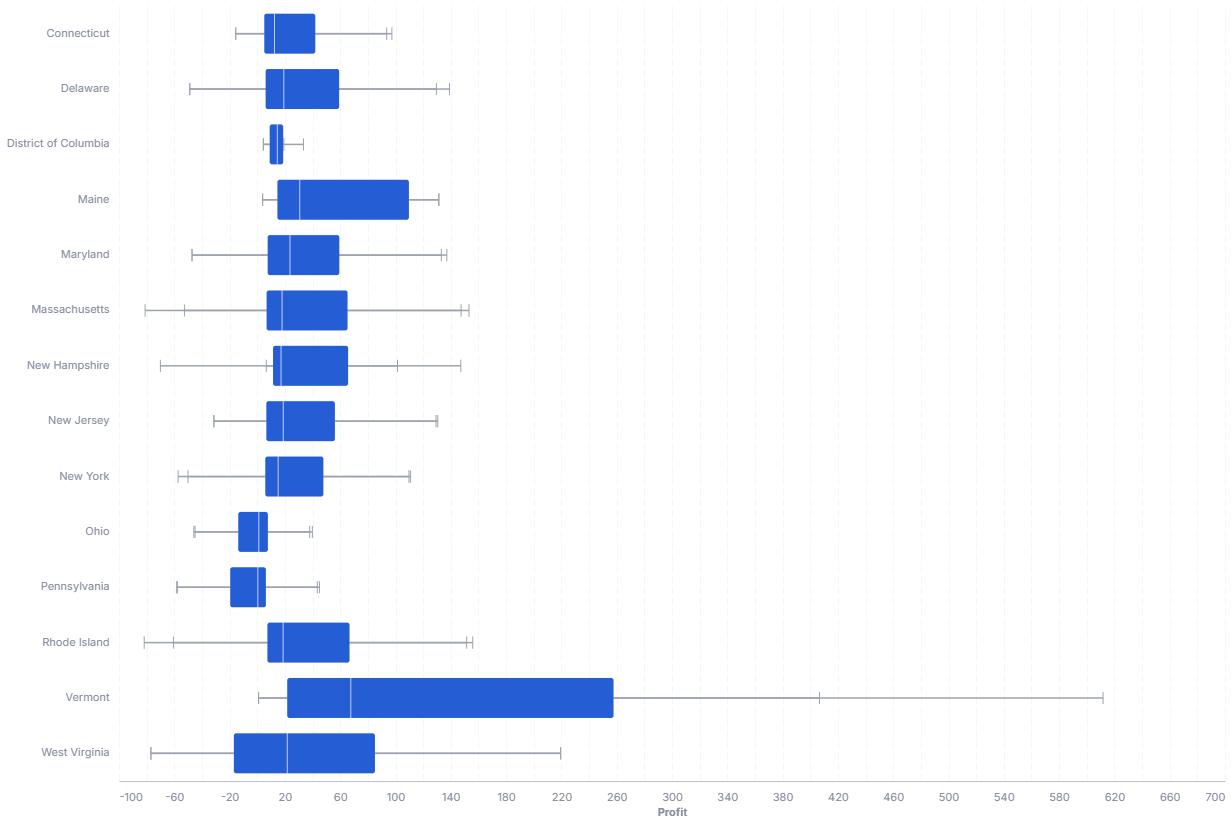
Horizontal Box Plot
// Box Plot with horizontal boxes. Select a categorical and quantitative items
// control colors, outliers, extent and font style

CustomChartDef box_plot_horizontal {
  label: 'Horizontal Box Plot'
  description: 'To compare the distribution of a value across categories using horizontal boxes, with control over colors, outliers, and extent.'
  fields {
    field dimension {
      label: 'Dimension'
      type: 'dimension'
      sort {
        apply_order: 1
        direction: 'asc'
      }
    }
    field value {
      label: 'Value'
      type: 'dimension'
      data_type: 'number'
      sort {
        apply_order: 2
        direction: 'asc'
      }
    }
  }

  options {
    option show_outliers {
        type: 'toggle'
        label: 'Show outliers'
        default_value: false
    }

    option box_size {
      type: 'number-input'
      label: 'Box Size'
      default_value: 40
    }

    option box_color {
      type: 'color-picker'
      label: 'Box Color'
      default_value: '#255DD4'
    }

    option median_color {
      type: 'color-picker'
      label: 'Median Color'
      default_value: 'white'
    }

    option extent {
      type: 'input'
      label: 'Outlier detection scale (may use "min-max" as input)'
      default_value: 1.5
    }

  }

  template: @vgl {
    "data": {
            "values": @{values}
    },

    "mark": {
      "type": "boxplot",
      "extent": @{options.extent.value},
      "size": @{options.box_size.value},
      "outliers": @{options.show_outliers.value},
      "box": {"cornerRadius": 2},
      "median": {
        "color": @{options.median_color.value},
        "strokeWidth": 2
        },
      "rule": {"color": "#9CA3AF", "size": 1.5},
      "ticks": {"color": "#9CA3AF", "size": 12}
    },
    "encoding": {
      "x": {
          "field": @{fields.value.name},
          "type": "quantitative",
          "scale": {"zero": false},
          "axis": {"format": @{fields.value.format}, "formatType": "holisticsFormat"}
      },
      "y": {
        "field": @{fields.dimension.name},
        "type": "nominal"
      },
      "tooltip": {
        "field": @{fields.value.name},
        "type": "quantitative"
      },
      "color": {
          "value": @{options.box_color.value}
      }
    },

    "config": {
      "background": null,
      "view": {"stroke": null},
      "font": "Inter",
      "axis": {
        "title": null,
        "ticks": false,
        "labelPadding": 10,
        "labelFontSize": 11,
        "labelColor": "#858B9E",
        "titleColor": "#858B9E",
        "labelOverlap": "parity",
        "gridDash": [8, 3],
        "gridColor": "#F4F6F8",
        "domainColor": "#bec1cb"
      },
      "axisX": {"grid": true},
      "axisY": {"domain": false, "grid": false}
    }
  };;
}
Legacy syntax
// Box Plot with horizontal boxes. Select a categorical and quantitative items
// control colors, outliers, extent and font style

CustomChart {
  fields {
    field group {                    // this is to define to holistics the first field input
      type: "dimension"
      label: "Group by category"
    }
    field measure {                  // this is to define to holistics the second field input
      type: "dimension"
      label: "Value to analyze"
      data_type: "number"
    }
  }

  options {
    option show_outliers {
        type: 'toggle'
        label: 'Show outliers'
        default_value: false
    }

    option box_size {
      type: 'number-input'
      label: 'Box Size'
      default_value: 90
    }

    option font {
      type: 'select'
      label: 'Chart Labels Font'
      options: ['monospace', 'sans-serif', 'serif', 'sans']
      default_value: 'sans-serif'
    }

    option box_color {
      type: 'color-picker'
      label: 'Box Color'
      default_value: '#0091B3'
    }

    option median_color {
      type: 'color-picker'
      label: 'Median Color'
      default_value: 'red'
    }

    option bckgrnd {
      type: 'color-picker'
      label: 'Chart Background Color'
      default_value: 'white'
    }

    option extent {
      type: 'input'
      label: 'Outlier detetction scale (may use "min-max" as input)'
      default_value: 1.5
    }

  }

  template: @vgl {
    "data": {
            "values": @{values}
    },

    "config": {
      "font": @{options.font.value},
      "background": @{options.bckgrnd.value},
      "autosize": {"type": "fit"}
    },

    "mark": {
      "type": "boxplot",
      "extent": @{options.extent.value},
      "median": {
        "color": @{options.median_color.value}
        },
      "outliers": @{options.show_outliers.value},
      "ticks": true
    },
    "encoding": {
      "x": {
          "field": @{fields.measure.name},
          "type": "quantitative"
      },
      "y": {
        "field": @{fields.group.name},
        "type": "nominal",
        "scale": {"zero": false}
      },
      "tooltip": {
        "field": @{fields.measure.name},
        "type": "quantitative"
      },
      "color": {
          "value": @{options.box_color.value}
      },
      "size": {"value": @{options.box_size.value}},
    }
  };;
}
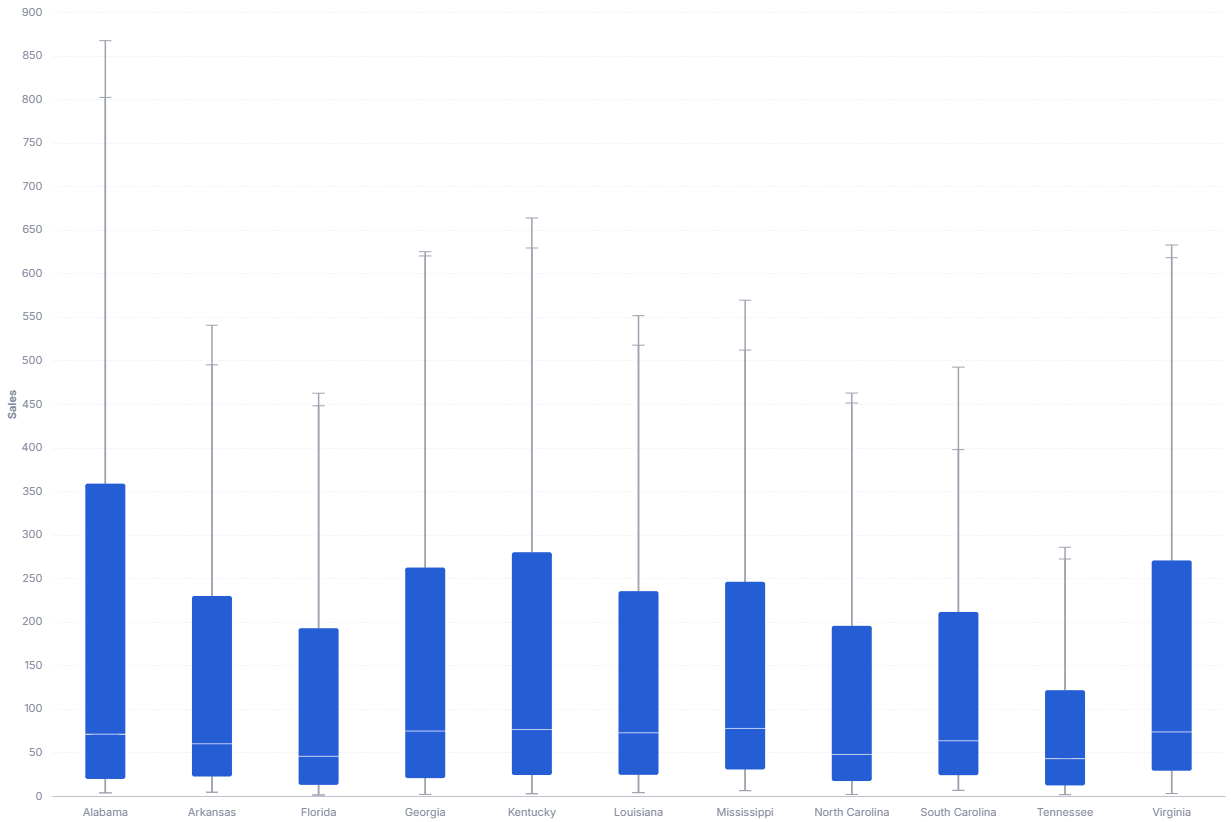
Vertical Box Plot
// Box Plot with vertical boxes. Select a categorical and quantitative items
// control colors, outliers, extent and font style

CustomChartDef box_plot_vertical {
  label: 'Vertical Box Plot'
  description: 'To compare the distribution of a value across categories using vertical boxes, with control over colors, outliers, and extent.'
  fields {
    field dimension {
      label: 'Dimension'
      type: 'dimension'
      sort {
        apply_order: 1
        direction: 'asc'
      }
    }
    field value {
      label: 'Value'
      type: 'dimension'
      data_type: 'number'
      sort {
        apply_order: 2
        direction: 'asc'
      }
    }
  }

  options {
    option show_outliers {
        type: 'toggle'
        label: 'Show outliers'
        default_value: false
    }

    option box_size {
      type: 'number-input'
      label: 'Box Size'
      default_value: 40
    }

    option box_color {
      type: 'color-picker'
      label: 'Box Color'
      default_value: '#255DD4'
    }

    option median_color {
      type: 'color-picker'
      label: 'Median Color'
      default_value: 'white'
    }

    option extent {
      type: 'input'
      label: 'Outlier detection scale (may use "min-max" as input)'
      default_value: 1.5
    }

  }

  template: @vgl {
    "data": {
            "values": @{values}
    },

    "mark": {
      "type": "boxplot",
      "extent": @{options.extent.value},
      "size": @{options.box_size.value},
      "outliers": @{options.show_outliers.value},
      "box": {"cornerRadius": 2},
      "median": {
        "color": @{options.median_color.value},
        "strokeWidth": 2
        },
      "rule": {"color": "#9CA3AF", "size": 1.5},
      "ticks": {"color": "#9CA3AF", "size": 12}
    },
    "encoding": {
      "x": {
          "field": @{fields.dimension.name},
          "type": "nominal"
      },
      "y": {
        "field": @{fields.value.name},
        "type": "quantitative",
        "scale": {"zero": false},
        "axis": {"format": @{fields.value.format}, "formatType": "holisticsFormat"}
      },
      "tooltip": {
        "field": @{fields.value.name},
        "type": "quantitative"
      },
      "color": {
          "value": @{options.box_color.value}
      }
    },

    "config": {
      "background": null,
      "view": {"stroke": null},
      "font": "Inter",
      "axis": {
        "title": null,
        "ticks": false,
        "labelPadding": 10,
        "labelFontSize": 11,
        "labelColor": "#858B9E",
        "titleColor": "#858B9E",
        "labelOverlap": "parity",
        "gridDash": [8, 3],
        "gridColor": "#F4F6F8",
        "domainColor": "#bec1cb"
      },
      "axisX": {"grid": false, "labelAngle": 0},
      "axisY": {"domain": false, "grid": true}
    }
  };;
}
Legacy syntax
// Box Plot with vertical boxes. Select a categorical and quantitative items
// control colors, outliers, extent and font style

CustomChart {
  fields {
    field group {                    // this is to define to holistics the first field input
      type: "dimension"
      label: "Group by category"
    }
    field measure {                  // this is to define to holistics the second field input
      type: "dimension"
      label: "Value to analyze"
      data_type: "number"
    }
  }

  options {
    option show_outliers {
        type: 'toggle'
        label: 'Show outliers'
        default_value: false
    }

    option box_size {
      type: 'number-input'
      label: 'Box Size'
      default_value: 90
    }

    option font {
      type: 'select'
      label: 'Chart Labels Font'
      options: ['monospace', 'sans-serif', 'serif', 'sans']
      default_value: 'sans-serif'
    }

    option box_color {
      type: 'color-picker'
      label: 'Box Color'
      default_value: '#0091B3'
    }

    option median_color {
      type: 'color-picker'
      label: 'Median Color'
      default_value: 'red'
    }

    option bckgrnd {
      type: 'color-picker'
      label: 'Chart Background Color'
      default_value: 'white'
    }

    option extent {
      type: 'input'
      label: 'Outlier detetction scale (may use "min-max" as input)'
      default_value: 1.5
    }

  }

  template: @vgl {
    "data": {
            "values": @{values}
    },

    "config": {
      "font": @{options.font.value},
      "background": @{options.bckgrnd.value},
      "autosize": {"type": "fit"}
    },

    "mark": {
      "type": "boxplot",
      "extent": @{options.extent.value},
      "median": {
        "color": @{options.median_color.value}
        },
      "outliers": @{options.show_outliers.value},
      "ticks": true
    },
    "encoding": {
      "x": {
          "field": @{fields.group.name},
          "type": "nominal"
      },
      "y": {
        "field": @{fields.measure.name},
        "type": "quantitative",
        "scale": {"zero": false}
      },
      "tooltip": {
        "field": @{fields.measure.name},
        "type": "quantitative"
      },
      "color": {
          "value": @{options.box_color.value}
      },
      "size": {"value": @{options.box_size.value}}
    }
  };;
}
Required fields
Every variant expects exactly two fields: a category dimension and the numeric value to summarize. The fields are identical across the Basic, Horizontal, and Vertical variants, so the same table applies to all three.
| Field | Label | Type | Role |
|---|---|---|---|
dimension | Dimension | dimension | Category that splits the data into one box per group. Sorted ascending (apply_order: 1). |
value | Value | dimension | Numeric observations (data_type: 'number') the box plot summarizes into median, quartiles, and whiskers. Sorted ascending (apply_order: 2). |
Data requirements: Pass raw, unaggregated rows (one row per observation), since the boxplot mark computes the median and quartiles itself; do not pre-aggregate to one value per category, or each box collapses to a single point.
Sample data: Each row is one observation. Repeat the category across many rows so the chart has a distribution to summarize.
| dimension | value |
|---|---|
| North | 120 |
| North | 135 |
| North | 98 |
| North | 210 |
| South | 88 |
| South | 142 |
| South | 119 |
| South | 305 |
Options
Set these options to adjust the chart without editing the Vega template. The CustomChartDef block above declares each option's type and allowed values. The variants expose different option sets.
Basic Box Plot:
| Option | Default | Effect |
|---|---|---|
tooltip | true | Shows a tooltip with the box statistics on hover. |
show_outliers | false | Plots individual outlier points beyond the whiskers when on. |
Horizontal and Vertical Box Plot: Both variants share the same options.
| Option | Default | Effect |
|---|---|---|
show_outliers | false | Plots individual outlier points beyond the whiskers when on. |
box_size | 40 | Thickness of each box, in pixels. |
box_color | #255DD4 | Fill color of the boxes. |
median_color | white | Color of the median line inside each box. |
extent | 1.5 | Whisker reach as a multiple of the interquartile range. Enter min-max to extend whiskers to the full data range. |
Known limitations
-
Needs raw rows, not aggregates. The mark derives quartiles from the underlying values, so pre-aggregated data (one value per category) leaves nothing to summarize.
-
Each category needs enough observations. Boxes built from very few rows give misleading quartiles and whiskers. Make sure each group has a meaningful number of points.
-
Whisker extent changes which points count as outliers. A higher
extent(ormin-max) pulls the whiskers out and reclassifies points, so the same data can look outlier-free or outlier-heavy depending on the setting.