Bullet Chart
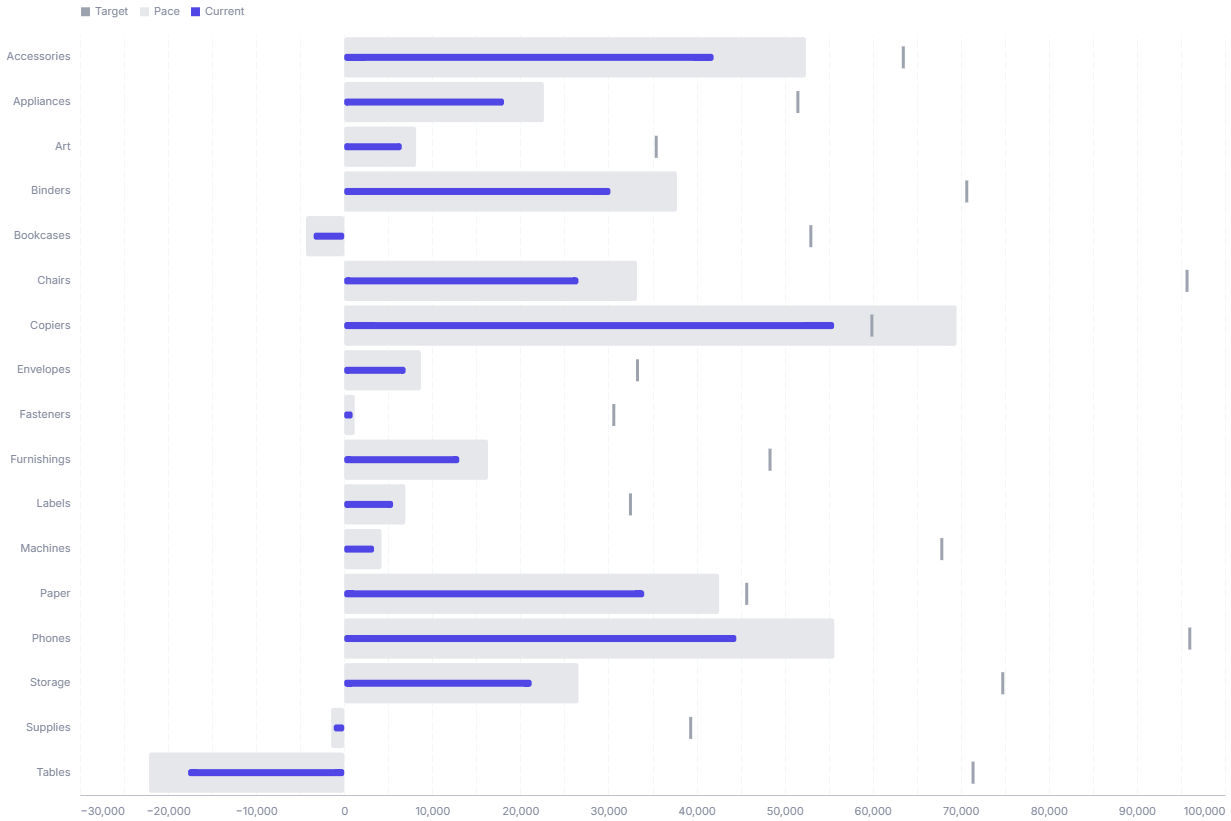
A bullet chart shows a measure against a target and qualitative ranges, packing KPI-versus-goal context into a compact bar.
- Good for: tracking KPIs against a goal, comparing actual versus target versus pace across categories, compact scorecards on a dashboard.
- Not great for: showing a trend over time (use a line chart), comparing many measures at once, or a single metric with no target (use a gauge chart).
Syntax
Use the following AML definition to add the Bullet Chart to your custom chart library.
CustomChartDef bullet_chart {
  label: 'Bullet Chart'
  description: 'To compare target, pace, and current values across categories in a compact bullet chart layout.'

  fields {
    field dimension {
      label: 'Dimension'
      type: 'dimension'
      sort {
        apply_order: 1
        direction: 'asc'
      }
    }

    field target {
      label: 'Target'
      type: 'measure'
      sort {
        apply_order: 2
        direction: 'desc'
      }
    }

    field pace {
      label: 'Pace'
      type: 'measure'
      sort {
        apply_order: 3
        direction: 'desc'
      }
    }

    field current {
      label: 'Current'
      type: 'measure'
      sort {
        apply_order: 4
        direction: 'desc'
      }
    }
  }

  options {
    option show_tooltip {
      label: 'Show tooltip'
      type: 'toggle'
      default_value: true
    }

    option current_bar_height {
      label: 'Current bar height'
      type: 'number-input'
      default_value: 8
    }

    option target_tick_thickness {
      label: 'Target tick thickness'
      type: 'number-input'
      default_value: 2
    }
  }

  template: @vgl {
    "$schema": "https://vega.github.io/schema/vega-lite/v5.json",
    "description": "A reusable target-vs-pace-vs-current bullet-style comparison chart.",
    "data": {"values": @{values}},
    "transform": [
      {
        "calculate": "datum['@{fields.target.name}']",
        "as": "target_value"
      },
      {
        "calculate": "datum['@{fields.pace.name}']",
        "as": "pace_value"
      },
      {
        "calculate": "datum['@{fields.current.name}']",
        "as": "current_value"
      },
      {
        "calculate": "datum['@{fields.dimension.name}']",
        "as": "category_value"
      },
      {
        "fold": ["target_value", "pace_value", "current_value"],
        "as": ["series_key", "series_value"]
      },
      {
        "calculate": "{'target_value':'Target','pace_value':'Pace','current_value':'Current'}[datum.series_key]",
        "as": "series_label"
      },
      {
        "calculate": "indexof(['Target','Pace','Current'], datum.series_label)",
        "as": "series_order"
      }
    ],
    "encoding": {
      "y": {
        "field": "category_value",
        "type": "ordinal"
      },
      "x": {
        "field": "series_value",
        "type": "quantitative",
        "stack": null
      },
      "order": {
        "field": "series_order",
        "type": "quantitative",
        "sort": "ascending"
      },
      "tooltip": [
        {
          "field": "category_value",
          "type": "nominal",
          "title": "Category"
        },
        {
          "field": "current_value",
          "type": "quantitative",
          "title": "Current"
        },
        {
          "field": "pace_value",
          "type": "quantitative",
          "title": "Pace"
        },
        {
          "field": "target_value",
          "type": "quantitative",
          "title": "Target"
        }
      ]
    },
    "layer": [
      {
        "mark": "bar",
        "params": [
          {
            "name": "series_hover",
            "select": {
              "type": "point",
              "fields": ["series_label"]
            },
            "bind": {"legend": "pointerover"}
          },
          {"name": "normalPointSelection", "select": {"type": "point", "toggle": "true", "clear": "mouseup"}},
          {"name": "hoverPointSelection", "select": {"type": "point", "on": "mouseover", "clear": "mouseout"}}
        ],
        "encoding": {
          "color": {
            "field": "series_label",
            "type": "nominal",
            "legend": {},
            "scale": {
              "domain": ["Target", "Pace", "Current"],
              "range": ["#9CA3AF", "#E5E7EB", "#4F46E5"]
            }
          },
          "opacity": {
            "value": 0
          }
        }
      },
      {
        "transform": [
          {
            "filter": "datum.series_label === 'Pace'"
          }
        ],
        "mark": {
          "type": "bar",
          "tooltip": @{options.show_tooltip.value}
        },
        "encoding": {
          "color": {
            "field": "series_label",
            "type": "nominal",
            "legend": null,
            "scale": {
              "domain": ["Target", "Pace", "Current"],
              "range": ["#9CA3AF", "#E5E7EB", "#4F46E5"]
            }
          },
          "opacity": {
            "condition": {
              "param": "series_hover",
              "value": 1
            },
            "value": 0.25
          }
        }
      },
      {
        "transform": [
          {
            "filter": "datum.series_label === 'Current'"
          }
        ],
        "mark": {
          "type": "bar",
          "height": @{options.current_bar_height.value},
          "tooltip": @{options.show_tooltip.value}
        },
        "encoding": {
          "color": {
            "field": "series_label",
            "type": "nominal",
            "legend": null,
            "scale": {
              "domain": ["Target", "Pace", "Current"],
              "range": ["#9CA3AF", "#E5E7EB", "#4F46E5"]
            }
          },
          "opacity": {
            "condition": {
              "param": "series_hover",
              "value": 1
            },
            "value": 0.25
          }
        }
      },
      {
        "transform": [
          {
            "filter": "datum.series_label === 'Target'"
          }
        ],
        "mark": {
          "type": "tick",
          "thickness": @{options.target_tick_thickness.value},
          "tooltip": @{options.show_tooltip.value}
        },
        "encoding": {
          "color": {
            "field": "series_label",
            "type": "nominal",
            "legend": null,
            "scale": {
              "domain": ["Target", "Pace", "Current"],
              "range": ["#9CA3AF", "#E5E7EB", "#4F46E5"]
            }
          },
          "opacity": {
            "condition": {
              "param": "series_hover",
              "value": 1
            },
            "value": 0.25
          }
        }
      }
    ],
    "holisticsConfig": {
      "crossFilterSignals": ["normalPointSelection"],
      "contextMenuSignals": ["hoverPointSelection"]
    },
    "config": {
      "background": null,
      "view": {"stroke": null},
      "font": "Inter",
      "axis": {
        "title": null,
        "ticks": false,
        "labelPadding": 10,
        "labelFontSize": 11,
        "labelColor": "#858B9E",
        "titleColor": "#858B9E",
        "labelOverlap": "parity",
        "gridDash": [8, 3],
        "gridColor": "#F4F6F8",
        "domainColor": "#bec1cb"
      },
      "axisX": {"grid": true},
      "axisY": {"domain": false, "grid": false},
      "legend": {
        "orient": "top",
        "direction": "horizontal",
        "symbolType": "square",
        "symbolSize": 80,
        "labelLimit": 140,
        "symbolOpacity": 1,
        "title": null,
        "labelFontSize": 11,
        "labelColor": "#858B9E",
        "symbolStrokeWidth": 0
      },
      "bar": {
        "cornerRadius": 2
      },
      "tick": {
        "thickness": 2,
        "size": 22
      }
    }
  };;
}
Required fields
A Bullet Chart expects exactly four fields. Each row is one category with its target, pace, and current values.
| Field | Label | Type | Role |
|---|---|---|---|
dimension | Dimension | dimension | Category on the y axis (one bullet per value). Sorted ascending (apply_order: 1). |
target | Target | measure | Goal value, drawn as a vertical tick. Sorted descending (apply_order: 2). |
pace | Pace | measure | Expected-to-date value, drawn as the wide background bar. Sorted descending (apply_order: 3). |
current | Current | measure | Actual value, drawn as the thin foreground bar. Sorted descending (apply_order: 4). |
Data requirements: Pre-aggregate to one row per dimension value; the template folds the three measures per row but does not combine duplicate categories.
Sample data:
| dimension | target | pace | current |
|---|---|---|---|
| North | 1000 | 750 | 820 |
| South | 1200 | 900 | 640 |
| East | 800 | 600 | 710 |
| West | 1500 | 1125 | 1180 |
Options
Set these options to adjust the chart without editing the Vega template. The CustomChartDef block above declares each option's type and allowed values.
| Option | Default | Effect |
|---|---|---|
show_tooltip | true | Toggles the hover tooltip showing category, current, pace, and target. |
current_bar_height | 8 | Height in pixels of the thin Current bar. |
target_tick_thickness | 2 | Thickness in pixels of the Target tick mark. |
Known limitations
-
All three measures must be on the same scale. Target, pace, and current share one x axis, so they need comparable units for the bullet to read correctly.
-
One value per category. The template does not aggregate, so duplicate
dimensionrows draw overlapping marks. Pre-aggregate to a single row per category. -
Fixed three-series layout. The chart always draws target, pace, and current. It cannot show additional series or qualitative range bands without editing the template.