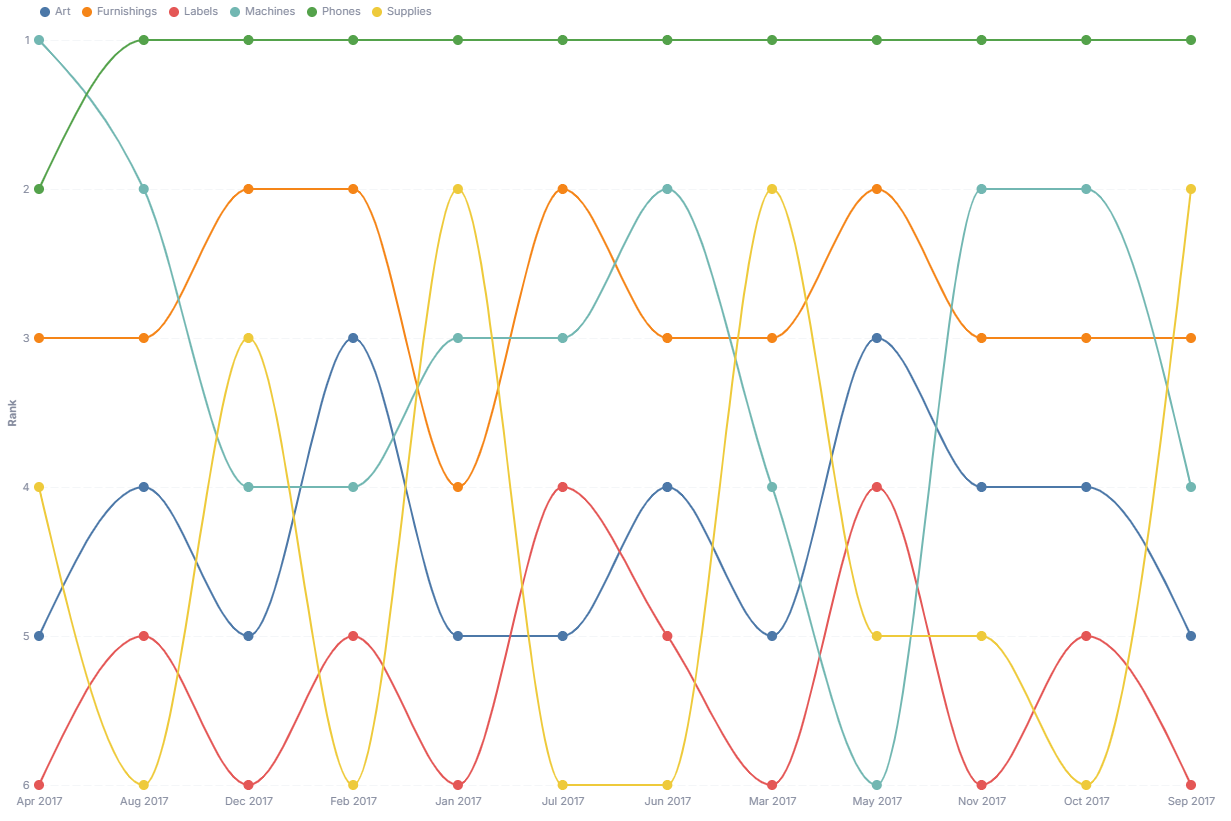
Bump Chart
A bump chart tracks how categories rank against each other over time, highlighting overtakes and trend reversals.
- Good for: rank-over-time stories like top sellers by month, leaderboard movement, or competitive standings where overtakes matter more than raw values.
- Not great for: comparing exact values (use a line chart), a single before-and-after comparison (use the Slope Chart), or more than ~10 categories where lines crowd together.
Syntax
Use the following AML definition to add the Bump Chart to your custom chart library.
CustomChartDef bump_chart {
  label: 'Bump Chart'
  description: 'To track how categories rank against each other over time, highlighting overtakes and trend reversals.'
  fields {
    field period {
      label: 'Period'
      type: 'dimension'
      sort {
        apply_order: 1
        direction: 'asc'
      }
    }
    field dimension {
      label: 'Dimension'
      type: 'dimension'
      sort {
        apply_order: 2
        direction: 'asc'
      }
    }
    field value {
      label: 'Value'
      type: 'measure'
      sort {
        apply_order: 3
        direction: 'desc'
      }
    }
  }
  options {
    option color_scheme {
      type: 'select'
      label: 'Color scheme'
      options: ['tableau10', 'category10', 'accent', 'dark2', 'paired', 'pastel1', 'pastel2', 'set1', 'set2', 'set3']
      default_value: 'tableau10'
    }

    option line_interpolate {
      type: 'select'
      label: 'Line style'
      options: ['linear', 'monotone']
      default_value: 'monotone'
    }

    option point_size {
      type: 'select'
      label: 'Point size'
      options: [60, 100, 140, 180]
      default_value: 100
    }
  }
  template: @vg {
    "$schema": "https://vega.github.io/schema/vega/v5.json",
    "signals": [
      {
        "name": "width",
        "init": "containerSize()[0] - 10",
        "on": [{ "events": "window:resize", "update": "containerSize()[0] - 10" }]
      },
      {
        "name": "height",
        "init": "containerSize()[1] - 10",
        "on": [{ "events": "window:resize", "update": "containerSize()[1] - 10" }]
      },
      {
        "name": "hovered",
        "value": null,
        "on": [
          {"events": "symbol:mouseover", "update": "datum.category"},
          {"events": "symbol:mouseout", "update": "null"},
          {"events": "@legendSymbol:mouseover, @legendLabel:mouseover", "update": "datum.value"},
          {"events": "@legendSymbol:mouseout, @legendLabel:mouseout", "update": "null"}
        ]
      },
      {
        "name": "normalPointSelection",
        "value": null,
        "on": [
          {"events": "symbol:click, line:click", "update": "{'@{fields.dimension.name}': [datum.category]}"},
          {"events": "@legendSymbol:click, @legendLabel:click", "update": "{'@{fields.dimension.name}': [datum.value]}"},
          {"events": "click[!event.item]", "update": "null"}
        ]
      },
      {
        "name": "hoverPointSelection",
        "value": null,
        "on": [
          {"events": "symbol:mouseover, line:mouseover", "update": "{'@{fields.dimension.name}': [datum.category]}"},
          {"events": "symbol:mouseout, line:mouseout", "update": "null"}
        ]
      }
    ],
    "holisticsConfig": {
      "crossFilterSignals": ["normalPointSelection"],
      "contextMenuSignals": ["hoverPointSelection"]
    },
    "data": [
      {
        "name": "table",
        "values": @{values},
        "transform": [
          {"type": "formula", "expr": "datum['@{fields.period.name}']", "as": "period"},
          {"type": "formula", "expr": "datum['@{fields.dimension.name}']", "as": "category"},
          {"type": "formula", "expr": "datum['@{fields.value.name}']", "as": "amount"},
          {
            "type": "window",
            "sort": {"field": "amount", "order": "descending"},
            "ops": ["rank"],
            "as": ["rank"],
            "groupby": ["period"]
          },
          {
            "type": "collect",
            "sort": {"field": "period"}
          }
        ]
      }
    ],
    "scales": [
      {
        "name": "x",
        "type": "point",
        "domain": {"data": "table", "field": "period", "sort": true},
        "range": "width"
      },
      {
        "name": "y",
        "type": "point",
        "domain": {"data": "table", "field": "rank", "sort": true},
        "range": "height"
      },
      {
        "name": "color",
        "type": "ordinal",
        "domain": {"data": "table", "field": "category"},
        "range": {"scheme": @{options.color_scheme.value}}
      }
    ],
    "axes": [
      {"orient": "bottom", "scale": "x"},
      {"orient": "left", "scale": "y", "title": "Rank"}
    ],
    "legends": [
      {
        "fill": "color",
        "title": null,
        "encode": {
          "symbols": {
            "name": "legendSymbol",
            "interactive": true,
            "update": {
              "opacity": {"signal": "hovered === null || hovered === datum.value ? 1 : 0.15"}
            }
          },
          "labels": {
            "name": "legendLabel",
            "interactive": true,
            "update": {
              "opacity": {"signal": "hovered === null || hovered === datum.value ? 1 : 0.3"}
            }
          }
        }
      }
    ],
    "marks": [
      {
        "type": "group",
        "from": {"facet": {"name": "series", "data": "table", "groupby": "category"}},
        "marks": [
          {
            "type": "line",
            "name": "bumpLine",
            "from": {"data": "series"},
            "encode": {
              "update": {
                "x": {"scale": "x", "field": "period"},
                "y": {"scale": "y", "field": "rank"},
                "stroke": {"scale": "color", "field": "category"},
                "interpolate": {"value": @{options.line_interpolate.value}},
                "strokeWidth": {"signal": "hovered === datum.category ? 4 : 2"},
                "opacity": {"signal": "hovered === null || hovered === datum.category ? 1 : 0.15"}
              }
            }
          },
          {
            "type": "symbol",
            "name": "bumpPoint",
            "from": {"data": "series"},
            "encode": {
              "update": {
                "x": {"scale": "x", "field": "period"},
                "y": {"scale": "y", "field": "rank"},
                "fill": {"scale": "color", "field": "category"},
                "size": {"value": @{options.point_size.value}},
                "opacity": {"signal": "hovered === null || hovered === datum.category ? 1 : 0.15"},
                "tooltip": {
                  "signal": "datum.category + ' - ' + datum.period + ': rank ' + datum.rank + ' (' + format(datum.amount, ',') + ')'"
                }
              }
            }
          }
        ]
      }
    ],
    "config": {
      "background": null,
      "axis": {
        "domain": false,
        "ticks": false,
        "labelPadding": 10,
        "labelColor": "#858B9E",
        "labelFont": "Inter",
        "labelFontSize": 11,
        "titleColor": "#858B9E",
        "titleFont": "Inter",
        "titleFontSize": 11
      },
      "axisX": {"labelAngle": 0},
      "axisY": {"grid": true, "gridDash": [8, 3], "gridColor": "#F4F6F8"},
      "legend": {
        "orient": "top",
        "direction": "horizontal",
        "symbolType": "circle",
        "labelColor": "#858B9E",
        "labelFont": "Inter",
        "labelFontSize": 11
      }
    }
  }
  ;;
}
Required fields
A Bump Chart expects exactly three fields. Each row of input is one category's value in one period, and the template ranks categories within each period.
| Field | Label | Type | Role |
|---|---|---|---|
period | Period | dimension | Position on the x-axis; one column of points per period. Sorted ascending (apply_order: 1). |
dimension | Dimension | dimension | The category whose rank the chart tracks, with one line per category. Sorted ascending (apply_order: 2). |
value | Value | measure | The amount used to rank categories within each period (highest value ranks first). Sorted descending (apply_order: 3). |
Data requirements: Pre-aggregate to one row per period and category, since the template ranks rows directly and does not sum duplicates. Provide a value for every category in every period so each line is continuous, and use at least two periods so ranks have something to move between.
Sample data:
| period | dimension | value |
|---|---|---|
| 2024-01 | Product A | 4200 |
| 2024-01 | Product B | 3800 |
| 2024-01 | Product C | 2100 |
| 2024-02 | Product A | 3100 |
| 2024-02 | Product B | 3900 |
| 2024-02 | Product C | 3500 |
| 2024-03 | Product A | 2600 |
| 2024-03 | Product B | 3000 |
| 2024-03 | Product C | 4100 |
Options
Set these options to adjust the chart without editing the Vega template. The CustomChartDef block above declares each option's type and allowed values.
| Option | Default | Effect |
|---|---|---|
color_scheme | tableau10 | Ordinal color palette applied to the category lines and legend. |
line_interpolate | monotone | Line shape between points. monotone draws smooth curves; linear draws straight segments. |
point_size | 100 | Size of the point markers at each period. |
Known limitations
-
Needs one value per category per period. A category missing in a period breaks its line and shifts ranks for that column, so fill gaps before charting.
-
Shows rank, not magnitude. The y-axis is rank order, so equal gaps between ranks can hide large value differences. Use a line chart when the actual values matter.
-
Readability drops past ~10 categories. Beyond roughly 10 lines the ranks crowd and crossings get hard to follow. Group smaller categories together first.