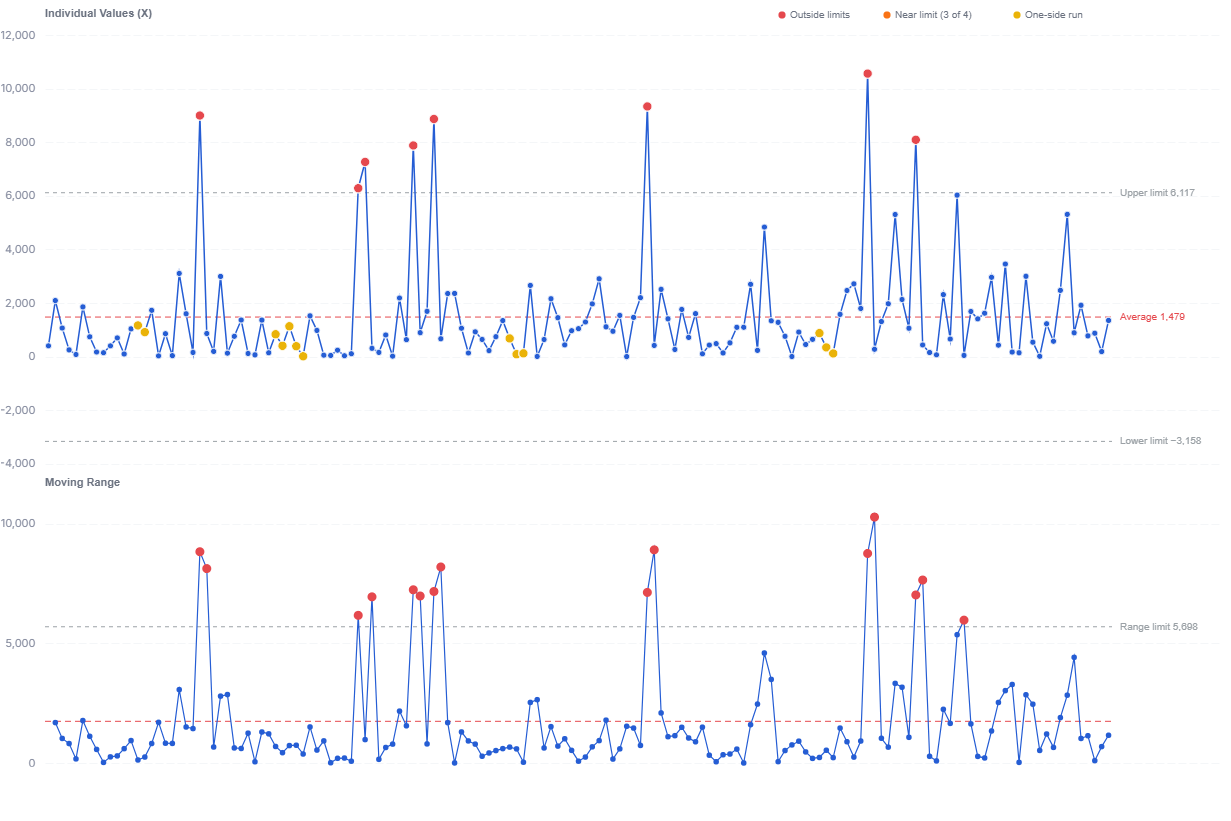
Control Chart (XmR)
A control chart (XmR, also called a process behaviour chart) tracks a metric over time and separates real change from routine noise. It draws the metric with its natural process limits, plus a companion Moving Range panel showing point-to-point volatility.
- Good for: monitoring a metric over time for real change (weekly signups, defect counts, delivery times, support volume), spotting outliers and trends with statistical limits.
- Not great for: comparing categories side by side, part-to-whole composition, or data without a natural time or sequence order (use a bar or line chart instead).
Syntax
Use the following AML definition to add the Control Chart to your custom chart library.
CustomChartDef control_chart {
label: 'Control Chart (XmR)'
description: 'To separate routine variation from real change, with XmR process limits and color-coded signal detection rules.'
fields {
field period {
label: 'Period'
type: 'dimension'
sort {
apply_order: 1
direction: 'asc'
}
}
field value {
label: 'Value'
type: 'measure'
sort {
apply_order: 2
direction: 'asc'
}
}
}
options {
option line_color {
label: 'Line Color'
type: 'color-picker'
default_value: '#255dd4'
}
option show_mr_chart {
label: 'Show Moving Range chart'
type: 'toggle'
default_value: true
}
option show_tooltip {
label: 'Show tooltip'
type: 'toggle'
default_value: true
}
}
template: @vg {
"$schema": "https://vega.github.io/schema/vega/v5.json",
"signals": [
{
"name": "width",
"init": "containerSize()[0] - 52",
"on": [{ "events": "window:resize", "update": "containerSize()[0] - 52" }]
},
{
"name": "height",
"init": "containerSize()[1] - 64",
"on": [{ "events": "window:resize", "update": "containerSize()[1] - 64" }]
},
{"name": "showMr", "update": "@{options.show_mr_chart.value}"},
{"name": "plotW", "update": "width - 110"},
{"name": "xH", "update": "showMr ? (height - 48) * 0.62 : height - 18"},
{"name": "mrTop", "update": "18 + xH + 30"},
{"name": "mrH", "update": "showMr ? height - mrTop : 1"},
{
"name": "hoveredPeriod",
"value": null,
"on": [
{"events": "symbol:mouseover", "update": "datum.period"},
{"events": "symbol:mouseout", "update": "null"}
]
},
{
"name": "normalPointSelection",
"value": null,
"on": [
{"events": "@xPoint:click, @mrPoint:click", "update": "{'@{fields.period.name}': [datum['period']]}"},
{"events": "click[!event.item]", "update": "null"}
]
},
{
"name": "hoverPointSelection",
"value": null,
"on": [
{"events": "@xPoint:mouseover, @mrPoint:mouseover", "update": "{'@{fields.period.name}': [datum['period']]}"},
{"events": "@xPoint:mouseout, @mrPoint:mouseout", "update": "null"}
]
}
],
"holisticsConfig": {
"crossFilterSignals": ["normalPointSelection"],
"contextMenuSignals": ["hoverPointSelection"]
},
"data": [
{
"name": "source",
"values": @{values},
"transform": [
{"type": "formula", "expr": "datum['@{fields.period.name}']", "as": "period"},
{"type": "formula", "expr": "datum['@{fields.value.name}']", "as": "amount"},
{"type": "filter", "expr": "datum.amount != null"},
{"type": "collect", "sort": {"field": "period"}},
{"type": "window", "ops": ["lag"], "fields": ["amount"], "as": ["prev_amount"]},
{
"type": "formula",
"expr": "datum.prev_amount == null ? null : abs(datum.amount - datum.prev_amount)",
"as": "mr"
},
{"type": "joinaggregate", "fields": ["amount", "mr"], "ops": ["mean", "mean"], "as": ["xbar", "mrbar"]},
{"type": "formula", "expr": "datum.xbar + 2.66 * datum.mrbar", "as": "unpl"},
{"type": "formula", "expr": "datum.xbar - 2.66 * datum.mrbar", "as": "lnpl"},
{"type": "formula", "expr": "datum.xbar + 1.33 * datum.mrbar", "as": "uql"},
{"type": "formula", "expr": "datum.xbar - 1.33 * datum.mrbar", "as": "lql"},
{"type": "formula", "expr": "3.268 * datum.mrbar", "as": "mr_url"},
{"type": "formula", "expr": "datum.amount > datum.xbar ? 1 : 0", "as": "above"},
{"type": "formula", "expr": "datum.amount < datum.xbar ? 1 : 0", "as": "below"},
{"type": "formula", "expr": "datum.amount > datum.uql ? 1 : 0", "as": "qabove"},
{"type": "formula", "expr": "datum.amount < datum.lql ? 1 : 0", "as": "qbelow"},
{
"type": "window",
"ops": ["sum", "sum"],
"fields": ["qabove", "qbelow"],
"as": ["qabove4", "qbelow4"],
"frame": [-3, 0]
},
{
"type": "window",
"ops": ["sum", "sum"],
"fields": ["above", "below"],
"as": ["above8", "below8"],
"frame": [-7, 0]
},
{
"type": "formula",
"expr": "datum.amount > datum.unpl || datum.amount < datum.lnpl",
"as": "rule1"
},
{
"type": "formula",
"expr": "(datum.qabove === 1 && datum.qabove4 >= 3) || (datum.qbelow === 1 && datum.qbelow4 >= 3)",
"as": "rule2"
},
{
"type": "formula",
"expr": "(datum.above === 1 && datum.above8 >= 8) || (datum.below === 1 && datum.below8 >= 8)",
"as": "rule3"
},
{
"type": "formula",
"expr": "datum.rule1 ? 'strong' : (datum.rule2 ? 'moderate' : (datum.rule3 ? 'weak' : 'none'))",
"as": "severity"
},
{
"type": "formula",
"expr": "datum.rule1 ? 'Outside process limits' : (datum.rule2 ? '3 of 4 points near a limit' : (datum.rule3 ? 'Long run on one side of center' : 'Routine variation'))",
"as": "signal_desc"
}
]
},
{
"name": "stats",
"source": "source",
"transform": [
{"type": "aggregate", "fields": ["amount", "mr"], "ops": ["mean", "mean"], "as": ["xbar", "mrbar"]},
{"type": "formula", "expr": "datum.xbar + 2.66 * datum.mrbar", "as": "unpl"},
{"type": "formula", "expr": "datum.xbar - 2.66 * datum.mrbar", "as": "lnpl"},
{"type": "formula", "expr": "3.268 * datum.mrbar", "as": "mr_url"}
]
}
],
"scales": [
{
"name": "x",
"type": "point",
"domain": {"data": "source", "field": "period", "sort": true},
"range": [0, {"signal": "plotW"}],
"padding": 0.5
},
{
"name": "severityColor",
"type": "ordinal",
"domain": ["none", "weak", "moderate", "strong"],
"range": [@{options.line_color.value}, "#eab308", "#f97316", "#e5484d"]
}
],
"axes": [
{"orient": "bottom", "scale": "x"}
],
"marks": [
{
"type": "text",
"interactive": false,
"encode": {
"update": {
"x": {"value": 0},
"y": {"value": 10},
"text": {"value": "Individual Values (X)"},
"fontSize": {"value": 11},
"fontWeight": {"value": 600},
"fill": {"value": "#6b7280"}
}
}
},
{
"type": "symbol",
"interactive": false,
"encode": {
"update": {
"x": {"signal": "plotW - 330"},
"y": {"value": 8},
"fill": {"value": "#e5484d"},
"size": {"value": 50}
}
}
},
{
"type": "text",
"interactive": false,
"encode": {
"update": {
"x": {"signal": "plotW - 322"},
"y": {"value": 8},
"baseline": {"value": "middle"},
"text": {"value": "Outside limits"},
"fontSize": {"value": 10},
"fill": {"value": "#6b7280"}
}
}
},
{
"type": "symbol",
"interactive": false,
"encode": {
"update": {
"x": {"signal": "plotW - 225"},
"y": {"value": 8},
"fill": {"value": "#f97316"},
"size": {"value": 50}
}
}
},
{
"type": "text",
"interactive": false,
"encode": {
"update": {
"x": {"signal": "plotW - 217"},
"y": {"value": 8},
"baseline": {"value": "middle"},
"text": {"value": "Near limit (3 of 4)"},
"fontSize": {"value": 10},
"fill": {"value": "#6b7280"}
}
}
},
{
"type": "symbol",
"interactive": false,
"encode": {
"update": {
"x": {"signal": "plotW - 95"},
"y": {"value": 8},
"fill": {"value": "#eab308"},
"size": {"value": 50}
}
}
},
{
"type": "text",
"interactive": false,
"encode": {
"update": {
"x": {"signal": "plotW - 87"},
"y": {"value": 8},
"baseline": {"value": "middle"},
"text": {"value": "One-side run"},
"fontSize": {"value": 10},
"fill": {"value": "#6b7280"}
}
}
},
{
"type": "group",
"name": "xChart",
"encode": {
"update": {"x": {"value": 0}, "y": {"value": 18}, "width": {"signal": "plotW"}, "height": {"signal": "xH"}}
},
"scales": [
{
"name": "yx",
"type": "linear",
"nice": true,
"zero": false,
"domain": {"data": "source", "fields": ["amount", "unpl", "lnpl"]},
"range": [{"signal": "xH"}, 10]
}
],
"axes": [
{"orient": "left", "scale": "yx"}
],
"marks": [
{
"type": "rule",
"from": {"data": "stats"},
"encode": {
"update": {
"x": {"value": 0},
"x2": {"signal": "plotW"},
"y": {"scale": "yx", "field": "unpl"},
"stroke": {"value": "#9ba1a6"},
"strokeDash": {"value": [4, 4]}
}
}
},
{
"type": "rule",
"from": {"data": "stats"},
"encode": {
"update": {
"x": {"value": 0},
"x2": {"signal": "plotW"},
"y": {"scale": "yx", "field": "lnpl"},
"stroke": {"value": "#9ba1a6"},
"strokeDash": {"value": [4, 4]}
}
}
},
{
"type": "rule",
"from": {"data": "stats"},
"encode": {
"update": {
"x": {"value": 0},
"x2": {"signal": "plotW"},
"y": {"scale": "yx", "field": "xbar"},
"stroke": {"value": "#e5484d"},
"strokeDash": {"value": [6, 4]}
}
}
},
{
"type": "text",
"interactive": false,
"from": {"data": "stats"},
"encode": {
"update": {
"x": {"signal": "plotW + 8"},
"y": {"scale": "yx", "field": "unpl"},
"baseline": {"value": "middle"},
"text": {"signal": "'Upper limit ' + format(datum.unpl, ',.4')"},
"fontSize": {"value": 10},
"fill": {"value": "#9ba1a6"}
}
}
},
{
"type": "text",
"interactive": false,
"from": {"data": "stats"},
"encode": {
"update": {
"x": {"signal": "plotW + 8"},
"y": {"scale": "yx", "field": "lnpl"},
"baseline": {"value": "middle"},
"text": {"signal": "'Lower limit ' + format(datum.lnpl, ',.4')"},
"fontSize": {"value": 10},
"fill": {"value": "#9ba1a6"}
}
}
},
{
"type": "text",
"interactive": false,
"from": {"data": "stats"},
"encode": {
"update": {
"x": {"signal": "plotW + 8"},
"y": {"scale": "yx", "field": "xbar"},
"baseline": {"value": "middle"},
"text": {"signal": "'Average ' + format(datum.xbar, ',.4')"},
"fontSize": {"value": 10},
"fill": {"value": "#e5484d"}
}
}
},
{
"type": "rule",
"interactive": false,
"encode": {
"update": {
"x": {"scale": "x", "signal": "hoveredPeriod"},
"y": {"value": 4},
"y2": {"signal": "xH"},
"stroke": {"value": "#9ba1a6"},
"strokeDash": {"value": [3, 3]},
"opacity": {"signal": "hoveredPeriod === null ? 0 : 0.7"}
}
}
},
{
"type": "line",
"from": {"data": "source"},
"encode": {
"update": {
"x": {"scale": "x", "field": "period"},
"y": {"scale": "yx", "field": "amount"},
"stroke": {"value": @{options.line_color.value}},
"strokeWidth": {"value": 1.5}
}
}
},
{
"type": "symbol",
"name": "xPoint",
"from": {"data": "source"},
"encode": {
"update": {
"x": {"scale": "x", "field": "period"},
"y": {"scale": "yx", "field": "amount"},
"fill": {"scale": "severityColor", "field": "severity"},
"size": {"signal": "datum.period === hoveredPeriod ? 130 : (datum.severity === 'none' ? 40 : 90)"},
"stroke": {"value": "white"},
"strokeWidth": {"value": 1},
"tooltip": {
"signal": "@{options.show_tooltip.value} ? {'Period': datum.period, 'Value': format(datum.amount, ','), 'Signal': datum.signal_desc, 'Avg': format(datum.xbar, ',.4'), 'Limits': format(datum.lnpl, ',.4') + ' to ' + format(datum.unpl, ',.4')} : null"
}
}
}
}
]
},
{
"type": "text",
"interactive": false,
"encode": {
"update": {
"x": {"value": 0},
"y": {"signal": "mrTop - 8"},
"text": {"value": "Moving Range"},
"fontSize": {"value": 11},
"fontWeight": {"value": 600},
"fill": {"value": "#6b7280"},
"opacity": {"signal": "showMr ? 1 : 0"}
}
}
},
{
"type": "group",
"name": "mrChart",
"encode": {
"update": {
"x": {"value": 0},
"y": {"signal": "mrTop"},
"width": {"signal": "plotW"},
"height": {"signal": "mrH"},
"opacity": {"signal": "showMr ? 1 : 0"}
}
},
"scales": [
{
"name": "ymr",
"type": "linear",
"nice": true,
"zero": true,
"domain": {"data": "source", "fields": ["mr", "mr_url"]},
"range": [{"signal": "mrH"}, 6]
}
],
"axes": [
{"orient": "left", "scale": "ymr", "tickCount": 3}
],
"marks": [
{
"type": "rule",
"from": {"data": "stats"},
"encode": {
"update": {
"x": {"value": 0},
"x2": {"signal": "plotW"},
"y": {"scale": "ymr", "field": "mr_url"},
"stroke": {"value": "#9ba1a6"},
"strokeDash": {"value": [4, 4]},
"opacity": {"signal": "showMr ? 1 : 0"}
}
}
},
{
"type": "rule",
"from": {"data": "stats"},
"encode": {
"update": {
"x": {"value": 0},
"x2": {"signal": "plotW"},
"y": {"scale": "ymr", "field": "mrbar"},
"stroke": {"value": "#e5484d"},
"strokeDash": {"value": [6, 4]},
"opacity": {"signal": "showMr ? 1 : 0"}
}
}
},
{
"type": "text",
"interactive": false,
"from": {"data": "stats"},
"encode": {
"update": {
"x": {"signal": "plotW + 8"},
"y": {"scale": "ymr", "field": "mr_url"},
"baseline": {"value": "middle"},
"text": {"signal": "'Range limit ' + format(datum.mr_url, ',.4')"},
"fontSize": {"value": 10},
"fill": {"value": "#9ba1a6"},
"opacity": {"signal": "showMr ? 1 : 0"}
}
}
},
{
"type": "rule",
"interactive": false,
"encode": {
"update": {
"x": {"scale": "x", "signal": "hoveredPeriod"},
"y": {"value": 0},
"y2": {"signal": "mrH"},
"stroke": {"value": "#9ba1a6"},
"strokeDash": {"value": [3, 3]},
"opacity": {"signal": "showMr && hoveredPeriod !== null ? 0.7 : 0"}
}
}
},
{
"type": "line",
"from": {"data": "source"},
"encode": {
"update": {
"x": {"scale": "x", "field": "period"},
"y": {"scale": "ymr", "field": "mr"},
"stroke": {"value": @{options.line_color.value}},
"strokeWidth": {"value": 1.2},
"defined": {"signal": "datum.mr != null"},
"opacity": {"signal": "showMr ? 1 : 0"}
}
}
},
{
"type": "symbol",
"name": "mrPoint",
"from": {"data": "source"},
"encode": {
"update": {
"x": {"scale": "x", "field": "period"},
"y": {"scale": "ymr", "field": "mr"},
"fill": {"signal": "datum.mr != null && datum.mr > datum.mr_url ? '#e5484d' : '@{options.line_color.value}'"},
"size": {"signal": "datum.period === hoveredPeriod ? 120 : (datum.mr != null && datum.mr > datum.mr_url ? 80 : 30)"},
"opacity": {"signal": "showMr && datum.mr != null ? 1 : 0"},
"tooltip": {
"signal": "@{options.show_tooltip.value} && datum.mr != null ? {'Period': datum.period, 'Moving Range': format(datum.mr, ',.4'), 'Avg MR': format(datum.mrbar, ',.4'), 'Upper Range Limit': format(datum.mr_url, ',.4')} : null"
}
}
}
}
]
}
],
"config": {
"background": null,
"axis": {
"domain": false,
"ticks": false,
"labelPadding": 10,
"labelColor": "#858B9E",
"labelFont": "Inter",
"labelFontSize": 11,
"titleColor": "#858B9E",
"titleFont": "Inter",
"titleFontSize": 11
},
"axisX": {"labelOverlap": true},
"axisY": {"grid": true, "gridDash": [8, 3], "gridColor": "#F4F6F8"}
}
};;
}
Required fields
A Control Chart expects exactly two fields. Each row is one observation in the time series.
| Field | Label | Type | Role |
|---|---|---|---|
period | Period | dimension | Time or sequence axis; one point per period. Sorted ascending (apply_order: 1). |
value | Value | measure | Metric plotted as individual values, with limits derived from its moving range. Sorted ascending (apply_order: 2). |
Data requirements: Pre-aggregate to one row per period, since the template does not combine duplicate periods; it sorts by period and reads each point in order, so the periods must form a clean ordered sequence. The template drops null values before computing the limits. Limits stabilize with more points (the long-run rule needs at least eight consecutive points), so very short series produce weak signals.
Sample data:
| period | value |
|---|---|
| 2024-01 | 142 |
| 2024-02 | 138 |
| 2024-03 | 151 |
| 2024-04 | 147 |
| 2024-05 | 139 |
| 2024-06 | 205 |
| 2024-07 | 144 |
| 2024-08 | 149 |
Options
Set these options to adjust the chart without editing the Vega template. The CustomChartDef block above declares each option's type and allowed values.
| Option | Default | Effect |
|---|---|---|
line_color | #255dd4 | Color of the value line and routine (unflagged) points. Flagged points keep their severity colors. |
show_mr_chart | true | Shows or hides the companion Moving Range panel below the main chart. |
show_tooltip | true | Turns the hover tooltip on both panels on or off. |
Known limitations
-
Needs an ordered time series. The template sorts by
periodand reads points in sequence, so the data must have one row per period in a meaningful order. Flat or unordered category data does not produce valid limits. -
Signals are weak on short series. Limits come from the average moving range, and the long-run rule needs at least eight consecutive points, so very short series detect little.
-
One metric at a time. The chart plots a single value field against a single period field; it cannot overlay or compare multiple series.