Faceted Sparkline
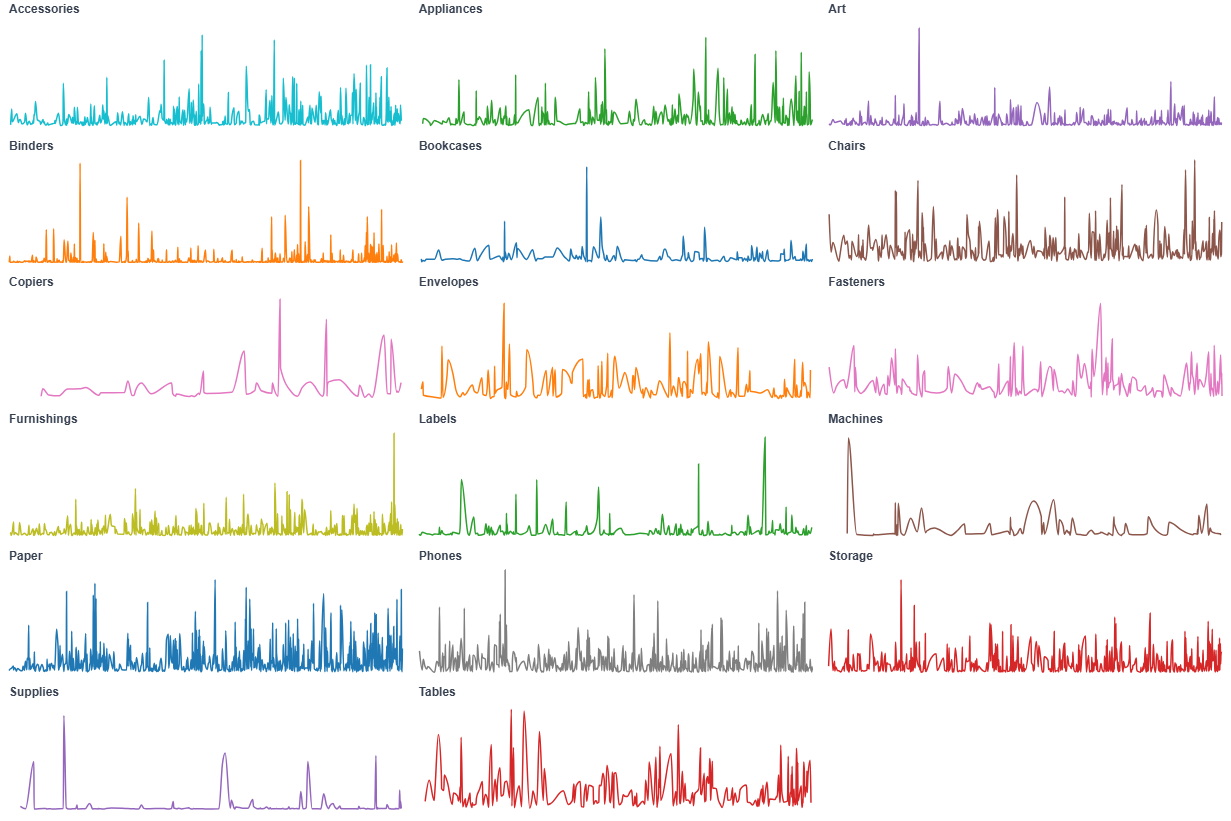
A faceted sparkline shows the same metric's trend for many categories side by side, one compact panel per category. Because each panel scales independently, you compare the shape of each trend rather than absolute values.
- Good for: comparing the shape of a trend across many categories (revenue per region, sign-ups per channel, a KPI across teams), spotting which segments are growing or declining, replacing a multi-line chart that has turned into spaghetti.
- Not great for: comparing absolute values across panels (each panel scales independently), a single category (a plain line chart is simpler), or part-to-whole composition (use a sunburst or treemap chart).
Syntax
Use the following AML definition to add the Faceted Sparkline to your custom chart library.
CustomChartDef faceted_sparkline {
  label: 'Faceted Sparkline'
  description: 'To show a compact line trend split into small multiples by category, with optional series coloring and tooltip control.'

  fields {
    field date {
      label: 'Date'
      type: 'dimension'
      data_type: 'date'
      sort {
        apply_order: 1
        direction: 'asc'
      }
    }

    field value {
      label: 'Value'
      type: 'measure'
      sort {
        apply_order: 2
        direction: 'asc'
      }
    }

    field facet {
      label: 'Facet'
      type: 'dimension'
      sort {
        apply_order: 3
        direction: 'asc'
      }
    }

    field series {
      label: 'Series'
      type: 'dimension'
      sort {
        apply_order: 4
        direction: 'asc'
      }
    }
  }

  options {
    option show_tooltip {
      label: 'Show tooltip'
      type: 'toggle'
      default_value: true
    }

    option facet_columns {
      label: 'Facet columns'
      type: 'number-input'
      default_value: 4
    }

    option color_scheme {
      label: 'Color scheme'
      type: 'select'
      options: ['tableau10', 'category10', 'accent', 'dark2', 'paired', 'set2']
      default_value: 'tableau10'
    }
  }

  template: @vg {
    "$schema": "https://vega.github.io/schema/vega/v5.json",
    "signals": [
      {
        "name": "width",
        "init": "containerSize()[0]",
        "on": [{ "events": "window:resize", "update": "containerSize()[0]" }]
      },
      {
        "name": "height",
        "init": "containerSize()[1]",
        "on": [{ "events": "window:resize", "update": "containerSize()[1]" }]
      },
      {"name": "columns", "update": "max(1, @{options.facet_columns.value})"},
      {"name": "rows", "update": "max(1, ceil(length(data('facets')) / columns))"},
      {"name": "cellW", "update": "width / columns"},
      {"name": "cellH", "update": "height / rows"},
      {"name": "headerH", "value": 22},
      {"name": "plotW", "update": "max(10, cellW - 16)"},
      {"name": "plotH", "update": "max(10, cellH - headerH - 12)"},
      {
        "name": "cursorX",
        "value": null,
        "on": [
          {"events": "@hoverRect:mousemove, @sparkline:mousemove", "update": "clamp(x(group()), 0, plotW)"},
          {"events": "@hoverRect:mouseout", "update": "null"}
        ]
      },
      {"name": "hoverDate", "update": "cursorX === null ? null : invert('x', cursorX)"},
      {
        "name": "hoveredSeries",
        "value": null,
        "on": [
          {"events": "@sparkline:mouseover", "update": "datum.series_value"},
          {"events": "@sparkline:mouseout", "update": "null"}
        ]
      },
      {
        "name": "normalPointSelection",
        "value": null,
        "on": [
          {"events": "@sparkline:click", "update": "{'@{fields.series.name}': [datum['series_value']]}"},
          {"events": "click[!event.item]", "update": "null"}
        ]
      },
      {
        "name": "hoverPointSelection",
        "value": null,
        "on": [
          {"events": "@sparkline:mouseover", "update": "{'@{fields.series.name}': [datum['series_value']]}"},
          {"events": "@sparkline:mouseout", "update": "null"}
        ]
      }
    ],
    "holisticsConfig": {
      "crossFilterSignals": ["normalPointSelection"],
      "contextMenuSignals": ["hoverPointSelection"]
    },
    "data": [
      {
        "name": "source",
        "values": @{values},
        "transform": [
          {"type": "formula", "expr": "toDate(datum['@{fields.date.name}'])", "as": "date_value"},
          {"type": "formula", "expr": "datum['@{fields.value.name}']", "as": "amount"},
          {"type": "formula", "expr": "datum['@{fields.facet.name}']", "as": "facet_value"},
          {"type": "formula", "expr": "datum['@{fields.series.name}']", "as": "series_value"},
          {"type": "filter", "expr": "datum.amount != null"},
          {"type": "collect", "sort": {"field": "date_value"}}
        ]
      },
      {
        "name": "facets",
        "source": "source",
        "transform": [
          {"type": "aggregate", "groupby": ["facet_value"]},
          {"type": "collect", "sort": {"field": "facet_value"}},
          {"type": "window", "ops": ["row_number"], "as": ["index"]},
          {"type": "formula", "expr": "(datum.index - 1) % columns", "as": "col"},
          {"type": "formula", "expr": "floor((datum.index - 1) / columns)", "as": "row"}
        ]
      },
      {
        "name": "plot",
        "source": "source",
        "transform": [
          {
            "type": "lookup",
            "from": "facets",
            "key": "facet_value",
            "fields": ["facet_value"],
            "values": ["col", "row"],
            "as": ["col", "row"]
          }
        ]
      },
      {
        "name": "hover_points",
        "source": "plot",
        "transform": [
          {"type": "filter", "expr": "hoverDate != null"},
          {"type": "formula", "expr": "abs(datum.date_value - time(hoverDate))", "as": "dist"},
          {
            "type": "joinaggregate",
            "ops": ["min"],
            "fields": ["dist"],
            "as": ["min_dist"],
            "groupby": ["facet_value", "series_value"]
          },
          {"type": "filter", "expr": "datum.dist === datum.min_dist"},
          {"type": "collect", "sort": {"field": "series_value"}},
          {"type": "window", "ops": ["row_number"], "as": ["sidx"], "groupby": ["facet_value"]}
        ]
      }
    ],
    "scales": [
      {
        "name": "x",
        "type": "time",
        "domain": {"data": "plot", "field": "date_value"},
        "range": [0, {"signal": "plotW"}]
      },
      {
        "name": "color",
        "type": "ordinal",
        "domain": {"data": "plot", "field": "series_value"},
        "range": {"scheme": @{options.color_scheme.value}}
      }
    ],
    "marks": [
      {
        "type": "group",
        "from": {
          "facet": {"name": "cell", "data": "plot", "groupby": ["facet_value", "col", "row"]}
        },
        "encode": {
          "update": {
            "x": {"signal": "datum.col * cellW + 8"},
            "y": {"signal": "datum.row * cellH"},
            "width": {"signal": "plotW"},
            "height": {"signal": "cellH"}
          }
        },
        "scales": [
          {
            "name": "yscale",
            "type": "linear",
            "nice": true,
            "domain": {"data": "cell", "field": "amount"},
            "range": [{"signal": "headerH + plotH"}, {"signal": "headerH"}]
          }
        ],
        "marks": [
          {
            "type": "rect",
            "name": "hoverRect",
            "encode": {
              "update": {
                "x": {"value": 0},
                "y": {"value": 0},
                "width": {"signal": "plotW"},
                "height": {"signal": "cellH"},
                "fill": {"value": "transparent"}
              }
            }
          },
          {
            "type": "text",
            "interactive": false,
            "encode": {
              "update": {
                "x": {"value": 0},
                "y": {"value": 12},
                "text": {"signal": "parent.facet_value"},
                "limit": {"signal": "plotW * 0.4"},
                "fontSize": {"value": 12},
                "fontWeight": {"value": 600},
                "fill": {"value": "#374151"}
              }
            }
          },
          {
            "type": "rule",
            "interactive": false,
            "encode": {
              "update": {
                "x": {"signal": "cursorX === null ? 0 : cursorX"},
                "y": {"signal": "headerH"},
                "y2": {"signal": "headerH + plotH"},
                "stroke": {"value": "#9ba1a6"},
                "strokeDash": {"value": [3, 3]},
                "opacity": {"signal": "cursorX === null ? 0 : 0.6"}
              }
            }
          },
          {
            "type": "text",
            "interactive": false,
            "encode": {
              "update": {
                "x": {"signal": "plotW"},
                "y": {"value": 12},
                "align": {"value": "right"},
                "text": {"signal": "hoverDate === null ? '' : timeFormat(hoverDate, '%b %d, %Y')"},
                "fontSize": {"value": 11},
                "fill": {"value": "#6b7280"}
              }
            }
          },
          {
            "type": "symbol",
            "interactive": false,
            "from": {"data": "hover_points"},
            "encode": {
              "update": {
                "x": {"scale": "x", "field": "date_value"},
                "y": {"scale": "yscale", "field": "amount"},
                "fill": {"scale": "color", "field": "series_value"},
                "stroke": {"value": "white"},
                "strokeWidth": {"value": 1},
                "size": {"value": 50},
                "opacity": {"signal": "datum.facet_value === parent.facet_value ? 1 : 0"}
              }
            }
          },
          {
            "type": "text",
            "interactive": false,
            "from": {"data": "hover_points"},
            "encode": {
              "update": {
                "x": {"signal": "plotW * 0.45 + (datum.sidx - 1) * 60"},
                "y": {"value": 12},
                "align": {"value": "left"},
                "text": {"signal": "format(datum.amount, ',')"},
                "fontSize": {"value": 11},
                "fontWeight": {"value": 600},
                "fill": {"scale": "color", "field": "series_value"},
                "opacity": {"signal": "datum.facet_value === parent.facet_value ? 1 : 0"}
              }
            }
          },
          {
            "type": "group",
            "from": {
              "facet": {"name": "series_split", "data": "cell", "groupby": "series_value"}
            },
            "marks": [
              {
                "type": "line",
                "name": "sparkline",
                "from": {"data": "series_split"},
                "encode": {
                  "update": {
                    "x": {"scale": "x", "field": "date_value"},
                    "y": {"scale": "yscale", "field": "amount"},
                    "stroke": {"scale": "color", "field": "series_value"},
                    "strokeWidth": {"signal": "hoveredSeries === datum.series_value ? 2.5 : 1.5"},
                    "opacity": {"signal": "hoveredSeries === null || hoveredSeries === datum.series_value ? 1 : 0.25"},
                    "interpolate": {"value": "monotone"},
                    "tooltip": {
                      "signal": "@{options.show_tooltip.value} ? {'Facet': datum.facet_value, 'Date': timeFormat(datum.date_value, '%Y-%m-%d'), 'Value': format(datum.amount, ',')} : null"
                    }
                  }
                }
              }
            ]
          }
        ]
      }
    ]
  };;
}
Required fields
A Faceted Sparkline expects exactly four fields. facet makes one panel per category, and within each panel series draws one line per series.
| Field | Label | Type | Role |
|---|---|---|---|
date | Date | dimension | Time axis (x) within each panel. Sorted ascending (apply_order: 1). |
value | Value | measure | Line height (y), scaled per panel. Sorted ascending (apply_order: 2). |
facet | Facet | dimension | Splits the data into one panel per value. Sorted ascending (apply_order: 3). |
series | Series | dimension | Draws one colored line per value within each panel. Sorted ascending (apply_order: 4). |
Data requirements: Pre-aggregate to one row per date, facet, and series combination; the template plots value directly without summing. The template drops rows where value is null. If every facet has only one series, supply a constant series value so each panel still draws a single line.
Sample data:
| date | value | facet | series |
|---|---|---|---|
| 2024-01-01 | 4200 | APAC | Revenue |
| 2024-02-01 | 4600 | APAC | Revenue |
| 2024-03-01 | 5100 | APAC | Revenue |
| 2024-01-01 | 3100 | EMEA | Revenue |
| 2024-02-01 | 2950 | EMEA | Revenue |
| 2024-03-01 | 3300 | EMEA | Revenue |
Options
Set these options to adjust the layout without editing the Vega template. The CustomChartDef block above declares each option's type and allowed values.
| Option | Default | Effect |
|---|---|---|
show_tooltip | true | Toggles the hover tooltip on each line. |
facet_columns | 4 | Number of panels per row; the grid wraps to as many rows as needed. |
color_scheme | tableau10 | Ordinal color palette applied to the series. |
Known limitations
-
Panels do not share a y-scale. Each panel scales independently, so it shows trend shape, not absolute size. Use a single chart with a shared axis when you need to compare magnitudes across categories.
-
Many facets shrink each panel. Every facet value gets its own panel, so a large number of facets leaves each one too small to read. Filter to the categories you care about or raise
facet_columns. -
No dedicated axis labels per panel. Panels show the trend, a header value, and a hover crosshair, but no full axis ticks. Reach for a regular line chart when exact axis values matter.