Histogram
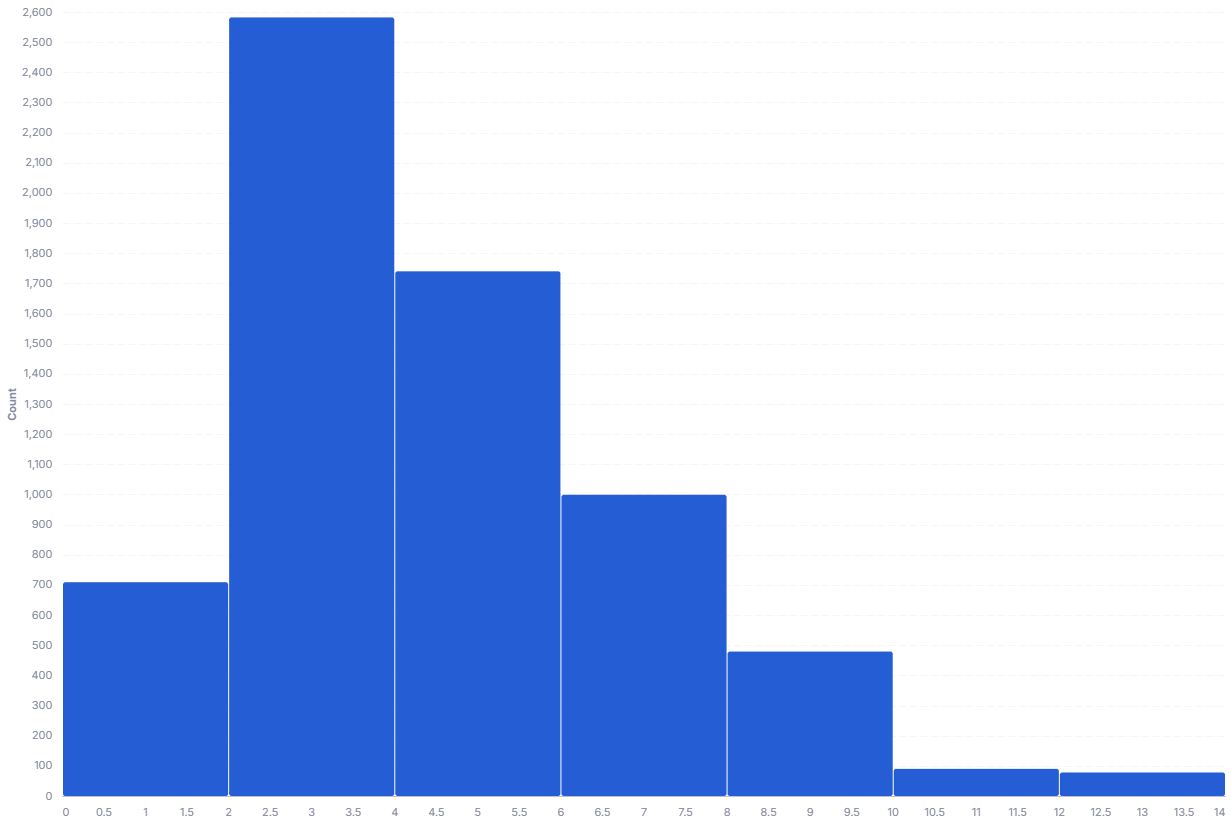
A histogram groups numerical values into discrete ranges (bins) and uses bars to show how many values fall in each bin. It is a simple yet effective way to grasp the distribution of a numeric variable.
- Good for: seeing the distribution of a single numeric variable, spotting skew or outliers, checking how values cluster (order value, response time, age).
- Not great for: comparing distributions across categories (use a ridgeline chart), categorical counts (use a bar chart), or two-metric density (use a density contour plot).
Syntax
Use the following AML definition to add the Histogram to your custom chart library.
CustomChartDef histogram {
  label: 'Histogram'
  icon: 'hicon:chart-histogram'
  description: 'To group numerical values into discrete ranges (bins) and use bars to show how many members fall into each bin.'
  fields {
    field dimension {
      label: 'Dimension'
      type: 'dimension'
      sort {
        apply_order: 1
        direction: 'asc'
      }
    }
    field value {
      label: 'Value'
      type: 'dimension'
      data_type: 'number'
      sort {
        apply_order: 2
        direction: 'asc'
      }
    }
  }
  options {
    option max_bins {
      type: 'number-input'
      label: 'Max bins'
      default_value: 40
    }

    option show_tooltip {
      type: 'toggle'
      label: 'Show tooltip'
      default_value: true
    }
  }
  template: @vgl {
    "data": {"values": @{values}},
    "transform": [
      {"bin": {"maxbins": @{options.max_bins.value}}, "field": @{fields.value.name}, "as": "bin_start"}
    ],
    "params": [
      {"name": "normalPointSelection", "select": {"type": "point", "toggle": "true", "clear": "mouseup"}},
      {"name": "hoverPointSelection", "select": {"type": "point", "on": "mouseover", "clear": "mouseout"}}
    ],
    "mark": {"type": "bar", "tooltip": @{options.show_tooltip.value}},
    "encoding": {
      "x": {"field": "bin_start", "type": "quantitative", "bin": {"binned": true}, "axis": {"format": @{fields.value.format}, "formatType": "holisticsFormat", "grid": false}},
      "x2": {"field": "bin_start_end"},
      "y": {"aggregate": "count", "title": "Count"},
      "fillOpacity": {
        "condition": {"param": "hoverPointSelection", "value": 1},
        "value": 0.15
      }
    },
    "holisticsConfig": {
      "crossFilterSignals": ["normalPointSelection"],
      "contextMenuSignals": ["hoverPointSelection"]
    }
  };;
}
 View on GitHub
Legacy syntax
CustomChart {
  fields {
    field grain {
      type: 'dimension'
    }
    field metric {
      type: 'dimension'
    }
  }
  template: @vgl
  {
    "data": {"values": @{values}},
    "transform": [
      {"bin": {"maxbins": 40}, "field": @{fields.metric.name}, "as": "binned_price"}
    ],
    "mark": {
      "type": "bar",
      "tooltip": true
    },
    "encoding": {
      "x": {"field": "binned_price", "type": "quantitative", "bin": {"binned": true, "step": 20}},
      "x2": {"field": "binned_price_end"},
      "y": {"aggregate": "count"}
    }
  }
  ;;
}
Required fields
A Histogram expects exactly two fields. Each row of input is one record; the chart bins the numeric value and counts how many records land in each bin.
| Field | Label | Type | Role |
|---|---|---|---|
dimension | Dimension | dimension | Grain of the data (one row per record). Sorted ascending (apply_order: 1). |
value | Value | dimension | Numeric value to bin along the x-axis. Sorted ascending (apply_order: 2). |
Data requirements: Feed raw rows (one per record), not pre-aggregated counts, since the template bins value and counts records itself. value must be numeric.
Sample data:
| dimension | value |
|---|---|
| order_1 | 42 |
| order_2 | 17 |
| order_3 | 88 |
| order_4 | 51 |
| order_5 | 23 |
| order_6 | 64 |
Options
Set these options to adjust the chart without editing the Vega template. The CustomChartDef block above declares each option's type and allowed values.
| Option | Default | Effect |
|---|---|---|
max_bins | 40 | Maximum number of bins the histogram will use. Smaller values produce wider, fewer bins; larger values produce narrower, more bins. |
show_tooltip | true | Toggles the hover tooltip on bars. |
Known limitations
-
valuemust be numeric. The bin transform runs onvalue, so a non-numeric field cannot be binned. Use a bar chart for categorical counts. -
Needs raw rows, not aggregates. The chart counts records per bin, so pre-summarized input distorts the distribution. Feed one row per record.
-
Bin width is approximate.
max_binsis an upper bound, not an exact count; Vega rounds to a readable bin width, so the rendered bar count can be lower.