Ridgeline Chart
A ridgeline chart compares the distribution of a numeric value across categories, drawing one smooth density curve per category in a compact stack. Where a box plot shows summary statistics, a ridgeline shows the actual shape (skew, peaks, outlier tails) of each group.
- Good for: comparing the shape of one numeric value across categories, spotting skew or multiple peaks per group, seeing how distributions shift (delivery time by carrier, order value by segment).
- Not great for: a single ungrouped distribution (use a histogram), two-metric density (use a density contour plot), or exact summary statistics (use a box plot).
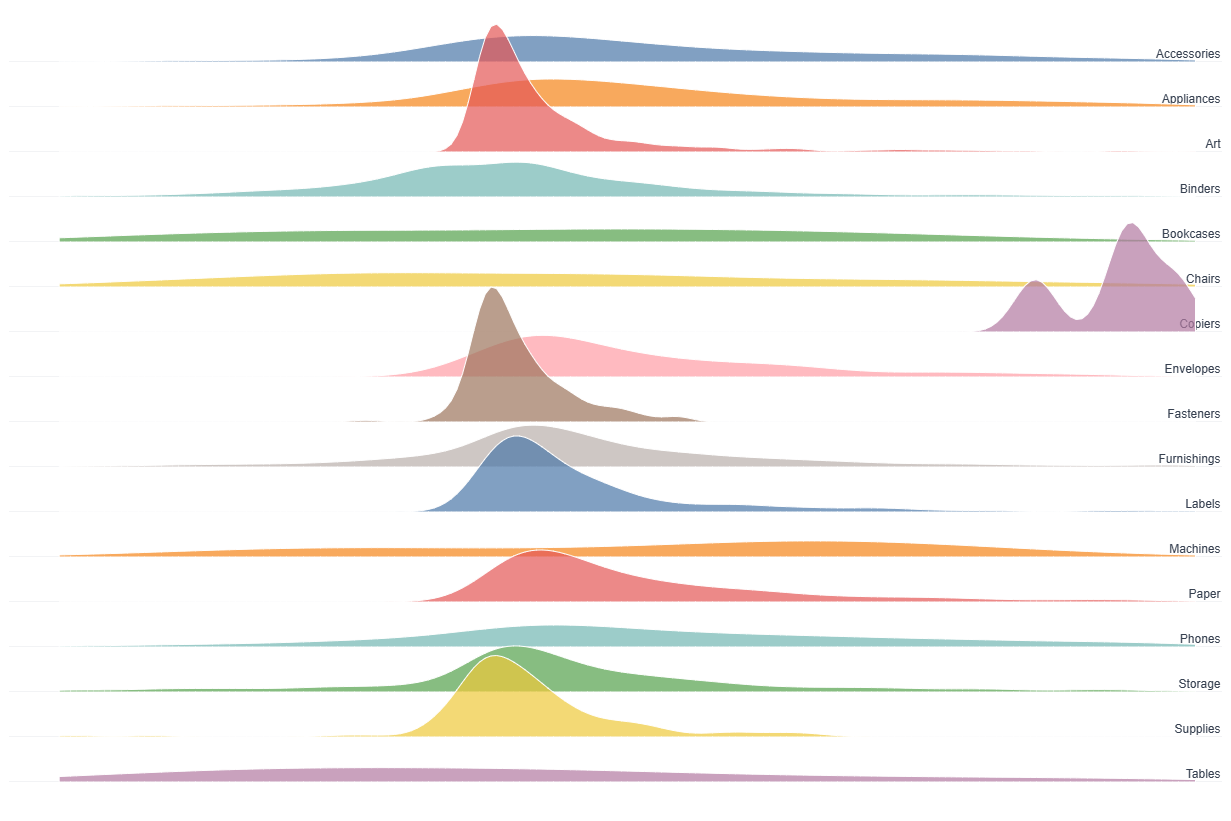
Syntax
Use the following AML definition to add the Ridgeline Chart to your custom chart library.
CustomChartDef ridgeline_chart {
  label: 'Ridgeline Chart'
  icon: 'hicon:chart-area-2'
  description: 'To compare the distribution of a numeric value across categories, with one overlapping density curve per category.'

  fields {
    field dimension {
      label: 'Dimension'
      type: 'dimension'
      sort {
        apply_order: 1
        direction: 'asc'
      }
    }

    field value {
      label: 'Value'
      type: 'dimension' // numeric; use a row-level number, not an aggregated measure
      data_type: 'number'
      sort {
        apply_order: 2
        direction: 'asc'
      }
    }
  }

  options {
    option overlap {
      label: 'Ridge overlap'
      type: 'select'
      options: [
        1,
        1.5,
        2,
        2.5,
        3
      ]
      default_value: 2
    }

    option bandwidth {
      label: 'KDE bandwidth (0 = automatic)'
      type: 'number-input'
      default_value: 0
    }

    option scale_by_count {
      label: 'Scale ridge height by record count'
      type: 'toggle'
      default_value: false
    }

    option show_tooltip {
      label: 'Show tooltip'
      type: 'toggle'
      default_value: true
    }

  }

  template: @vg {
    "$schema": "https://vega.github.io/schema/vega/v5.json",
    "signals": [
      {
        "name": "width",
        "init": "containerSize()[0] - 16",
        "on": [{ "events": "window:resize", "update": "containerSize()[0] - 16" }]
      },
      {
        "name": "height",
        "init": "containerSize()[1] - 44",
        "on": [{ "events": "window:resize", "update": "containerSize()[1] - 44" }]
      },
      {"name": "overlap", "update": "@{options.overlap.value}"},
      {"name": "bandwidth", "update": "@{options.bandwidth.value}"},
      {"name": "showTooltip", "update": "@{options.show_tooltip.value}"},
      {"name": "ext", "update": "length(data('value_extent')) ? data('value_extent')[0] : null"},
      {"name": "iqr", "update": "ext ? ext.q3 - ext.q1 : 0"},
      {"name": "vmin", "update": "ext ? (iqr > 0 ? max(ext.raw_min, ext.q1 - 1.5 * iqr) : ext.raw_min) : 0"},
      {"name": "vmax", "update": "ext ? (iqr > 0 ? min(ext.raw_max, ext.q3 + 1.5 * iqr) : ext.raw_max) : 1"},
      {"name": "domainMax", "update": "length(data('density_max')) ? data('density_max')[0].dmax : 1"},
      {
        "name": "hovered",
        "value": null,
        "on": [
          {"events": "@ridge:mouseover", "update": "datum.category"},
          {"events": "@ridge:mouseout", "update": "null"}
        ]
      },
      {
        "name": "normalPointSelection",
        "value": null,
        "on": [
          {"events": "@ridge:click", "update": "{'@{fields.dimension.name}': [datum['category']]}"},
          {"events": "click[!event.item]", "update": "null"}
        ]
      },
      {
        "name": "hoverPointSelection",
        "value": null,
        "on": [
          {"events": "@ridge:mouseover", "update": "{'@{fields.dimension.name}': [datum['category']]}"},
          {"events": "@ridge:mouseout", "update": "null"}
        ]
      }
    ],
    "holisticsConfig": {
      "crossFilterSignals": ["normalPointSelection"],
      "contextMenuSignals": ["hoverPointSelection"]
    },
    "data": [
      {
        "name": "source",
        "values": @{values},
        "transform": [
          {"type": "formula", "expr": "datum['@{fields.dimension.name}']", "as": "category"},
          {"type": "formula", "expr": "datum['@{fields.value.name}']", "as": "amount"},
          {"type": "filter", "expr": "datum.amount != null"}
        ]
      },
      {
        "name": "value_extent",
        "source": "source",
        "transform": [
          {
            "type": "aggregate",
            "fields": ["amount", "amount", "amount", "amount"],
            "ops": ["min", "max", "q1", "q3"],
            "as": ["raw_min", "raw_max", "q1", "q3"]
          }
        ]
      },
      {
        "name": "density",
        "source": "source",
        "transform": [
          {"type": "filter", "expr": "datum.amount >= vmin && datum.amount <= vmax"},
          {
            "type": "kde",
            "groupby": ["category"],
            "field": "amount",
            "bandwidth": {"signal": "bandwidth"},
            "extent": {"signal": "[vmin, vmax]"},
            "steps": 200,
            "counts": @{options.scale_by_count.value}
          }
        ]
      },
      {
        "name": "density_max",
        "source": "density",
        "transform": [
          {"type": "aggregate", "fields": ["density"], "ops": ["max"], "as": ["dmax"]}
        ]
      }
    ],
    "scales": [
      {
        "name": "xscale",
        "type": "linear",
        "range": [0, {"signal": "width"}],
        "zero": false,
        "nice": true,
        "domain": {"signal": "[vmin, vmax]"}
      },
      {
        "name": "yscale",
        "type": "band",
        "range": [0, {"signal": "height"}],
        "round": true,
        "padding": 0,
        "domain": {"data": "source", "field": "category", "sort": true}
      },
      {
        "name": "color",
        "type": "ordinal",
        "domain": {"data": "source", "field": "category", "sort": true},
        "range": "category"
      }
    ],
    "axes": [
      {"orient": "bottom", "scale": "xscale", "labelFontSize": 12, "labelPadding": 8},
      {
        "orient": "right",
        "scale": "yscale",
        "labelFontSize": 12,
        "encode": {
          "labels": {
            "update": {
              "dx": {"value": -4},
              "dy": {"value": -2},
              "y": {"scale": "yscale", "field": "value", "band": 1},
              "align": {"value": "right"},
              "baseline": {"value": "bottom"},
              "fontWeight": {
                "signal": "hovered === datum.value ? 600 : 400"
              }
            }
          }
        }
      }
    ],
    "marks": [
      {
        "type": "group",
        "from": {
          "facet": {"data": "density", "name": "cat_density", "groupby": "category"}
        },
        "encode": {
          "update": {
            "y": {"scale": "yscale", "field": "category"},
            "width": {"signal": "width"},
            "height": {"signal": "bandwidth('yscale')"}
          }
        },
        "sort": {"field": "y", "order": "ascending"},
        "signals": [
          {"name": "bandH", "update": "bandwidth('yscale')"}
        ],
        "scales": [
          {
            "name": "yinner",
            "type": "linear",
            "range": [{"signal": "bandH"}, {"signal": "0 - overlap * bandH"}],
            "domain": [0, {"signal": "domainMax"}]
          }
        ],
        "marks": [
          {
            "type": "rule",
            "interactive": false,
            "encode": {
              "update": {
                "x": {"value": 0},
                "x2": {"signal": "width"},
                "y": {"signal": "bandH", "offset": -0.5},
                "stroke": {"value": "#E5E7EB"},
                "strokeWidth": {"value": 0.5}
              }
            }
          },
          {
            "type": "area",
            "name": "ridge",
            "from": {"data": "cat_density"},
            "encode": {
              "update": {
                "x": {"scale": "xscale", "field": "value"},
                "y": {"scale": "yinner", "field": "density"},
                "y2": {"scale": "yinner", "value": 0},
                "fill": {"scale": "color", "field": "category"},
                "fillOpacity": {
                  "signal": "hovered === null ? 0.7 : (hovered === datum.category ? 0.92 : 0.2)"
                },
                "stroke": {"value": "white"},
                "strokeWidth": {"value": 1},
                "tooltip": {"signal": "showTooltip ? datum.category : null"}
              }
            }
          }
        ]
      }
    ]
  };;
}
Required fields
A Ridgeline Chart expects exactly two fields. Each row of input is one observation; the chart groups rows by dimension and estimates a density curve per group.
| Field | Label | Type | Role |
|---|---|---|---|
dimension | Dimension | dimension | Category that gets one ridge (density curve). Sorted ascending (apply_order: 1). |
value | Value | dimension | Numeric value whose distribution each ridge shows. Sorted ascending (apply_order: 2). |
Data requirements: Feed raw observations (one row per record), not pre-aggregated values, since the template estimates each category's density with KDE. value must be numeric; the template drops rows where it is null before rendering.
Sample data:
| dimension | value |
|---|---|
| Carrier A | 2.1 |
| Carrier A | 3.4 |
| Carrier A | 2.8 |
| Carrier B | 4.5 |
| Carrier B | 5.2 |
| Carrier C | 1.9 |
Options
Set these options to adjust the chart without editing the Vega template. The CustomChartDef block above declares each option's type and allowed values.
| Option | Default | Effect |
|---|---|---|
overlap | 2 | How much each ridge overlaps the one above it. Higher values stack the curves more tightly. |
bandwidth | 0 | KDE smoothing bandwidth. 0 lets Vega pick automatically; larger values produce smoother curves. |
scale_by_count | false | When on, ridge height reflects each category's record count instead of scaling every ridge to its own shape. |
show_tooltip | true | Toggles the category label tooltip on hover over each ridge. |
Known limitations
-
valuemust be numeric. The KDE runs onvalue, so a non-numeric field will not produce a density curve. -
Needs raw rows, not aggregates. The density estimate runs on individual observations, so pre-aggregated input gives a misleading shape. Feed one row per record.
-
The chart clips outliers to the Tukey fences. It clamps the visible range to 1.5 IQR beyond the quartiles, so values in the extreme tails fall outside the drawn range.