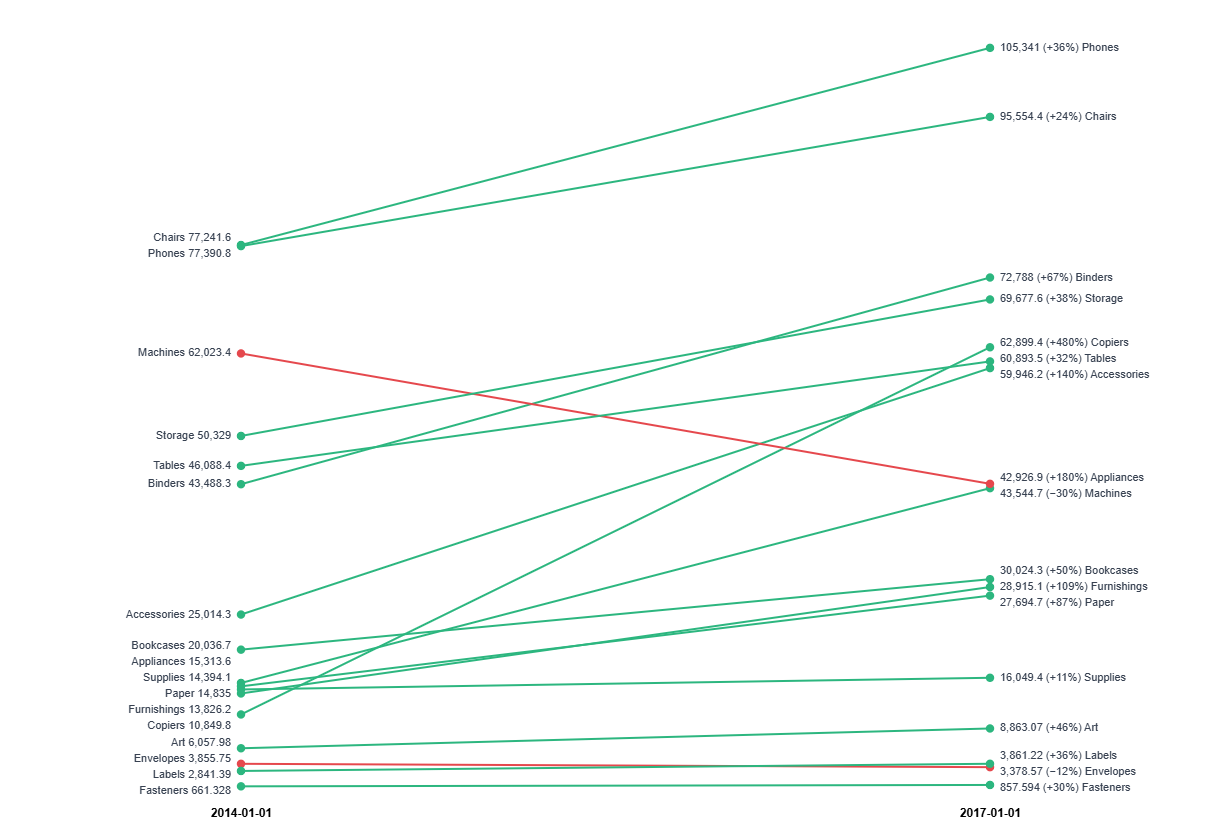
Slope Chart
A slope chart compares each category's value at two points in time, with one line per category whose slope tells the story. The chart colors lines by direction (up, down, flat) and labels both ends, so there is no legend to decode.
- Good for: before-and-after comparisons like this quarter vs last quarter revenue by region, NPS by segment around a launch, or cost per team across two budget cycles.
- Not great for: trends across many periods (use the Bump Chart for ranks or a line chart for values), or more than ~10 categories where labels and lines crowd together (use the Faceted Sparkline).
Syntax
Use the following AML definition to add the Slope Chart to your custom chart library.
CustomChartDef slope_chart {
  label: 'Slope Chart'
  description: 'To compare each category at two points in time, with lines colored by direction of change and labeled at both ends.'

  fields {
    field period {
      label: 'Period'
      type: 'dimension'
      sort {
        apply_order: 1
        direction: 'asc'
      }
    }

    field dimension {
      label: 'Dimension'
      type: 'dimension'
      sort {
        apply_order: 2
        direction: 'asc'
      }
    }

    field value {
      label: 'Value'
      type: 'measure'
      sort {
        apply_order: 3
        direction: 'asc'
      }
    }
  }

  options {
    option increase_color {
      label: 'Increase Color'
      type: 'color-picker'
      default_value: '#2cb67f'
    }

    option decrease_color {
      label: 'Decrease Color'
      type: 'color-picker'
      default_value: '#e5484d'
    }

    option show_change {
      label: 'Show % change on the right label'
      type: 'toggle'
      default_value: true
    }
  }

  template: @vg {
    "$schema": "https://vega.github.io/schema/vega/v5.json",
    "signals": [
      {
        "name": "width",
        "init": "containerSize()[0]",
        "on": [{ "events": "window:resize", "update": "containerSize()[0]" }]
      },
      {
        "name": "height",
        "init": "containerSize()[1]",
        "on": [{ "events": "window:resize", "update": "containerSize()[1]" }]
      },
      {"name": "gutter", "update": "clamp(width * 0.22, 90, 240)"},
      {"name": "firstPeriod", "update": "length(data('periods')) ? data('periods')[0].period : null"},
      {"name": "lastPeriod", "update": "length(data('periods')) ? data('periods')[length(data('periods')) - 1].period : null"},
      {
        "name": "hoveredCat",
        "value": null,
        "on": [
          {
            "events": "@slopeLine:mouseover, @startDot:mouseover, @endDot:mouseover, @leftLabel:mouseover, @rightLabel:mouseover",
            "update": "datum.category"
          },
          {
            "events": "@slopeLine:mouseout, @startDot:mouseout, @endDot:mouseout, @leftLabel:mouseout, @rightLabel:mouseout",
            "update": "null"
          }
        ]
      },
      {
        "name": "normalPointSelection",
        "value": null,
        "on": [
          {"events": "@slopeLine:click, @startDot:click, @endDot:click, @leftLabel:click, @rightLabel:click", "update": "{'@{fields.dimension.name}': [datum['category']]}"},
          {"events": "click[!event.item]", "update": "null"}
        ]
      },
      {
        "name": "hoverPointSelection",
        "value": null,
        "on": [
          {"events": "@slopeLine:mouseover, @startDot:mouseover, @endDot:mouseover, @leftLabel:mouseover, @rightLabel:mouseover", "update": "{'@{fields.dimension.name}': [datum['category']]}"},
          {"events": "@slopeLine:mouseout, @startDot:mouseout, @endDot:mouseout, @leftLabel:mouseout, @rightLabel:mouseout", "update": "null"}
        ]
      }
    ],
    "holisticsConfig": {
      "crossFilterSignals": ["normalPointSelection"],
      "contextMenuSignals": ["hoverPointSelection"]
    },
    "data": [
      {
        "name": "source",
        "values": @{values},
        "transform": [
          {"type": "formula", "expr": "datum['@{fields.period.name}']", "as": "period"},
          {"type": "formula", "expr": "datum['@{fields.dimension.name}']", "as": "category"},
          {"type": "formula", "expr": "datum['@{fields.value.name}']", "as": "amount"},
          {"type": "filter", "expr": "datum.amount != null"}
        ]
      },
      {
        "name": "periods",
        "source": "source",
        "transform": [
          {"type": "aggregate", "groupby": ["period"]},
          {"type": "collect", "sort": {"field": "period"}}
        ]
      },
      {
        "name": "starts",
        "source": "source",
        "transform": [
          {"type": "filter", "expr": "datum.period === firstPeriod"},
          {
            "type": "aggregate",
            "groupby": ["category"],
            "fields": ["amount"],
            "ops": ["sum"],
            "as": ["amount"]
          }
        ]
      },
      {
        "name": "ends",
        "source": "source",
        "transform": [
          {"type": "filter", "expr": "datum.period === lastPeriod"},
          {
            "type": "aggregate",
            "groupby": ["category"],
            "fields": ["amount"],
            "ops": ["sum"],
            "as": ["end_amount"]
          }
        ]
      },
      {
        "name": "slopes",
        "source": "starts",
        "transform": [
          {
            "type": "lookup",
            "from": "ends",
            "key": "category",
            "fields": ["category"],
            "values": ["end_amount"],
            "as": ["end_amount"]
          },
          {"type": "filter", "expr": "datum.end_amount != null"},
          {"type": "formula", "expr": "datum.end_amount - datum.amount", "as": "delta"},
          {
            "type": "formula",
            "expr": "datum.delta > 0 ? 'up' : (datum.delta < 0 ? 'down' : 'flat')",
            "as": "direction"
          },
          {"type": "collect", "sort": {"field": "category"}}
        ]
      },
      {
        "name": "extents",
        "source": "slopes",
        "transform": [
          {"type": "fold", "fields": ["amount", "end_amount"], "as": ["which", "v"]}
        ]
      },
      {
        "name": "left_labels",
        "source": "slopes",
        "transform": [
          {"type": "formula", "expr": "scale('y', datum.amount)", "as": "targetY"},
          {"type": "formula", "expr": "0", "as": "fx"},
          {
            "type": "force",
            "static": true,
            "forces": [
              {"force": "x", "x": "fx", "strength": 1},
              {"force": "y", "y": "targetY", "strength": 0.6},
              {"force": "collide", "radius": 8}
            ]
          }
        ]
      },
      {
        "name": "right_labels",
        "source": "slopes",
        "transform": [
          {"type": "formula", "expr": "scale('y', datum.end_amount)", "as": "targetY"},
          {"type": "formula", "expr": "0", "as": "fx"},
          {
            "type": "force",
            "static": true,
            "forces": [
              {"force": "x", "x": "fx", "strength": 1},
              {"force": "y", "y": "targetY", "strength": 0.6},
              {"force": "collide", "radius": 8}
            ]
          }
        ]
      }
    ],
    "scales": [
      {
        "name": "x",
        "type": "point",
        "domain": {"signal": "[firstPeriod, lastPeriod]"},
        "range": [{"signal": "gutter"}, {"signal": "width - gutter"}]
      },
      {
        "name": "y",
        "type": "linear",
        "nice": true,
        "zero": false,
        "domain": {"data": "extents", "field": "v"},
        "range": [{"signal": "height - 30"}, 14]
      },
      {
        "name": "color",
        "type": "ordinal",
        "domain": ["up", "down", "flat"],
        "range": [@{options.increase_color.value}, @{options.decrease_color.value}, "#9ba1a6"]
      }
    ],
    "axes": [
      {"orient": "bottom", "scale": "x", "offset": -22}
    ],
    "marks": [
      {
        "type": "rule",
        "name": "slopeLine",
        "from": {"data": "slopes"},
        "encode": {
          "update": {
            "x": {"scale": "x", "signal": "firstPeriod"},
            "x2": {"scale": "x", "signal": "lastPeriod"},
            "y": {"scale": "y", "field": "amount"},
            "y2": {"scale": "y", "field": "end_amount"},
            "stroke": {"scale": "color", "field": "direction"},
            "strokeWidth": {"signal": "hoveredCat === datum.category ? 3.5 : 2"},
            "opacity": {"signal": "hoveredCat === null || hoveredCat === datum.category ? 1 : 0.15"},
            "tooltip": {
              "signal": "{'Category': datum.category, 'From': format(datum.amount, ','), 'To': format(datum.end_amount, ','), 'Change': format(datum.delta, '+,') + (datum.amount !== 0 ? ' (' + format(datum.delta / datum.amount, '+.1%') + ')' : '')}"
            }
          }
        }
      },
      {
        "type": "symbol",
        "name": "startDot",
        "from": {"data": "slopes"},
        "encode": {
          "update": {
            "x": {"scale": "x", "signal": "firstPeriod"},
            "y": {"scale": "y", "field": "amount"},
            "fill": {"scale": "color", "field": "direction"},
            "size": {"value": 70},
            "opacity": {"signal": "hoveredCat === null || hoveredCat === datum.category ? 1 : 0.15"}
          }
        }
      },
      {
        "type": "symbol",
        "name": "endDot",
        "from": {"data": "slopes"},
        "encode": {
          "update": {
            "x": {"scale": "x", "signal": "lastPeriod"},
            "y": {"scale": "y", "field": "end_amount"},
            "fill": {"scale": "color", "field": "direction"},
            "size": {"value": 70},
            "opacity": {"signal": "hoveredCat === null || hoveredCat === datum.category ? 1 : 0.15"}
          }
        }
      },
      {
        "type": "text",
        "name": "leftLabel",
        "from": {"data": "left_labels"},
        "encode": {
          "update": {
            "x": {"scale": "x", "signal": "firstPeriod", "offset": -10},
            "y": {"field": "y"},
            "align": {"value": "right"},
            "baseline": {"value": "middle"},
            "text": {"signal": "datum.category + '  ' + format(datum.amount, ',')"},
            "limit": {"signal": "gutter - 14"},
            "fontSize": {"value": 11},
            "fontWeight": {"signal": "hoveredCat === datum.category ? 700 : 400"},
            "fill": {"value": "#374151"},
            "opacity": {"signal": "hoveredCat === null || hoveredCat === datum.category ? 1 : 0.25"}
          }
        }
      },
      {
        "type": "text",
        "name": "rightLabel",
        "from": {"data": "right_labels"},
        "encode": {
          "update": {
            "x": {"scale": "x", "signal": "lastPeriod", "offset": 10},
            "y": {"field": "y"},
            "align": {"value": "left"},
            "baseline": {"value": "middle"},
            "text": {
              "signal": "format(datum.end_amount, ',') + (@{options.show_change.value} && datum.amount !== 0 ? ' (' + format(datum.delta / datum.amount, '+.0%') + ')' : '') + '  ' + datum.category"
            },
            "limit": {"signal": "gutter - 14"},
            "fontSize": {"value": 11},
            "fontWeight": {"signal": "hoveredCat === datum.category ? 700 : 400"},
            "fill": {"value": "#374151"},
            "opacity": {"signal": "hoveredCat === null || hoveredCat === datum.category ? 1 : 0.25"}
          }
        }
      }
    ],
    "config": {
      "axis": {"domain": false, "ticks": false, "labelFontSize": 12, "labelFontWeight": 600, "labelPadding": 8}
    }
  };;
}
Required fields
A Slope Chart expects exactly three fields. Each row is one category's value in one period, and the template draws one line per category between the first and last period.
| Field | Label | Type | Role |
|---|---|---|---|
period | Period | dimension | The two endpoints on the x-axis; the template uses only the first and last period values. Sorted ascending (apply_order: 1). |
dimension | Dimension | dimension | The category; one slope line per category, labeled at both ends. Sorted ascending (apply_order: 2). |
value | Value | measure | The amount plotted at each endpoint, setting line height and slope direction. Sorted ascending (apply_order: 3). |
Data requirements: The template sums duplicate category rows within a period and drops null values, so you don't need to pre-aggregate. Each category needs a value at both the first and last period; the chart drops categories present in only one of the two. If the data has more than two periods, it compares only the first and last.
Sample data:
| period | dimension | value |
|---|---|---|
| 2024-Q1 | North | 4200 |
| 2024-Q1 | South | 3100 |
| 2024-Q1 | East | 2600 |
| 2024-Q1 | West | 1800 |
| 2024-Q4 | North | 3900 |
| 2024-Q4 | South | 3600 |
| 2024-Q4 | East | 2400 |
| 2024-Q4 | West | 2700 |
Options
Set these options to adjust the chart without editing the Vega template. The CustomChartDef block above declares each option's type and allowed values.
| Option | Default | Effect |
|---|---|---|
increase_color | #2cb67f | Color for lines that go up between the two periods. |
decrease_color | #e5484d | Color for lines that go down between the two periods. |
show_change | true | When on, appends the percent change to each category's right-hand (end) label. |
Known limitations
-
Compares exactly two periods. With more than two periods, the chart plots only the first and last and ignores the middle. Use the Bump Chart or a line chart to show every period.
-
Categories need both endpoints. The chart drops any category missing at either the first or last period, since it has no slope to draw.
-
Readability drops past ~10 categories. Beyond roughly 10 lines the direct labels overlap and slopes get hard to separate. Group smaller categories together first.