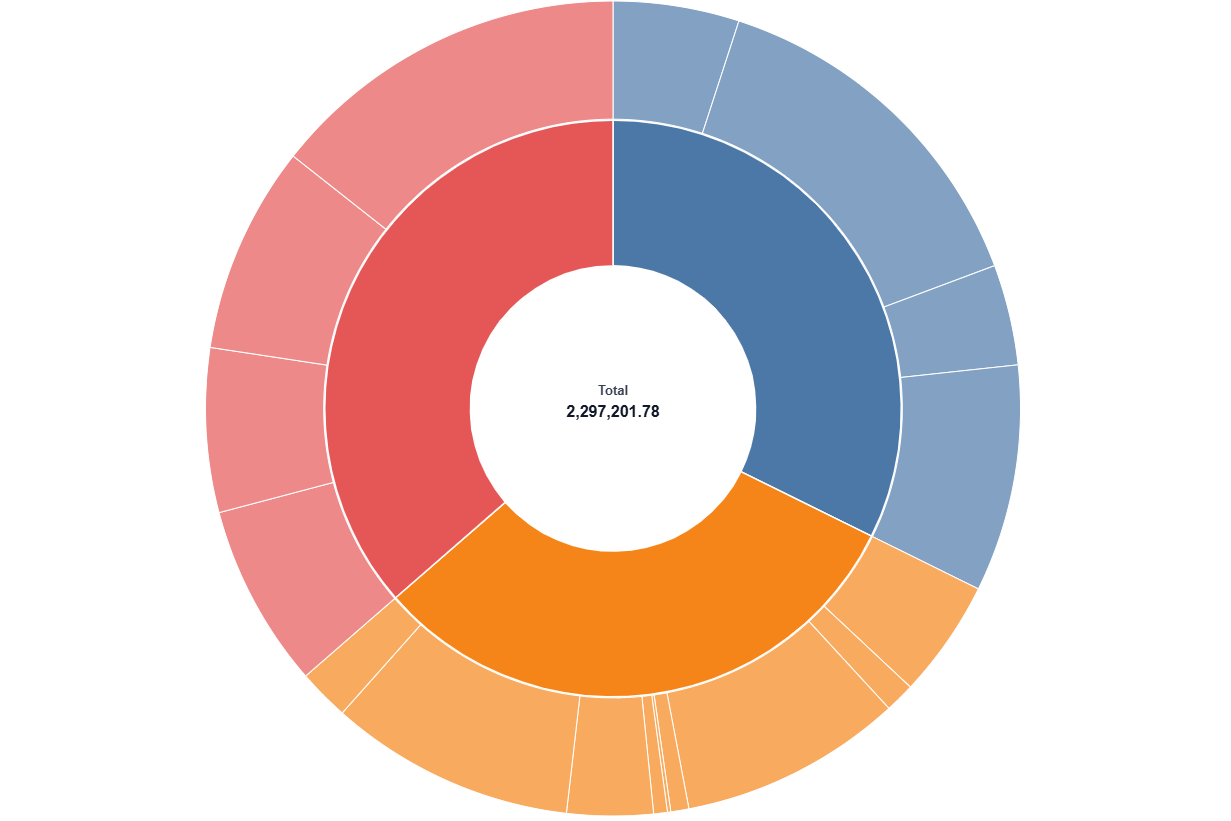
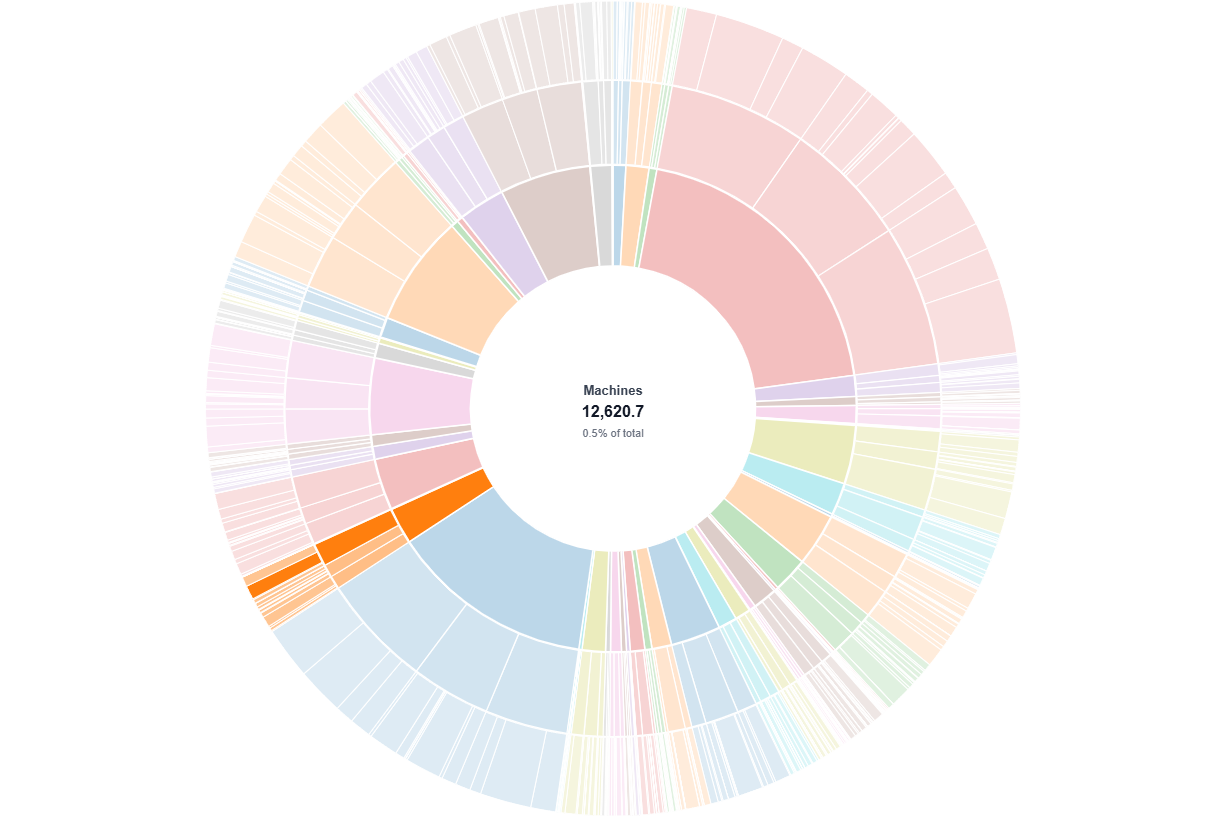
Sunburst Chart
A sunburst chart visualizes hierarchical composition as concentric rings. The inner ring breaks the total into categories, and outer rings split each category into its children. The wider the arc, the larger the value.
- Good for: part-to-whole analysis across 2-3 levels of hierarchy (revenue by product line and product, tickets by team and type, budget by department and cost center).
- Not great for: flat (non-hierarchical) data, time series, or more than ~10 categories on the inner ring (slices get too thin to read).
Syntax
Two variants are available:
- Two-level: category + subcategory
- Three-level: category + subcategory + item
Two-level hierarchy
CustomChartDef sunburst_chart {
  label: 'Sunburst Chart'
  description: 'To show a two-level hierarchy as concentric rings, with categories on the inner ring and subcategories on the outer ring.'
  fields {
    field level_1 {
      label: 'Level 1'
      type: 'dimension'
      sort {
        apply_order: 1
        direction: 'asc'
      }
    }
    field level_2 {
      label: 'Level 2'
      type: 'dimension'
      sort {
        apply_order: 2
        direction: 'asc'
      }
    }
    field value {
      label: 'Value'
      type: 'measure'
      sort {
        apply_order: 3
        direction: 'desc'
      }
    }
  }
  options {
    option color_scheme {
      type: 'select'
      label: 'Color scheme'
      options: ['tableau10', 'category10', 'accent', 'dark2', 'paired', 'set2']
      default_value: 'tableau10'
    }
    option donut_hole {
      type: 'select'
      label: 'Center hole size'
      options: [0, 0.2, 0.35, 0.5]
      default_value: 0.35
    }
  }
  template: @vg {
    "$schema": "https://vega.github.io/schema/vega/v5.json",
    "signals": [
      {
        "name": "width",
        "init": "containerSize()[0] - 5",
        "on": [{ "events": "window:resize", "update": "containerSize()[0] - 5" }]
      },
      {
        "name": "height",
        "init": "containerSize()[1] - 5",
        "on": [{ "events": "window:resize", "update": "containerSize()[1] - 5" }]
      },
      {"name": "radius", "update": "min(width, height) / 2"},
      {"name": "holeR", "update": "radius * @{options.donut_hole.value}"},
      {"name": "ringSplit", "update": "holeR + (radius - holeR) * 0.55"},
      {"name": "grandTotal", "update": "length(data('cats')) ? data('cats')[0].total : 0"},
      {
        "name": "hovered",
        "value": null,
        "on": [
          {
            "events": "@catArc:mouseover",
            "update": "{kind: 'category', category: datum.category, label: datum.category, amount: datum.amount, share: datum.amount / datum.total}"
          },
          {
            "events": "@leafArc:mouseover",
            "update": "{kind: 'subcategory', category: datum.category, label: datum.subcategory, amount: datum.amount, share: datum.amount / datum.total}"
          },
          {"events": "@catArc:mouseout, @leafArc:mouseout", "update": "null"}
        ]
      },
      {
        "name": "normalPointSelection",
        "value": null,
        "on": [
          {"events": "@catArc:click", "update": "{'@{fields.level_1.name}': [datum.category]}"},
          {"events": "@leafArc:click", "update": "{'@{fields.level_2.name}': [datum.subcategory]}"},
          {"events": "click[!event.item]", "update": "null"}
        ]
      },
      {
        "name": "hoverPointSelection",
        "value": null,
        "on": [
          {"events": "@catArc:mouseover", "update": "{'@{fields.level_1.name}': [datum.category]}"},
          {"events": "@leafArc:mouseover", "update": "{'@{fields.level_2.name}': [datum.subcategory]}"},
          {"events": "@catArc:mouseout, @leafArc:mouseout", "update": "null"}
        ]
      }
    ],
    "holisticsConfig": {
      "crossFilterSignals": ["normalPointSelection"],
      "contextMenuSignals": ["hoverPointSelection"]
    },
    "data": [
      {
        "name": "leaves",
        "values": @{values},
        "transform": [
          {"type": "formula", "expr": "datum['@{fields.level_1.name}']", "as": "category"},
          {"type": "formula", "expr": "datum['@{fields.level_2.name}']", "as": "subcategory"},
          {"type": "formula", "expr": "datum['@{fields.value.name}']", "as": "amount"},
          {"type": "filter", "expr": "datum.amount != null && datum.amount > 0"},
          {
            "type": "aggregate",
            "groupby": ["category", "subcategory"],
            "fields": ["amount"],
            "ops": ["sum"],
            "as": ["amount"]
          },
          {"type": "collect", "sort": {"field": ["category", "subcategory"]}},
          {
            "type": "stack",
            "field": "amount",
            "as": ["s0", "s1"]
          },
          {
            "type": "joinaggregate",
            "fields": ["amount"],
            "ops": ["sum"],
            "as": ["total"]
          },
          {
            "type": "joinaggregate",
            "fields": ["amount"],
            "ops": ["sum"],
            "as": ["cat_total"],
            "groupby": ["category"]
          },
          {"type": "formula", "expr": "datum.s0 / datum.total * 2 * PI", "as": "a0"},
          {"type": "formula", "expr": "datum.s1 / datum.total * 2 * PI", "as": "a1"}
        ]
      },
      {
        "name": "cats",
        "source": "leaves",
        "transform": [
          {
            "type": "aggregate",
            "groupby": ["category"],
            "fields": ["amount"],
            "ops": ["sum"],
            "as": ["amount"]
          },
          {"type": "collect", "sort": {"field": "category"}},
          {
            "type": "stack",
            "field": "amount",
            "as": ["s0", "s1"]
          },
          {
            "type": "joinaggregate",
            "fields": ["amount"],
            "ops": ["sum"],
            "as": ["total"]
          },
          {"type": "formula", "expr": "datum.s0 / datum.total * 2 * PI", "as": "a0"},
          {"type": "formula", "expr": "datum.s1 / datum.total * 2 * PI", "as": "a1"}
        ]
      }
    ],
    "scales": [
      {
        "name": "color",
        "type": "ordinal",
        "domain": {"data": "cats", "field": "category"},
        "range": {"scheme": @{options.color_scheme.value}}
      }
    ],
    "marks": [
      {
        "type": "arc",
        "name": "catArc",
        "from": {"data": "cats"},
        "encode": {
          "update": {
            "x": {"signal": "width / 2"},
            "y": {"signal": "height / 2"},
            "startAngle": {"field": "a0"},
            "endAngle": {"field": "a1"},
            "innerRadius": {"signal": "holeR"},
            "outerRadius": {"signal": "ringSplit"},
            "fill": {"scale": "color", "field": "category"},
            "fillOpacity": {
              "signal": "hovered === null || hovered.category === datum.category ? 1 : 0.3"
            },
            "stroke": {"value": "white"},
            "strokeWidth": {"value": 1.5},
            "tooltip": {
              "signal": "{'Category': datum.category, 'Value': format(datum.amount, ','), 'Share of Total': format(datum.amount / datum.total, '.1%')}"
            }
          }
        }
      },
      {
        "type": "arc",
        "name": "leafArc",
        "from": {"data": "leaves"},
        "encode": {
          "update": {
            "x": {"signal": "width / 2"},
            "y": {"signal": "height / 2"},
            "startAngle": {"field": "a0"},
            "endAngle": {"field": "a1"},
            "innerRadius": {"signal": "ringSplit + 1"},
            "outerRadius": {"signal": "radius"},
            "fill": {"scale": "color", "field": "category"},
            "fillOpacity": {
              "signal": "hovered === null ? 0.7 : (hovered.category !== datum.category ? 0.2 : (hovered.kind === 'subcategory' && hovered.label === datum.subcategory ? 1 : 0.75))"
            },
            "stroke": {"value": "white"},
            "strokeWidth": {"value": 1},
            "tooltip": {
              "signal": "{'Subcategory': datum.subcategory, 'Category': datum.category, 'Value': format(datum.amount, ','), 'Share of Total': format(datum.amount / datum.total, '.1%'), 'Share of Category': format(datum.amount / datum.cat_total, '.1%')}"
            }
          }
        }
      },
      {
        "type": "text",
        "interactive": false,
        "encode": {
          "update": {
            "x": {"signal": "width / 2"},
            "y": {"signal": "height / 2 - 14"},
            "align": {"value": "center"},
            "text": {"signal": "hovered === null ? 'Total' : hovered.label"},
            "limit": {"signal": "holeR * 1.7"},
            "fontSize": {"value": 13},
            "fontWeight": {"value": 600},
            "fill": {"value": "#374151"},
            "opacity": {"signal": "holeR > 30 ? 1 : 0"}
          }
        }
      },
      {
        "type": "text",
        "interactive": false,
        "encode": {
          "update": {
            "x": {"signal": "width / 2"},
            "y": {"signal": "height / 2 + 8"},
            "align": {"value": "center"},
            "text": {"signal": "format(hovered === null ? grandTotal : hovered.amount, ',')"},
            "fontSize": {"value": 16},
            "fontWeight": {"value": 700},
            "fill": {"value": "#111827"},
            "opacity": {"signal": "holeR > 30 ? 1 : 0"}
          }
        }
      },
      {
        "type": "text",
        "interactive": false,
        "encode": {
          "update": {
            "x": {"signal": "width / 2"},
            "y": {"signal": "height / 2 + 28"},
            "align": {"value": "center"},
            "text": {"signal": "hovered === null ? '' : format(hovered.share, '.1%') + ' of total'"},
            "fontSize": {"value": 11},
            "fill": {"value": "#6b7280"},
            "opacity": {"signal": "holeR > 30 ? 1 : 0"}
          }
        }
      }
    ]
  };;
}
Three-level hierarchy
The same chart with one more ring (for example, product line, product, then variant). Works best when the outer ring has a manageable number of slices; beyond a few dozen items the tooltips remain usable but the slices get thin.
CustomChartDef sunburst_chart_three_level {
  label: 'Sunburst Chart (3 levels)'
  description: 'To show a three-level hierarchy as nested rings of category, subcategory, and item composition.'
  fields {
    field level_1 {
      label: 'Level 1'
      type: 'dimension'
      sort {
        apply_order: 1
        direction: 'asc'
      }
    }
    field level_2 {
      label: 'Level 2'
      type: 'dimension'
      sort {
        apply_order: 2
        direction: 'asc'
      }
    }
    field level_3 {
      label: 'Level 3'
      type: 'dimension'
      sort {
        apply_order: 3
        direction: 'asc'
      }
    }
    field value {
      label: 'Value'
      type: 'measure'
      sort {
        apply_order: 4
        direction: 'desc'
      }
    }
  }
  options {
    option color_scheme {
      type: 'select'
      label: 'Color scheme'
      options: ['tableau10', 'category10', 'accent', 'dark2', 'paired', 'set2']
      default_value: 'tableau10'
    }
    option donut_hole {
      type: 'select'
      label: 'Center hole size'
      options: [0, 0.2, 0.35, 0.5]
      default_value: 0.35
    }
  }
  template: @vg {
    "$schema": "https://vega.github.io/schema/vega/v5.json",
    "signals": [
      {
        "name": "width",
        "init": "containerSize()[0] - 5",
        "on": [{ "events": "window:resize", "update": "containerSize()[0] - 5" }]
      },
      {
        "name": "height",
        "init": "containerSize()[1] - 5",
        "on": [{ "events": "window:resize", "update": "containerSize()[1] - 5" }]
      },
      {"name": "radius", "update": "min(width, height) / 2"},
      {"name": "holeR", "update": "radius * @{options.donut_hole.value}"},
      {"name": "ring1End", "update": "holeR + (radius - holeR) * 0.38"},
      {"name": "ring2End", "update": "holeR + (radius - holeR) * 0.7"},
      {"name": "grandTotal", "update": "length(data('cats')) ? data('cats')[0].total : 0"},
      {
        "name": "hovered",
        "value": null,
        "on": [
          {
            "events": "@catArc:mouseover",
            "update": "{kind: 'category', category: datum.category, subcategory: null, label: datum.category, amount: datum.amount, share: datum.amount / datum.total}"
          },
          {
            "events": "@subArc:mouseover",
            "update": "{kind: 'subcategory', category: datum.category, subcategory: datum.subcategory, label: datum.subcategory, amount: datum.amount, share: datum.amount / datum.total}"
          },
          {
            "events": "@leafArc:mouseover",
            "update": "{kind: 'item', category: datum.category, subcategory: datum.subcategory, label: datum.item, amount: datum.amount, share: datum.amount / datum.total}"
          },
          {"events": "@catArc:mouseout, @subArc:mouseout, @leafArc:mouseout", "update": "null"}
        ]
      }
    ],
    "data": [
      {
        "name": "leaves",
        "values": @{values},
        "transform": [
          {"type": "formula", "expr": "datum['@{fields.level_1.name}']", "as": "category"},
          {"type": "formula", "expr": "datum['@{fields.level_2.name}']", "as": "subcategory"},
          {"type": "formula", "expr": "datum['@{fields.level_3.name}']", "as": "item"},
          {"type": "formula", "expr": "datum['@{fields.value.name}']", "as": "amount"},
          {"type": "filter", "expr": "datum.amount != null && datum.amount > 0"},
          {
            "type": "aggregate",
            "groupby": ["category", "subcategory", "item"],
            "fields": ["amount"],
            "ops": ["sum"],
            "as": ["amount"]
          },
          {"type": "collect", "sort": {"field": ["category", "subcategory", "item"]}},
          {"type": "stack", "field": "amount", "as": ["s0", "s1"]},
          {"type": "joinaggregate", "fields": ["amount"], "ops": ["sum"], "as": ["total"]},
          {
            "type": "joinaggregate",
            "fields": ["amount"],
            "ops": ["sum"],
            "as": ["sub_total"],
            "groupby": ["category", "subcategory"]
          },
          {"type": "formula", "expr": "datum.s0 / datum.total * 2 * PI", "as": "a0"},
          {"type": "formula", "expr": "datum.s1 / datum.total * 2 * PI", "as": "a1"}
        ]
      },
      {
        "name": "subs",
        "source": "leaves",
        "transform": [
          {
            "type": "aggregate",
            "groupby": ["category", "subcategory"],
            "fields": ["amount"],
            "ops": ["sum"],
            "as": ["amount"]
          },
          {"type": "collect", "sort": {"field": ["category", "subcategory"]}},
          {"type": "stack", "field": "amount", "as": ["s0", "s1"]},
          {"type": "joinaggregate", "fields": ["amount"], "ops": ["sum"], "as": ["total"]},
          {
            "type": "joinaggregate",
            "fields": ["amount"],
            "ops": ["sum"],
            "as": ["cat_total"],
            "groupby": ["category"]
          },
          {"type": "formula", "expr": "datum.s0 / datum.total * 2 * PI", "as": "a0"},
          {"type": "formula", "expr": "datum.s1 / datum.total * 2 * PI", "as": "a1"}
        ]
      },
      {
        "name": "cats",
        "source": "leaves",
        "transform": [
          {
            "type": "aggregate",
            "groupby": ["category"],
            "fields": ["amount"],
            "ops": ["sum"],
            "as": ["amount"]
          },
          {"type": "collect", "sort": {"field": "category"}},
          {"type": "stack", "field": "amount", "as": ["s0", "s1"]},
          {"type": "joinaggregate", "fields": ["amount"], "ops": ["sum"], "as": ["total"]},
          {"type": "formula", "expr": "datum.s0 / datum.total * 2 * PI", "as": "a0"},
          {"type": "formula", "expr": "datum.s1 / datum.total * 2 * PI", "as": "a1"}
        ]
      }
    ],
    "scales": [
      {
        "name": "color",
        "type": "ordinal",
        "domain": {"data": "cats", "field": "category"},
        "range": {"scheme": @{options.color_scheme.value}}
      }
    ],
    "marks": [
      {
        "type": "arc",
        "name": "catArc",
        "from": {"data": "cats"},
        "encode": {
          "update": {
            "x": {"signal": "width / 2"},
            "y": {"signal": "height / 2"},
            "startAngle": {"field": "a0"},
            "endAngle": {"field": "a1"},
            "innerRadius": {"signal": "holeR"},
            "outerRadius": {"signal": "ring1End"},
            "fill": {"scale": "color", "field": "category"},
            "fillOpacity": {
              "signal": "hovered === null || hovered.category === datum.category ? 1 : 0.3"
            },
            "stroke": {"value": "white"},
            "strokeWidth": {"value": 1.5},
            "tooltip": {
              "signal": "{'Category': datum.category, 'Value': format(datum.amount, ','), 'Share of Total': format(datum.amount / datum.total, '.1%')}"
            }
          }
        }
      },
      {
        "type": "arc",
        "name": "subArc",
        "from": {"data": "subs"},
        "encode": {
          "update": {
            "x": {"signal": "width / 2"},
            "y": {"signal": "height / 2"},
            "startAngle": {"field": "a0"},
            "endAngle": {"field": "a1"},
            "innerRadius": {"signal": "ring1End + 1"},
            "outerRadius": {"signal": "ring2End"},
            "fill": {"scale": "color", "field": "category"},
            "fillOpacity": {
              "signal": "hovered === null ? 0.85 : (hovered.category !== datum.category ? 0.2 : (hovered.subcategory === null ? 0.9 : (hovered.subcategory === datum.subcategory ? 1 : 0.5)))"
            },
            "stroke": {"value": "white"},
            "strokeWidth": {"value": 1.2},
            "tooltip": {
              "signal": "{'Subcategory': datum.subcategory, 'Category': datum.category, 'Value': format(datum.amount, ','), 'Share of Total': format(datum.amount / datum.total, '.1%'), 'Share of Category': format(datum.amount / datum.cat_total, '.1%')}"
            }
          }
        }
      },
      {
        "type": "arc",
        "name": "leafArc",
        "from": {"data": "leaves"},
        "encode": {
          "update": {
            "x": {"signal": "width / 2"},
            "y": {"signal": "height / 2"},
            "startAngle": {"field": "a0"},
            "endAngle": {"field": "a1"},
            "innerRadius": {"signal": "ring2End + 1"},
            "outerRadius": {"signal": "radius"},
            "fill": {"scale": "color", "field": "category"},
            "fillOpacity": {
              "signal": "hovered === null ? 0.65 : (hovered.category !== datum.category ? 0.15 : (hovered.kind === 'item' ? (hovered.label === datum.item ? 1 : 0.45) : (hovered.kind === 'subcategory' ? (hovered.subcategory === datum.subcategory ? 0.95 : 0.4) : 0.8)))"
            },
            "stroke": {"value": "white"},
            "strokeWidth": {"value": 1},
            "tooltip": {
              "signal": "{'Item': datum.item, 'Subcategory': datum.subcategory, 'Category': datum.category, 'Value': format(datum.amount, ','), 'Share of Total': format(datum.amount / datum.total, '.1%'), 'Share of Subcategory': format(datum.amount / datum.sub_total, '.1%')}"
            }
          }
        }
      },
      {
        "type": "text",
        "interactive": false,
        "encode": {
          "update": {
            "x": {"signal": "width / 2"},
            "y": {"signal": "height / 2 - 14"},
            "align": {"value": "center"},
            "text": {"signal": "hovered === null ? 'Total' : hovered.label"},
            "limit": {"signal": "holeR * 1.7"},
            "fontSize": {"value": 13},
            "fontWeight": {"value": 600},
            "fill": {"value": "#374151"},
            "opacity": {"signal": "holeR > 30 ? 1 : 0"}
          }
        }
      },
      {
        "type": "text",
        "interactive": false,
        "encode": {
          "update": {
            "x": {"signal": "width / 2"},
            "y": {"signal": "height / 2 + 8"},
            "align": {"value": "center"},
            "text": {"signal": "format(hovered === null ? grandTotal : hovered.amount, ',')"},
            "fontSize": {"value": 16},
            "fontWeight": {"value": 700},
            "fill": {"value": "#111827"},
            "opacity": {"signal": "holeR > 30 ? 1 : 0"}
          }
        }
      },
      {
        "type": "text",
        "interactive": false,
        "encode": {
          "update": {
            "x": {"signal": "width / 2"},
            "y": {"signal": "height / 2 + 28"},
            "align": {"value": "center"},
            "text": {"signal": "hovered === null ? '' : format(hovered.share, '.1%') + ' of total'"},
            "fontSize": {"value": 11},
            "fill": {"value": "#6b7280"},
            "opacity": {"signal": "holeR > 30 ? 1 : 0"}
          }
        }
      }
    ]
  };;
}
Required fields
The inner ring is level_1; each additional level radiates outward. A two-level chart takes three fields; the three-level variant takes four. Sort order on the dimension fields sets the angular order of slices within each ring.
Two-level variant:
| Field | Label | Type | Role |
|---|---|---|---|
level_1 | Level 1 | dimension | Inner ring (categories). Sorted ascending (apply_order: 1). |
level_2 | Level 2 | dimension | Outer ring (subcategories). Sorted ascending (apply_order: 2). |
value | Value | measure | Slice size. Sorted descending (apply_order: 3). |
Three-level variant:
| Field | Label | Type | Role |
|---|---|---|---|
level_1 | Level 1 | dimension | Inner ring (categories). Sorted ascending (apply_order: 1). |
level_2 | Level 2 | dimension | Middle ring (subcategories). Sorted ascending (apply_order: 2). |
level_3 | Level 3 | dimension | Outer ring (items). Sorted ascending (apply_order: 3). |
value | Value | measure | Slice size. Sorted descending (apply_order: 4). |
Data requirements: The template aggregates duplicate combinations and filters out null and non-positive values, so you don't need to pre-aggregate. Use positive values, since the template drops zero and negative rows before rendering.
Sample data:
The three-level variant uses all four columns. The two-level variant uses the same shape minus level_3.
| level_1 | level_2 | level_3 | value |
|---|---|---|---|
| Electronics | Phones | iPhone | 24000 |
| Electronics | Phones | Android | 18000 |
| Electronics | Laptops | MacBook | 20000 |
| Electronics | Laptops | Windows | 11000 |
| Apparel | Shirts | T-shirt | 10000 |
| Apparel | Shirts | Polo | 8000 |
Options
Set these options to adjust the chart without editing the Vega template. The CustomChartDef block above declares each option's type and allowed values. Both variants share the same options.
| Option | Default | Effect |
|---|---|---|
color_scheme | tableau10 | Ordinal color palette applied to Level 1 categories. All child rings inherit their parent category's color. |
donut_hole | 0.35 | Center hole radius as a fraction of the total radius. 0 renders a full pie; 0.5 is a large donut. |
Known limitations
-
Two and three levels only. The provided templates handle 2-3 rings. Readability degrades past that, and deeper hierarchies need extra data sources and arc marks added to the template.
-
Arc angles are hard to compare precisely. Sunburst shows composition well but not fine-grained size comparison. Use a bar or treemap chart when exact comparison matters.
-
Color follows Level 1. Every ring inherits its top-level category color, so you cannot encode a second field through color without editing the template.