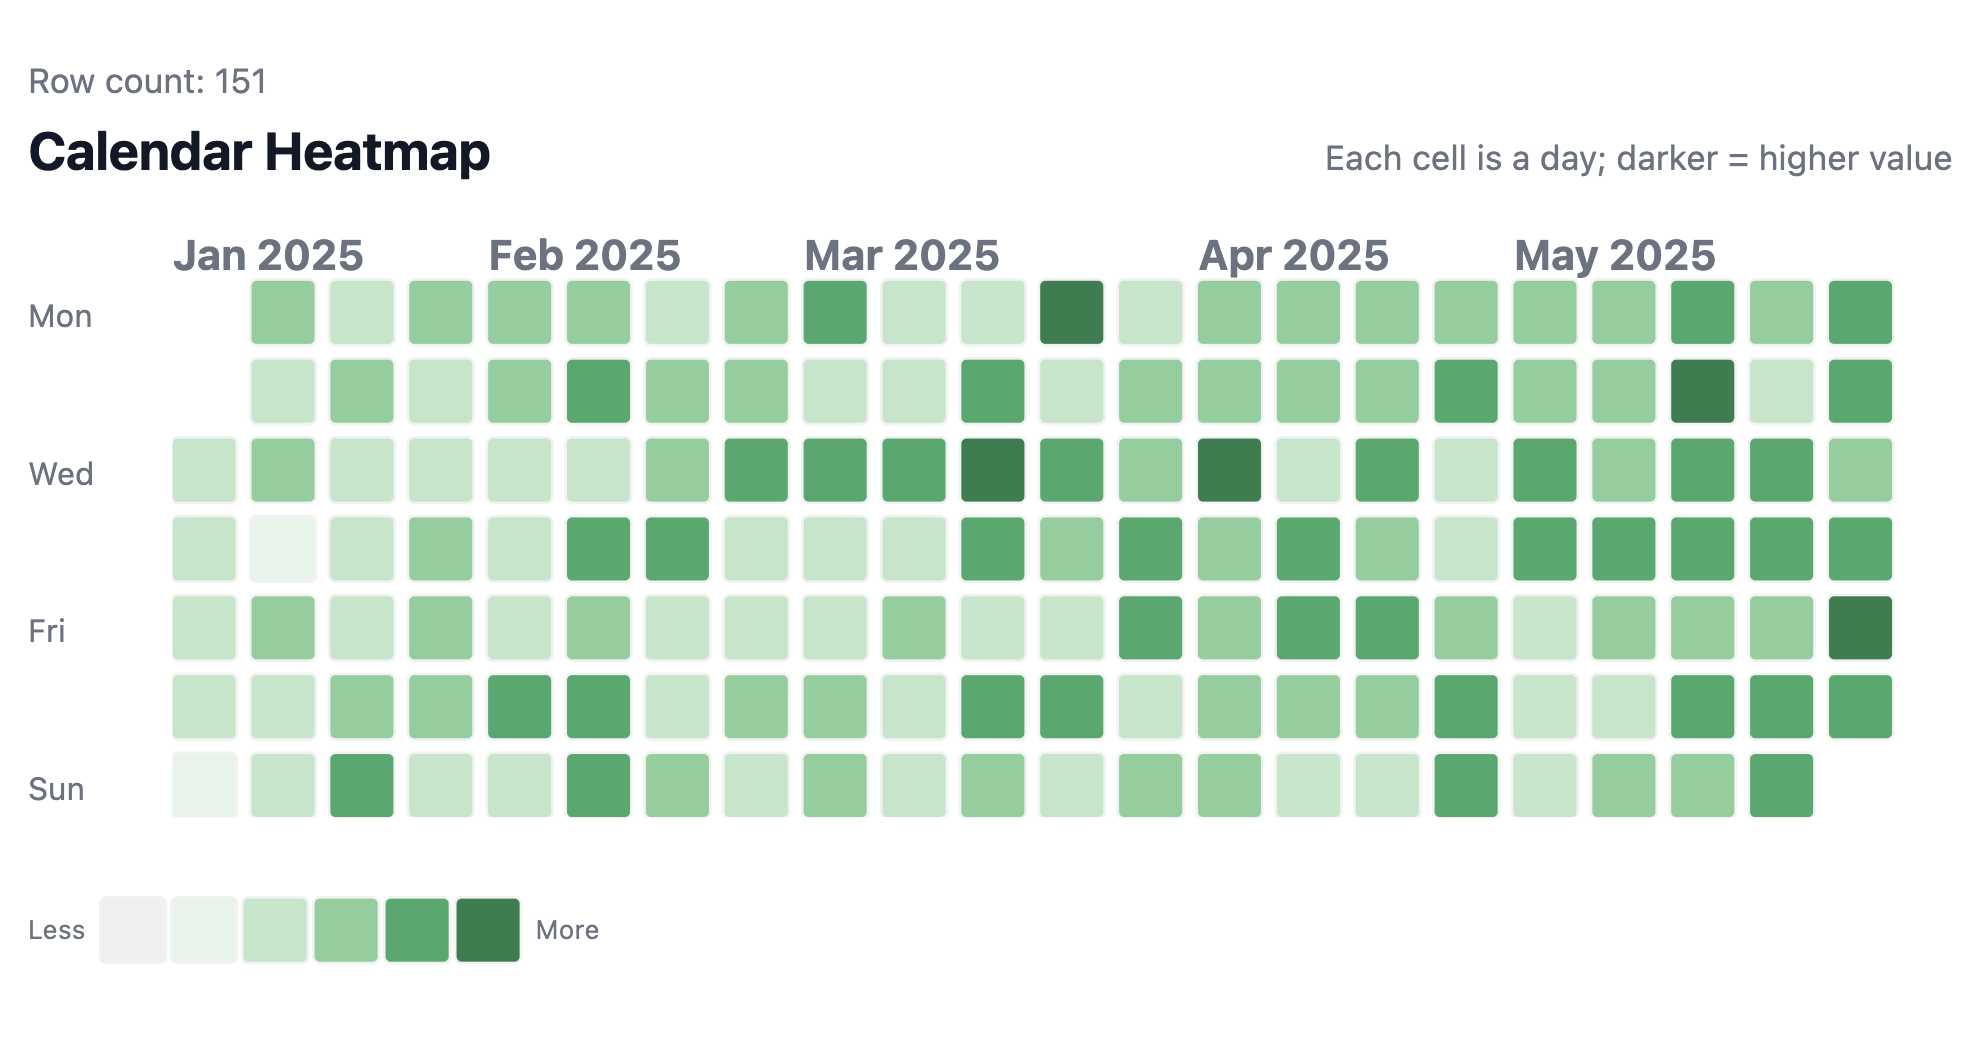
Calendar Heatmap
A GitHub-style calendar heatmap that maps daily values onto a week-by-day grid with color intensity, perfect for spotting patterns across days and weeks.
Best for: Daily activity tracking, revenue patterns, engagement monitoring, contribution graphs
Key techniques: map(rows) loop, CSS Grid with dynamic grid-column/grid-row positioning, color buckets for intensity levels
Template Code
<style>
.hm {
--cell: 24px;
--gap: 6px;
--label-w: 45px;
font-family: ui-sans-serif, system-ui, -apple-system, Segoe UI, Roboto, Helvetica, Arial;
color: #111827;
--label-color: #6b7280;
}
.hm__scroller {
overflow-x: auto;
width: 100%;
}
.hm__header {
display: flex;
align-items: baseline;
justify-content: space-between;
gap: 24px;
margin: 0 0 10px 0;
}
.hm__title { font-size: 20px; font-weight: 700; margin: 0; }
.hm__subtitle { font-size: 13px; color: #6b7280; margin: 0; white-space: nowrap; }
.hm__wrap {
display: grid;
grid-template-columns: var(--label-w) auto;
gap: 10px;
align-items: start;
}
.hm__ylabels {
display: grid;
grid-template-rows: 13px repeat(7, var(--cell));
row-gap: var(--gap);
align-items: center;
user-select: none;
}
.hm__ylabels .spacer { height: 18px; }
.hm__ylabels .ylabel { font-size: 12px; color: var(--label-color); line-height: 1; }
/* Month labels row */
.hm__months {
display: grid;
grid-template-columns: repeat(60, var(--cell));
column-gap: var(--gap);
height: 18px;
align-items: end;
width: max-content;
}
.hm__month {
font-size: 16px;
font-weight: bold;
color: var(--label-color);
line-height: 1;
padding-bottom: 10px;
white-space: nowrap;
user-select: none;
pointer-events: none;
}
/* Heatmap grid */
.hm__grid {
display: grid;
grid-template-columns: repeat(60, var(--cell));
grid-template-rows: repeat(7, var(--cell));
column-gap: var(--gap);
row-gap: var(--gap);
width: max-content;
min-width: 2000px;
}
.hm__cell {
width: var(--cell);
height: var(--cell);
border-radius: 2px;
background: rgba(0,0,0,0.06);
outline: 1px solid rgba(0,0,0,0.05);
position: relative;
}
.hm__cell.lvl-0 { background: rgba(0,0,0,0.06); }
.hm__cell.lvl-1 { background: #e5f4e9; }
.hm__cell.lvl-2 { background: #bfe6c9; }
.hm__cell.lvl-3 { background: #86cf9a; }
.hm__cell.lvl-4 { background: #39a96b; }
.hm__cell.lvl-5 { background: #1f7f4d; }
.hm__cell:hover::after {
content: attr(data-tip);
position: absolute;
bottom: 120%;
left: 50%;
transform: translateX(-50%);
background: white;
color: #111827;
font-size: 11px;
padding: 4px 6px;
border-radius: 4px;
white-space: nowrap;
pointer-events: none;
z-index: 10;
}
.hm__legend {
display: flex;
align-items: center;
gap: 6px;
margin-top: 30px;
font-size: 10px;
color: var(--label-color);
}
.hm__legend-swatches { display: inline-flex; align-items: center; gap: 3px; }
.hm__swatch { width: var(--cell); height: var(--cell); border-radius: 2px; outline: 1px solid rgba(0,0,0,0.05); }
.hm__swatch.lvl-0 { background: rgba(0,0,0,0.06); }
.hm__swatch.lvl-1 { background: #e5f4e9; }
.hm__swatch.lvl-2 { background: #bfe6c9; }
.hm__swatch.lvl-3 { background: #86cf9a; }
.hm__swatch.lvl-4 { background: #39a96b; }
.hm__swatch.lvl-5 { background: #1f7f4d; }
</style>
<div class="hm">
<div class="hm__header">
<p class="hm__title">Calendar Heatmap</p>
<p class="hm__subtitle">Each cell is a day; darker = higher value</p>
</div>
<div class="hm__wrap">
<div class="hm__ylabels">
<div class="spacer"></div>
<div class="ylabel">Mon</div>
<div class="ylabel"></div>
<div class="ylabel">Wed</div>
<div class="ylabel"></div>
<div class="ylabel">Fri</div>
<div class="ylabel"></div>
<div class="ylabel">Sun</div>
</div>
<div>
<div class="hm__scroller">
<!-- Month labels -->
<div class="hm__months">
{% map(rows) %}
<div
class="hm__month"
style="grid-column: {{ `Week Index`.formatted }}; display: {{ `Month Label Display`.raw }};">
{{ `Month Label` }}
</div>
{% end %}
</div>
<!-- Cells -->
<div class="hm__grid">
{% map(rows) %}
<div
class="hm__cell lvl-{{ values.`Color Bucket`.formatted }}"
style="grid-column: {{ `Week Index`.formatted }}; grid-row: {{ `Day Of Week`.formatted }};"
data-tip="{{ `Date`.formatted }} • {{ values.`Revenue`.formatted }}"
></div>
{% end %}
</div>
</div>
</div>
</div>
<div class="hm__legend">
<span>Less</span>
<span class="hm__legend-swatches">
<span class="hm__swatch lvl-0"></span>
<span class="hm__swatch lvl-1"></span>
<span class="hm__swatch lvl-2"></span>
<span class="hm__swatch lvl-3"></span>
<span class="hm__swatch lvl-4"></span>
<span class="hm__swatch lvl-5"></span>
</span>
<span>More</span>
</div>
</div>
How It Works
Each day is one row in your dataset. The template uses CSS Grid to place cells by their Week Index (column) and Day Of Week (row), creating the familiar calendar layout. Color intensity comes from a Color Bucket field (0-5) that you compute in your data query by normalizing values against the maximum.
Layout structure:
- A month labels row uses the same grid columns as the heatmap, but only shows a label on the first day of each month (controlled by
Month Label Display) - The heatmap grid places each cell at the correct week column and day-of-week row
- Day-of-week labels (Mon, Wed, Fri) sit in a fixed column to the left
- The whole grid scrolls horizontally for multi-month ranges
Hover tooltips are built with a CSS ::after pseudo-element reading from the data-tip attribute. No JavaScript needed.
Required Data Fields
| Field | Type | Slot | Description |
|---|---|---|---|
Date | Dimension | Row | Date truncated to day |
Day Of Week | Dimension | Row | Integer 1-7 (Mon-Sun) |
Week Index | Dimension | Row | Continuous week number across the date range |
Month Label | Dimension | Row | Month name (e.g., "Jan 2025") |
Month Label Display | Dimension | Row | CSS display value: block for 1st of month, none otherwise |
Revenue | Measure | Value | The metric to visualize (any numeric value) |
Color Bucket | Measure | Value | Integer 0-5 for color intensity level |
Preparing the Calculated Fields
The Day Of Week, Week Index, Month Label Display, and Color Bucket fields need to be created as calculations. Here's an example using AML:
// Day of week (1 = Mon, 7 = Sun)
calculation day_of_week {
  label: 'Day Of Week'
  formula: @aql cast(date_part('dow', orders.created_at) + 1, 'int');;
  calc_type: 'dimension'
  data_type: 'number'
}

// Continuous week index
calculation week_index {
  label: 'Week Index'
  formula: @aql cast(date_part('week', orders.created_at), 'int');;
  calc_type: 'dimension'
  data_type: 'number'
}

// Show month label only on first day of each month
calculation month_label_display {
  label: 'Month Label Display'
  formula: @aql case(
    when: date_part('day', orders.created_at) == 1, then: 'block',
    else: 'none'
  );;
  calc_type: 'dimension'
  data_type: 'text'
}

// Normalize value into 0-5 buckets using window_max
calculation color_bucket {
  label: 'Color Bucket'
  formula: @aql case(
    when: sales_model.revenue == 0, then: 0,
    when: (sales_model.revenue * 1.0) / window_max(sales_model.revenue) < 0.2, then: 1,
    when: (sales_model.revenue * 1.0) / window_max(sales_model.revenue) < 0.4, then: 2,
    when: (sales_model.revenue * 1.0) / window_max(sales_model.revenue) < 0.6, then: 3,
    when: (sales_model.revenue * 1.0) / window_max(sales_model.revenue) < 0.8, then: 4,
    else: 5
  );;
  calc_type: 'measure'
  data_type: 'number'
}
Important Settings
- Pagination size must exceed total rows (e.g., set to 1000+ for a full year of data). If pagination is too low, only the first page of days will render and later months will be missing.
- Sort by Date ascending so days appear in the correct order.
- Number formatting for
Day Of WeekandWeek Indexshould useinherited(no decimal places) since they're used for CSS grid positioning.
Customization Tips
Change the color scheme
Replace the .lvl-* background colors to match your brand. For example, a blue scheme:
.hm__cell.lvl-1 { background: #dbeafe; }
.hm__cell.lvl-2 { background: #93c5fd; }
.hm__cell.lvl-3 { background: #60a5fa; }
.hm__cell.lvl-4 { background: #2563eb; }
.hm__cell.lvl-5 { background: #1d4ed8; }
Remember to update the .hm__swatch legend colors to match.
Adjust grid size
Change the --cell and --gap CSS variables to make cells larger or smaller:
.hm {
  --cell: 18px;  /* smaller cells */
  --gap: 4px;    /* tighter spacing */
}
Extend to a full year
The grid defaults to repeat(60, ...) columns which fits ~14 months. For a full year, 53 columns is sufficient. If you need more, increase the repeat count and the min-width on .hm__grid.
Add more color buckets
You can increase granularity by adding more levels (e.g., lvl-6 through lvl-9) and adjusting the bucket calculation thresholds accordingly.