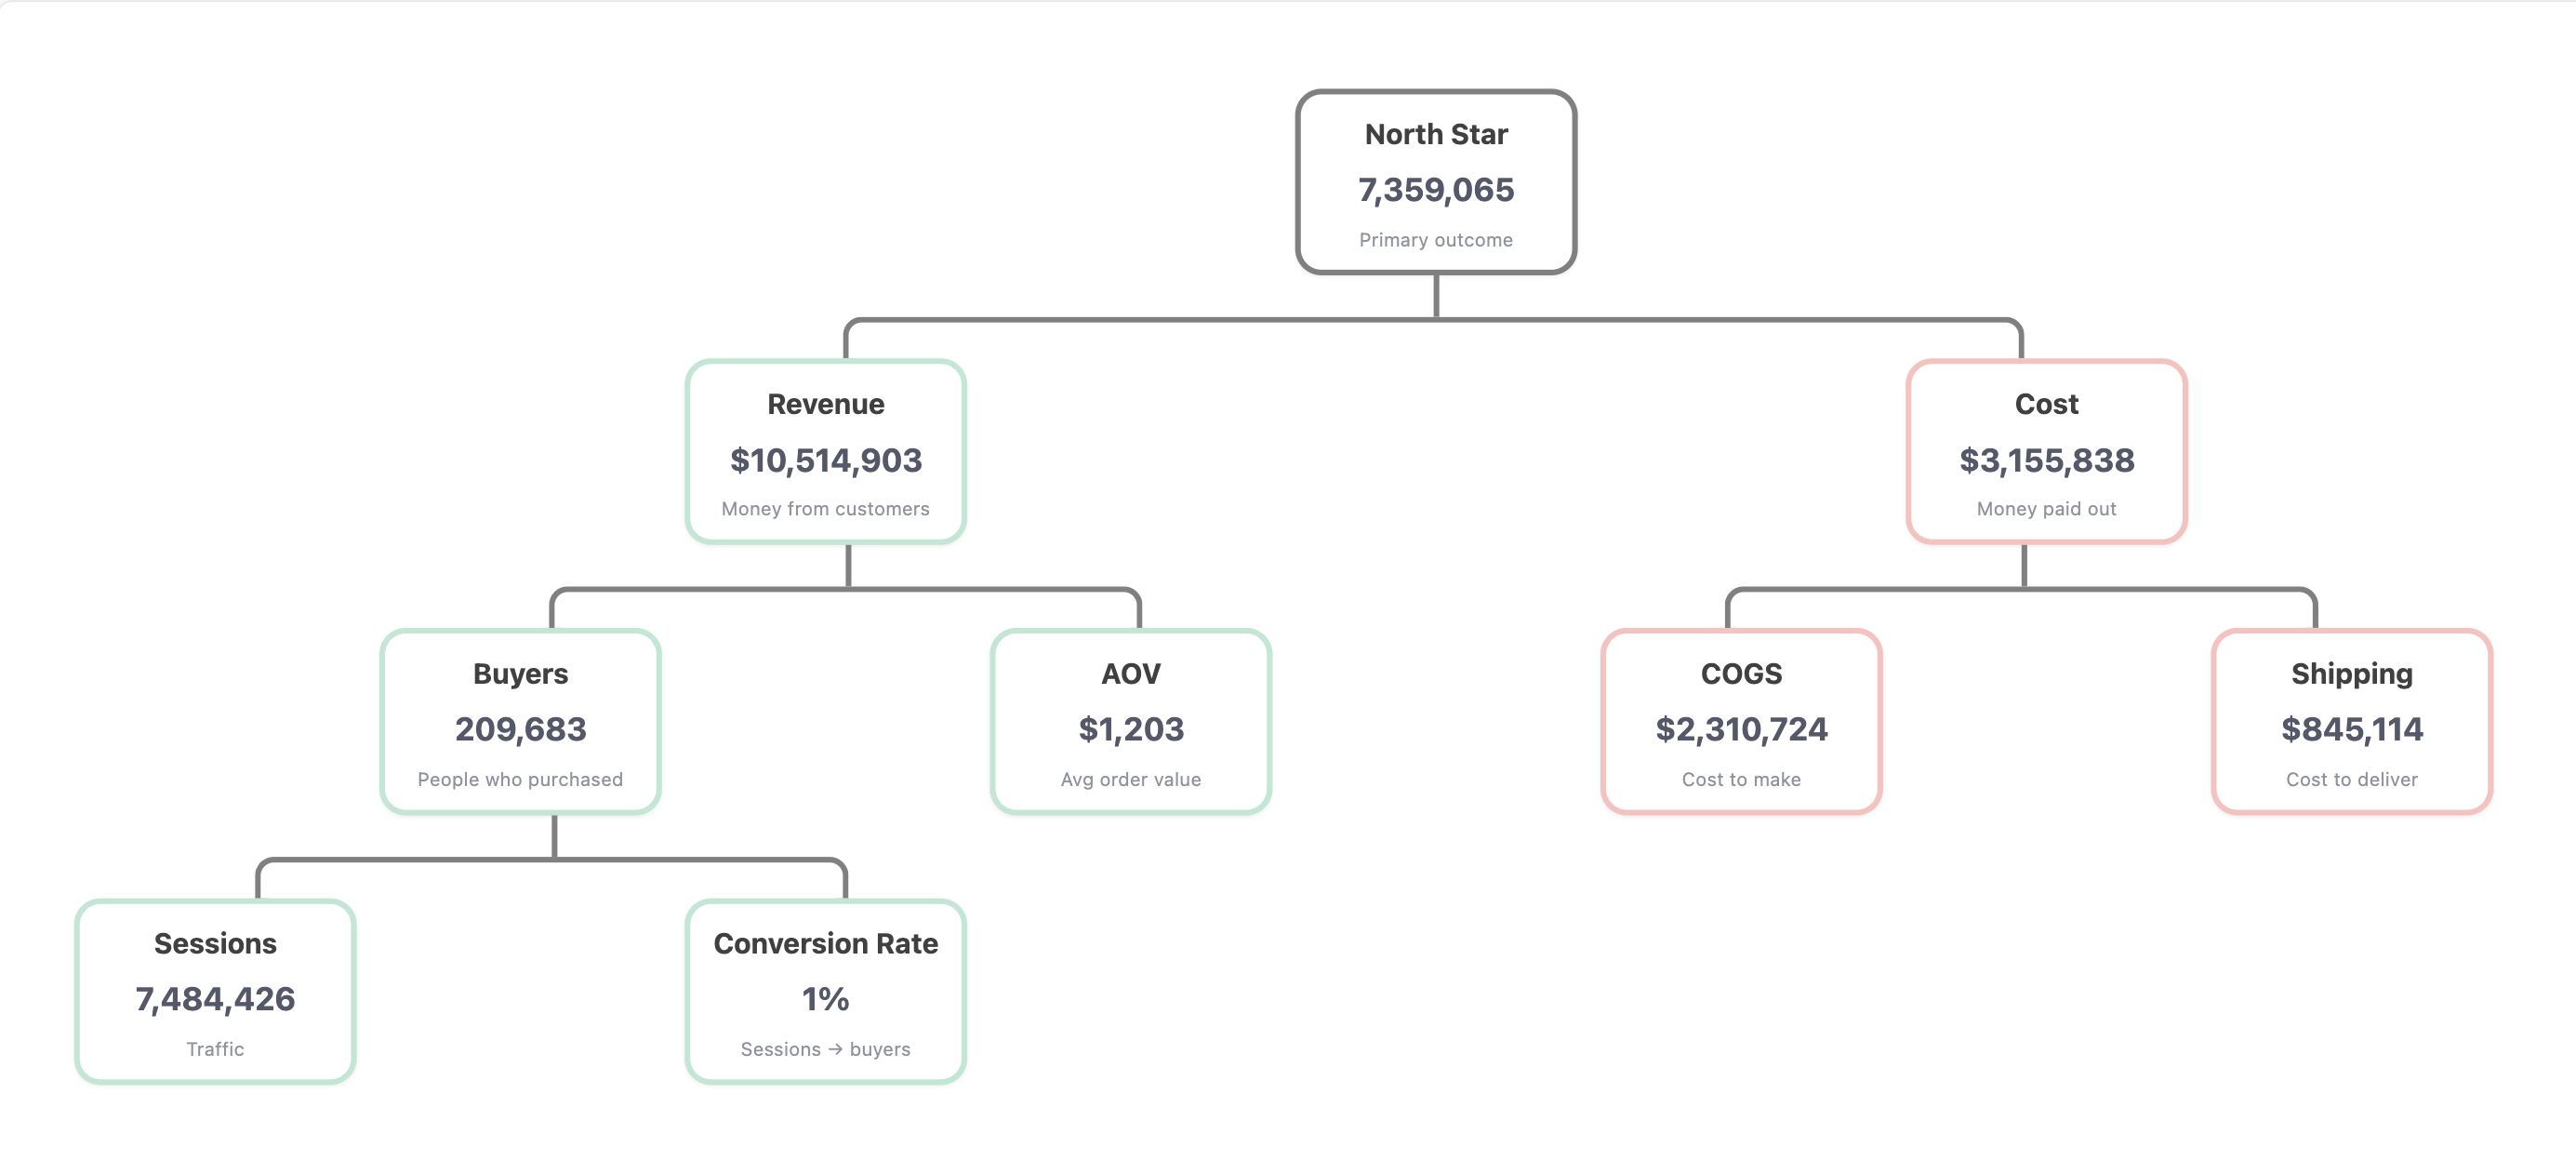
Metrics Tree
Visualize how your metrics break down from a North Star into its underlying drivers. Makes metric dependencies and relationships easy to scan for your whole team.
Best for: KPI decomposition, metric dependency mapping, business driver analysis
Key techniques: col_totals for aggregated values, CSS Grid multi-level layout, pseudo-element connectors
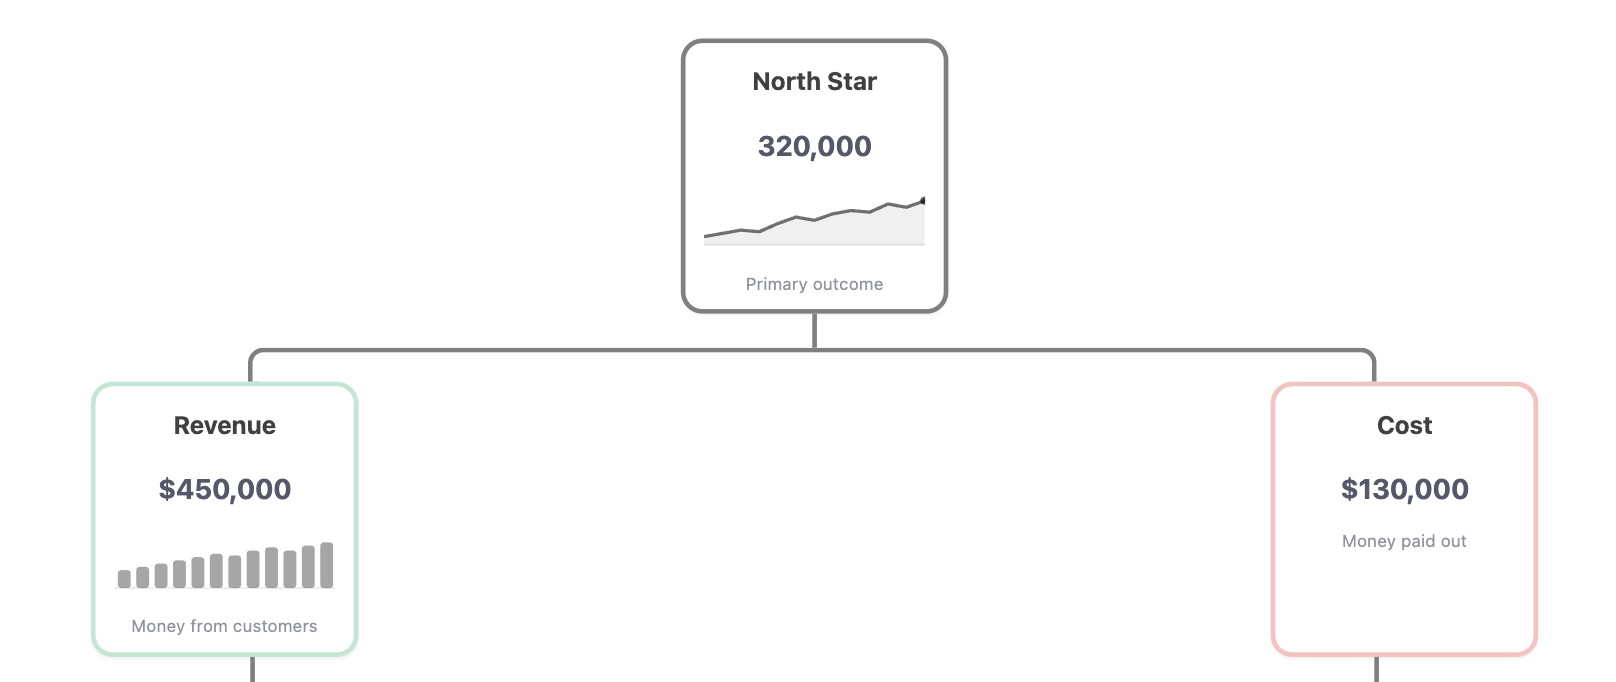
We're working on a sparkline component that will let you embed inline trend charts inside each node. Once available, you'll be able to show how each metric is trending right alongside its current value.
Template Code
<style>
  .metric-tree-v1 {
    /* Tree width cap to avoid node stretching */
    width: 1350px;
    --tree-pd-left: 160px;
    --tree-pd-right: 10px;
    margin: 0 auto;

    /* Responsive sizing */
    --node-w: clamp(100px, 12vw, 150px);
    --gap: clamp(6px, 2vw, 12px);

    /* Derived layout */
    --double-w: calc(var(--node-w) * 2 + var(--gap));

    /* Connectors */
    --line-color: grey;
    --line-w: 3px;
    --line-r: 10px;
    --line-h: clamp(34px, 4vw, 44px);
    --node-border-w: 3px;
    padding: 10px var(--tree-pd-right) 10px var(--tree-pd-left);
    display: flex;
    flex-direction: column;
    align-items: center;
    box-sizing: border-box;
    font-family: ui-sans-serif, system-ui, -apple-system, Segoe UI, Roboto, Helvetica, Arial;
  }

  /* Levels */
  .metric-tree-v1 .level {
    display: grid;
    gap: var(--gap);
    justify-content: center;
    width: 100%;
    box-sizing: border-box;
  }
  .metric-tree-v1 .level-1 {
    grid-template-columns: var(--double-w);
  }
  .metric-tree-v1 .level-2 {
    grid-template-columns: repeat(3, var(--double-w));
  }
  .metric-tree-v1 .level-3 {
    grid-template-columns: repeat(4, var(--double-w));
  }
  .metric-tree-v1 .level-4 {
    grid-template-columns: repeat(5, var(--double-w));
  }

  /* Connector rows */
  .metric-tree-v1 .lines {
    display: grid;
    justify-content: center;
    width: 100%;
    box-sizing: border-box;
  }
  .metric-tree-v1 .lines-1 {
    grid-template-columns: calc(var(--double-w) * 2);
  }
  .metric-tree-v1 .lines-2 {
    grid-template-columns: repeat(3, var(--double-w));
  }
  .metric-tree-v1 .lines-3 {
    grid-template-columns: repeat(4, var(--double-w));
  }
  .metric-tree-v1 .line {
    height: var(--line-h);
    position: relative;
  }
  .metric-tree-v1 .line:before {
    content: "";
    width: var(--line-w);
    height: 50%;
    background: var(--line-color);
    position: absolute;
    left: calc(50% - var(--line-w) / 2);
    top: 0;
  }
  .metric-tree-v1 .line:after {
    content: "";
    position: absolute;
    left: calc(var(--line-w) * -1);
    bottom: 0;
    width: calc(100% + var(--line-w));
    height: 50%;
    border-style: solid;
    border-color: var(--line-color);
    border-width: var(--line-w) var(--line-w) 0 var(--line-w);
    border-radius: var(--line-r) var(--line-r) 0 0;
    box-sizing: border-box;
  }

  /* KPI card */
  .metric-tree-v1 .node {
    width: var(--node-w);
    margin: 0 auto;
    padding: 12px 12px 10px;
    border: var(--node-border-w) solid grey;
    border-radius: 14px;
    background: #fff;
    box-shadow: 0 1px 2px rgba(0, 0, 0, 0.06);
    display: flex;
    flex-direction: column;
    gap: 2px;
  }
  .metric-tree-v1 .label {
    font-size: 15px;
    opacity: 0.75;
    text-align: center;
    padding: 0;
    margin: 0;
    line-height: 1.2;
    color: black;
  }
  .metric-tree-v1 .value {
    font-size: 17px;
    font-weight: 700;
    text-align: center;
    margin: 0 !important;
    line-height: 1.1;
  }
  .metric-tree-v1 .metric-subtext {
    font-size: 10px;
    opacity: 0.65;
    text-align: center;
    margin: 0 !important;
    line-height: 1.2;
  }
  .metric-tree-v1 .empty {
    width: var(--node-w);
  }

  /* Optional accents */
  .metric-tree-v1 .pos {
    border-color: rgba(16, 185, 129, 0.35);
  }
  .metric-tree-v1 .neg {
    border-color: rgba(239, 68, 68, 0.35);
  }
</style>

<div class="metric-tree-v1">
  <div class="level level-1">
    <article class="node">
      <p class="label">North Star</p>
      <p class="value">{{ col_totals.`North Star`.formatted }}</p>
      <p class="metric-subtext">Primary outcome</p>
    </article>
  </div>

  <div class="lines lines-1"><div class="line"></div></div>

  <div class="level level-2">
    <article class="node pos">
      <p class="label">Revenue</p>
      <p class="value">{{ col_totals.`Revenue` }}</p>
      <p class="metric-subtext">Money from customers</p>
    </article>
    <div class="empty"></div>
    <article class="node neg">
      <p class="label">Cost</p>
      <p class="value">{{ col_totals.`Cost` }}</p>
      <p class="metric-subtext">Money paid out</p>
    </article>
  </div>

  <div class="lines lines-2">
    <div class="line"></div>
    <div class="empty"></div>
    <div class="line"></div>
  </div>

  <div class="level level-3">
    <article class="node pos">
      <p class="label">Buyers</p>
      <p class="value">{{ col_totals.`Buyers` }}</p>
      <p class="metric-subtext">People who purchased</p>
    </article>
    <article class="node pos">
      <p class="label">AOV</p>
      <p class="value">{{ col_totals.`Aov` }}</p>
      <p class="metric-subtext">Avg order value</p>
    </article>
    <article class="node neg">
      <p class="label">COGS</p>
      <p class="value">{{ col_totals.`Cogs` }}</p>
      <p class="metric-subtext">Cost to make</p>
    </article>
    <article class="node neg">
      <p class="label">Shipping</p>
      <p class="value">{{ col_totals.`Shipping` }}</p>
      <p class="metric-subtext">Cost to deliver</p>
    </article>
  </div>

  <div class="lines lines-3"><div class="line"></div></div>

  <div class="level level-4">
    <article class="node pos">
      <p class="label">Sessions</p>
      <p class="value">{{ col_totals.`Sessions` }}</p>
      <p class="metric-subtext">Traffic</p>
    </article>
    <article class="node pos">
      <p class="label">Conversion Rate</p>
      <p class="value">{{ col_totals.`Conversion Rate` }}</p>
      <p class="metric-subtext">Sessions → buyers</p>
    </article>
  </div>
</div>
How It Works
The tree is built with pure CSS Grid. No JavaScript needed. Each level is a grid row, and connector lines between levels are drawn using CSS pseudo-elements (:before and :after).
Layout structure:
- Each level (
level-1throughlevel-4) is a CSS Grid with a set number of columns - Between levels, a
.linesrow draws the branching connectors - Empty
.emptydivs act as spacers to position nodes correctly under their parent
Data access:
- All values use
col_totalsto pull aggregated totals across the entire dataset - This means the tree shows a single rolled-up number per metric, not row-by-row data
Required Data Fields
| Field | Type | Slot | Description |
|---|---|---|---|
Month | Dimension | Row | Time dimension for aggregation |
North Star | Measure | Value | Top-level metric (e.g., Profit) |
Revenue | Measure | Value | Revenue metric |
Cost | Measure | Value | Total cost metric |
Buyers | Measure | Value | Number of buyers |
Aov | Measure | Value | Average order value |
Cogs | Measure | Value | Cost of goods sold |
Shipping | Measure | Value | Shipping costs |
Sessions | Measure | Value | Number of sessions |
Conversion Rate | Measure | Value | Sessions-to-buyers conversion rate |
Setting Up the Block
In the Visualization Block definition, add the time dimension as a Row field and all metrics as Value fields with aggregation: 'sum'. Enable Show Column Total in the block settings. the template reads from col_totals to display the aggregated values.
Sample Data
Import this data into Holistics to use: sample-data-metrics-tree.csv
Month,North Star,Revenue,Cost,Buyers,AOV,COGS,Shipping,Sessions,Conversion Rate
2024-01,245149,352188,107039,7322,48.1,79692,27347,239226,0.0306
2024-02,265628,382769,117141,7996,47.87,86680,30461,262095,0.0305
2024-03,299244,431517,132273,9020,47.84,97050,35223,290974,0.031
2024-04,335063,482296,147233,9769,49.37,107089,40144,318913,0.0306
2024-05,342112,490557,148445,9774,50.19,107249,41196,339084,0.0288
2024-06,343323,489927,146604,9597,51.05,105620,40984,346630,0.0277
2024-07,320203,454882,134679,8921,50.99,97219,37460,340021,0.0262
2024-08,293177,415243,122066,8038,51.66,88673,33393,321534,0.025
2024-09,274734,388849,114115,7574,51.34,83640,30475,296710,0.0255
2024-10,250143,354674,104531,7061,50.23,77305,27226,272909,0.0259
2024-11,239129,340346,101217,6811,49.97,75343,25874,257353,0.0265
2024-12,250370,358061,107691,7203,49.71,80355,27336,255162,0.0282
Customization Tips
Adapt the tree to your metrics
This template uses an e-commerce profit tree as an example, but you can adapt it to any metric hierarchy. Replace the metric names, labels, and subtexts to match your business:
- SaaS: MRR → New MRR + Expansion - Churn → Leads × Conversion Rate
- Marketplace: GMV → Buyers × AOV → Traffic × Conversion × Average Basket
- Content: Engagement → Views × Time on Page → Impressions × CTR
Change node colors
The .pos and .neg classes add green and red accent borders. Adjust the colors or add new classes:
.metric-tree-v1 .pos {
  border-color: rgba(16, 185, 129, 0.35); /* green */
}
.metric-tree-v1 .neg {
  border-color: rgba(239, 68, 68, 0.35);  /* red */
}
/* Add a neutral accent */
.metric-tree-v1 .neutral {
  border-color: rgba(59, 130, 246, 0.35);  /* blue */
}
Add or remove levels
To add a 5th level, create a new .level-5 grid rule and a .lines-4 connector row:
.metric-tree-v1 .level-5 {
  grid-template-columns: repeat(6, var(--double-w));
}
.metric-tree-v1 .lines-4 {
  grid-template-columns: repeat(5, var(--double-w));
}
Then add the corresponding HTML for the new nodes and connectors.
Adjust node sizing
The node width is controlled by a single CSS variable. Change the clamp() values to make nodes wider or narrower:
--node-w: clamp(100px, 12vw, 150px); /* min, preferred, max */