From Tableau to Holistics
This comparison was last reviewed in June 2026. It compares Holistics with the classic Tableau experience in Tableau 2026.2: Tableau Desktop and Tableau Cloud/Web Authoring, including Tableau data sources, worksheets, dashboards, and publishing to Tableau Cloud or Tableau Server.
It does not use Tableau Next as the main baseline. Tableau Pulse, Tableau Next, and Tableau Semantics are mentioned only where they affect the conceptual comparison.
Concept mapping
If you are coming from Tableau, the biggest shift is that Holistics treats the semantic layer as a first-class part of the BI workflow.
This page maps familiar Tableau concepts to Holistics and gives you a practical migration path.
- Tableau 2026.2: workbook-first dashboard authoring
- Holistics: semantic-layer-first dashboard authoring
- Connect to data
- Prepare Tableau data source
- Build worksheets /views
- Assemble dashboard
- Connect SQL warehouse
- Define models and metrics
- Curate dataset
- Explore and build charts
- Build Canvas dashboard
- tableau-connect → tableau-data-source
- tableau-data-source → tableau-worksheets (field pills)
- tableau-worksheets → tableau-dashboard (sheets become / dashboard objects)
- holistics-connect → holistics-models
- holistics-models → holistics-dataset (reusable / semantic layer)
- holistics-dataset → holistics-explore
- holistics-explore → holistics-dashboard (save as / blocks)
Core mapping:
- Tableau data source → Holistics data source + models + dataset
- Tableau worksheet/view → Holistics exploration or visualization block
- Tableau dashboard → Holistics Canvas dashboard
| Tableau artifact | Holistics equivalent | Key difference |
|---|---|---|
| Workbook | Models, datasets, explorations, and Canvas dashboards | Tableau packages these together. Holistics keeps them as separate reusable project objects. |
| Connector / connection | Data source | Tableau supports many file, app, and database connectors. Holistics focuses on SQL data sources. |
| Data source | Data source + model + dataset | Tableau data sources can hold relationships, calculations, metadata, and extracts. Holistics splits these layers. |
| Extract / Tableau Prep | Query cache, persisted model, dbt/warehouse SQL, or query model | Holistics usually pushes work to the warehouse instead of copying data into a BI engine. |
| Logical / physical table | Model, query model, or upstream dbt/SQL model | Holistics models sit on top of warehouse tables or SQL queries. |
| Relationship / join canvas | Dataset relationship | Holistics declares relationships in datasets and compiles joins at query time. |
| Calculated field | Dimension, measure, or metric | Model reusable business logic once; keep one-off display logic in the chart. |
| Worksheet / view | Exploration or visualization block | Tableau builds worksheets first. Holistics builds charts from governed datasets. |
| Shelves / Marks card | Visualization fields, filters, and settings | Similar drag-and-configure flow, but fields resolve through the Holistics dataset. |
| Dashboard | Canvas dashboard | Both compose charts and controls. Holistics dashboards are code-reviewable AMQL. |
| Parameter | Parameter field | Both carry user input into queries and field definitions to make charts dynamic. |
| Action | Dashboard action | Both trigger row-level workflows. Holistics actions currently target Data Table visualizations via Go To URL. |
| Pulse / Next semantic model | Metric, Holistics AI, and semantic layer | Not the baseline for this page, but closest to Holistics's semantic-layer direction. |
Migrating from Tableau to Holistics
A Tableau migration has two jobs:
- Move reusable data logic out of Tableau workbooks/data sources.
- Rebuild charts and dashboards on top of a governed Holistics semantic layer.
Start with shared definitions, not a worksheet-by-worksheet copy.
Do not migrate every Tableau object literally. Hidden helper worksheets, one-off groups, and layout workarounds often become cleaner as Holistics metrics, dimensions, filters, or interactions.
Holistics works with SQL databases. If a Tableau workbook depends on extracts, file uploads, Tableau Prep outputs, or application connectors, first land that data in your data warehouse.
1. Inventory Tableau content
Start with dashboards people actually use. For each workbook, capture:
- Data sources and live/extract mode.
- Relationships, joins, unions, and custom SQL.
- Visible and hidden worksheets.
- Calculated fields, parameters, sets, groups, bins, table calculations, and level-of-detail calculations.
- Dashboard filters, actions, tooltips, subscriptions, alerts, and permissions.
Use Tableau Catalog or the Metadata API if available. Still review important dashboards manually; usage context often reveals which calculations are truly business-critical.
2. Move data into data warehouse
Before modeling in Holistics, make sure the data is available in a SQL data source:
- Move extract-backed tables, file uploads, and app-connector data into your data warehouse.
- Reuse existing warehouse tables if the Tableau workbook already points to a SQL database.
- Connect Holistics to the data source and confirm schema access.
3. Move prep upstream
Move production transformations out of Tableau where possible:
- Use dbt or warehouse SQL jobs for shared transformations.
- Use table models for reporting-ready warehouse tables.
- Use query models for lightweight reusable SQL on top of existing tables or models.
If you already use dbt, keep transformations there and connect Holistics to the dbt-modeled tables. See when to model in dbt vs. Holistics for the split.
4. Model and curate datasets
For the semantic layer:
- Create a data model for each source table or query output.
- Add labels, descriptions, field types, formatting, hidden fields, dimensions, and measures.
- Choose one business-friendly name when multiple Tableau workbooks renamed the same field differently.
- Define relationships inside datasets.
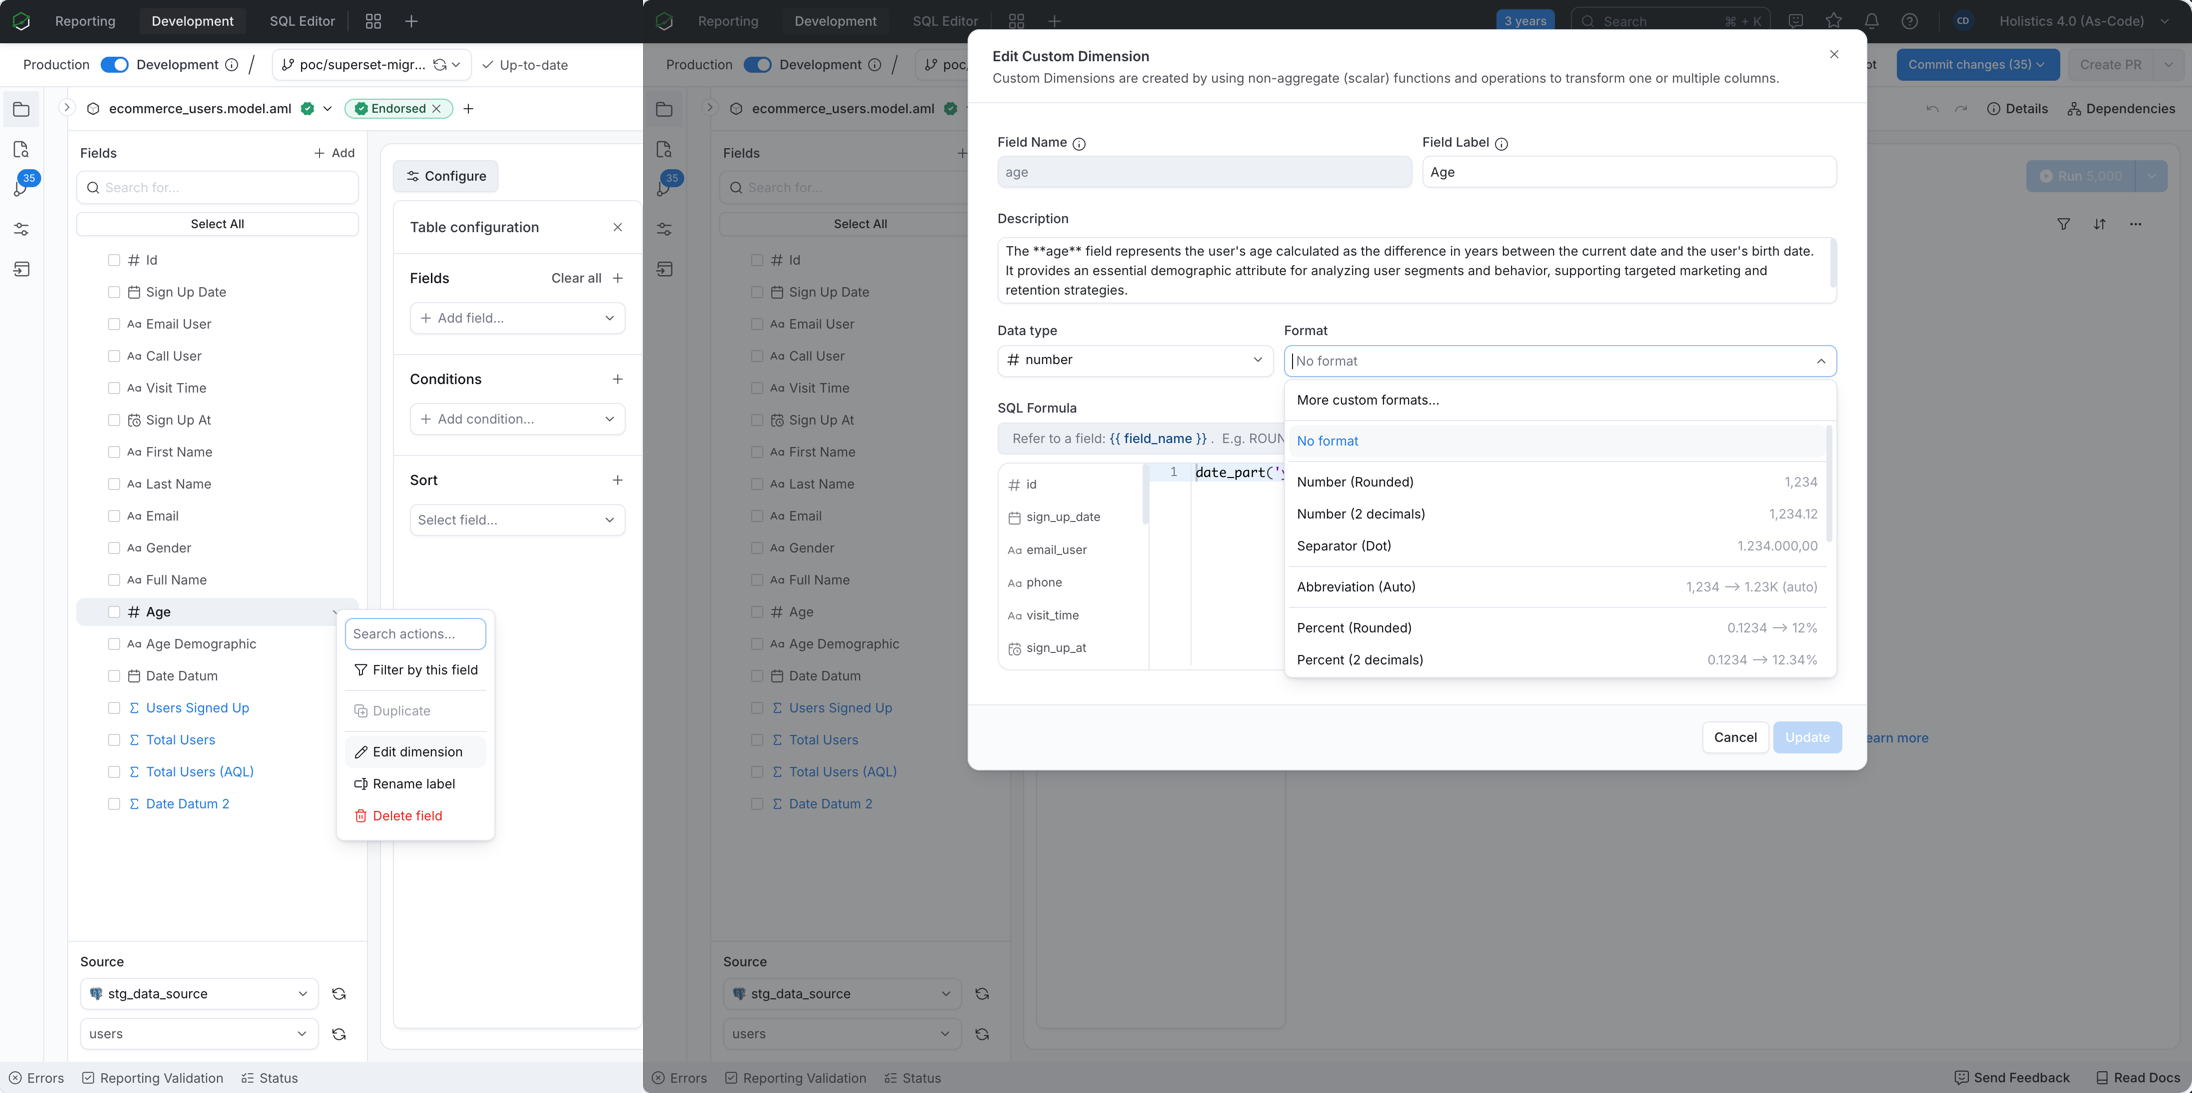
If a Tableau workbook used field formatting, apply the same formatting on the Holistics field so values read consistently across dashboards:
5. Translate calculations
Map each Tableau calculation by intent:
| Tableau pattern | Holistics destination |
|---|---|
| Row-level logic | Custom dimension |
| Simple aggregation | Measure or dataset metric |
| Reusable KPI | Dataset metric, usually in AQL |
| Cross-model, period comparison, nested aggregation, or LOD logic | Dataset metric or dimension in AQL |
| Parameter-driven logic | Parameter field, dashboard control, or modeled pattern |
| One-off grouping or display logic | Visualization settings, or a modeled dimension if reused |
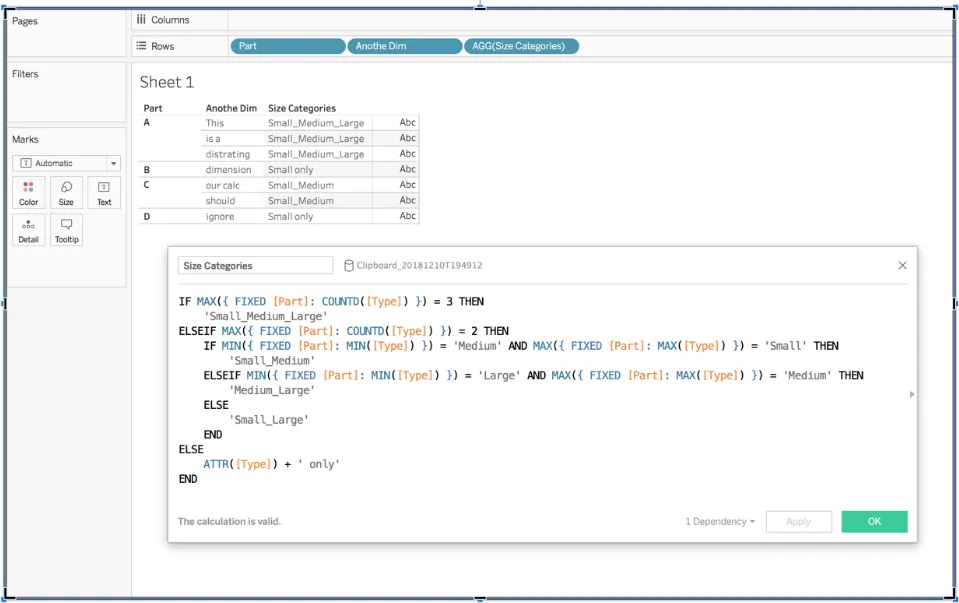
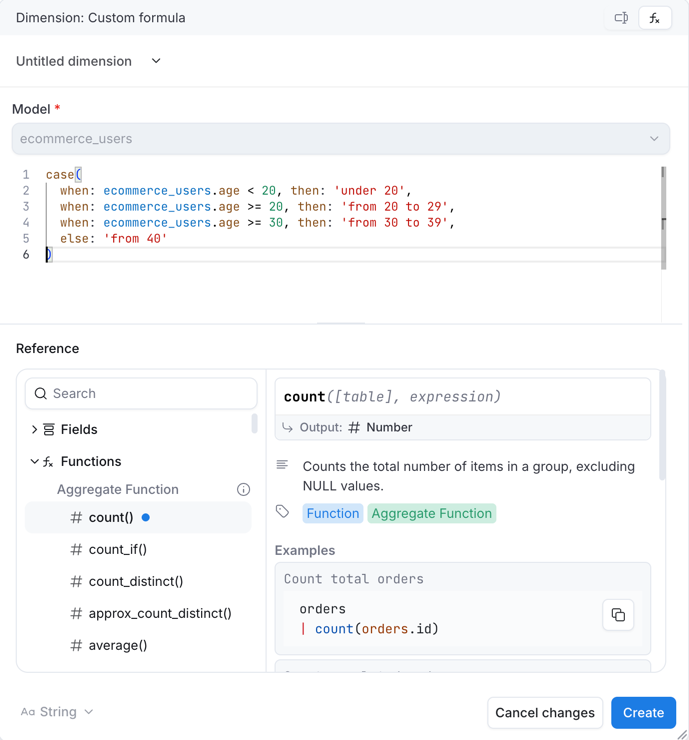
For example, a Tableau conditional calculated field can become a custom dimension in Holistics. Write the Holistics expression in the SQL dialect of your database; the example below uses case when syntax.
In Tableau:
In Holistics:
If the logic defines a business concept, model it once. If it only changes one chart, keep it close to the chart.
6. Rebuild charts and dashboards
For charts:
- Rebuild important Tableau worksheets as Holistics explorations or visualization blocks.
- Map fields, filters, sorting, and visual encoding.
- Convert hidden helper worksheets into metrics, dimensions, filters, or interactions where possible.
For dashboards, use Canvas dashboards and map common Tableau features like this:
| Tableau dashboard feature | Holistics equivalent |
|---|---|
| Dashboard filter | Filter block |
| Worksheet on a dashboard | Visualization block |
| Text, image, or explanatory content | Text block with Markdown |
| Dashboard action / navigation | Dashboard interaction, drill-through, tabs, or links |
| Date granularity control | Date drill or modeled date dimensions |
| Shared chart reused in multiple dashboards | Reused block |
Use this step to simplify old helper sheets and layout workarounds. Canvas dashboards let you rebuild the final user experience more directly.
7. Validate and publish
Before replacing the Tableau dashboard:
- Compare key numbers side by side.
- Use the same filters, date range, timezone, extract freshness, and row-level security assumptions.
- Check common mismatch sources: hidden filters, stale extracts, timezone handling, and worksheet-scoped calculations.
- Publish through Git version control and dev/prod mode.
- Recreate permissions, row-level rules, scheduled deliveries, share links, and embedded analytics surfaces.
Example: Sales Performance dashboard
Suppose a Tableau workbook has:
- Data source:
orders,order_items, andproducts, using an hourly extract. - Worksheets: Sales by month, top products, and fulfillment status.
- Calculated field:
if [status] = 'delivered' then 'Delivered' else 'Open' end. - Dashboard action: click a product to drill into order details.
In Holistics, migrate it as:
- Land extract-backed tables in the warehouse or dbt.
- Create
orders,order_items, andproductsmodels. - Define reusable fields and metrics once.
- Curate a Sales dataset with the right relationships.
- Rebuild the worksheets as visualization blocks on a Canvas dashboard.
- Use drill-through for the product-to-orders detail flow.
Example model fields:
Model orders {
  type: 'table'
  table_name: 'analytics.orders'
  data_source_name: 'warehouse'

  dimension fulfillment_status {
    label: 'Fulfillment Status'
    type: 'text'
    definition: @sql
      case
        when {{ #SOURCE.status }} = 'delivered' then 'Delivered'
        else 'Open'
      end
    ;;
  }

  dimension amount {
    label: 'Amount'
    type: 'number'
    definition: @sql {{ #SOURCE.amount }};;
  }

  measure total_sales {
    label: 'Total Sales'
    type: 'number'
    definition: @sql sum({{ amount }});;
    aggregation_type: 'custom'
  }
}