Migrate from Power BI to Holistics
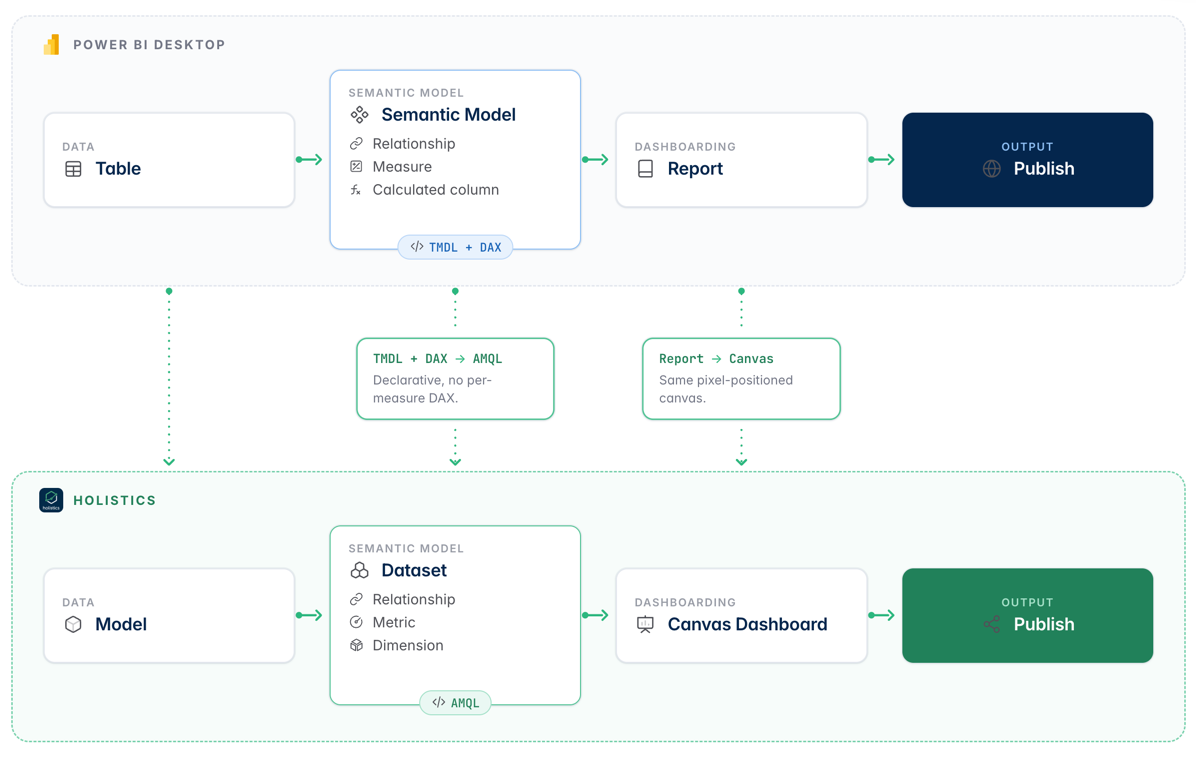
This is the overview of the migration process from Power BI → Holistics:
- Convert your
.pbixfile to a.pbipproject
By converting to a pbip project, the semantic model is exposed in TMDL and measures are exposed in DAX
In Power BI, go to File > Save As > Power BI Project (*.pbip)
-
Migrate the project one concept at a time:
- (Optional) Move heavy ETL out of Power Query (M) into upstream SQL or dbt
- Convert PBI tables to Holistics models (table or query type)
- Convert relationships to Holistics dataset relationships
- Convert DAX measures to AQL or SQL metrics
- Convert calculated columns to dimensions
- Rebuild reports as Holistics dashboards
- Validation:
- Compare a sample of measure values between PBI and Holistics
- Re-create one report end-to-end and review with a stakeholder before scaling out
A few Power BI features map to Holistics concepts that live outside the .pbip project, so they can't be lifted from TMDL or JSON. Plan to re-create them manually:
| Power BI | Holistics equivalent | Notes |
|---|---|---|
| Data alerts | Alerts | Re-create thresholds and recipients in Holistics. |
| Scheduled refresh / subscription | Schedule & email reports | Holistics schedules send dashboard snapshots; no warehouse refresh job needed. |
| Embed in app / Publish to web | Embedded analytics | Embed tokens and iframe URLs must be reissued. |
| Share link / publish to web link | Shareable link | Generate fresh links in Holistics and update any docs / wikis that point to PBI. |
Each of these has a Holistics REST API you can use to bulk-create them from a CSV or script, which is the fastest path when you have dozens of alerts or embeds to migrate.
Project structure
If you're used to a .pbip folder layout, here's how the same project looks in Holistics:
power-bi-project/                   holistics-project/
  project.pbip                        models/
  project.Dataset/                      tables/
    definition/                           orders.model.aml
      model.tmdl                          users.model.aml
      tables/orders.tmdl                queries/
      tables/users.tmdl                   active_users.model.aml
      expressions.tmdl  (M code)
  project.Report/                     datasets/
    definition.pbir                     ecommerce.dataset.aml
    report.json                         marketing.dataset.aml
                                      dashboards/
                                        sales.page.aml
                                        performance.page.aml
Agentic migration process
With the above conceptual mapping, a coding agent with the holistics-migrate-power-bi skill can handle migration smoothly.
Prerequisites
Before you run the skill:
- A
.pbipexport of Power BI- In Power BI Desktop, go to
File > Save As > Power BI Project (*.pbip). - Turn off Auto date/time to keep
LocalDateTable_*artifacts out of TMDL.
- In Power BI Desktop, go to
- A warehouse Holistics can connect to
- Holistics project set up for local development
- The holistics-migrate-power-bi skill installed
Run the migration
Open your Holistics project in the IDE, drop the .pbip folder alongside it, and send one prompt:
/holistics-migrate-power-bi migrate this power bi project into holistics
The workflow runs through the project in seven phases:
- Inventory: read TMDL, DAX, relationships, report JSON; list warehouse schemas
- Models: write one
.model.amlper Power BI table, validate after each - Dataset: write
.dataset.amlwith models and relationships - Metrics: convert DAX to AQL
- Dashboard: write
.page.amlcanvas dashboard with filters, visuals, and layout - Parity: run metrics across dimension combinations, compare totals against Power BI
- Sync:
holistics sync-codeto push to Holistics
Validation checklist
After the migration finishes, sanity-check the result before handing it to stakeholders:
- Project compiles cleanly (
holistics aml validate) - Dataset diagram view shows the same star schema as Power BI
- Each DAX measure has a corresponding AQL metric, and totals match for a known date range
- Role-playing date relationships (active vs inactive) resolve the same joins Power BI used
- Dashboard pages mirror the Power BI report's layout and totals
- Row-level security rules produce the same row counts per user