Build your own calculations
A get-started guide for Explorers creating their own metrics, no code required. Build them with a few clicks, and each one generates correct AQL and handles Level of Detail for you, so the same definition holds up in every report.
Getting started
This handbook focuses on practical calculation patterns: ratios, filtered metrics, time comparisons, buckets, and other metrics Explorers can build without code. Viewers can open shared dashboards and reports, but they cannot create these calculation fields.
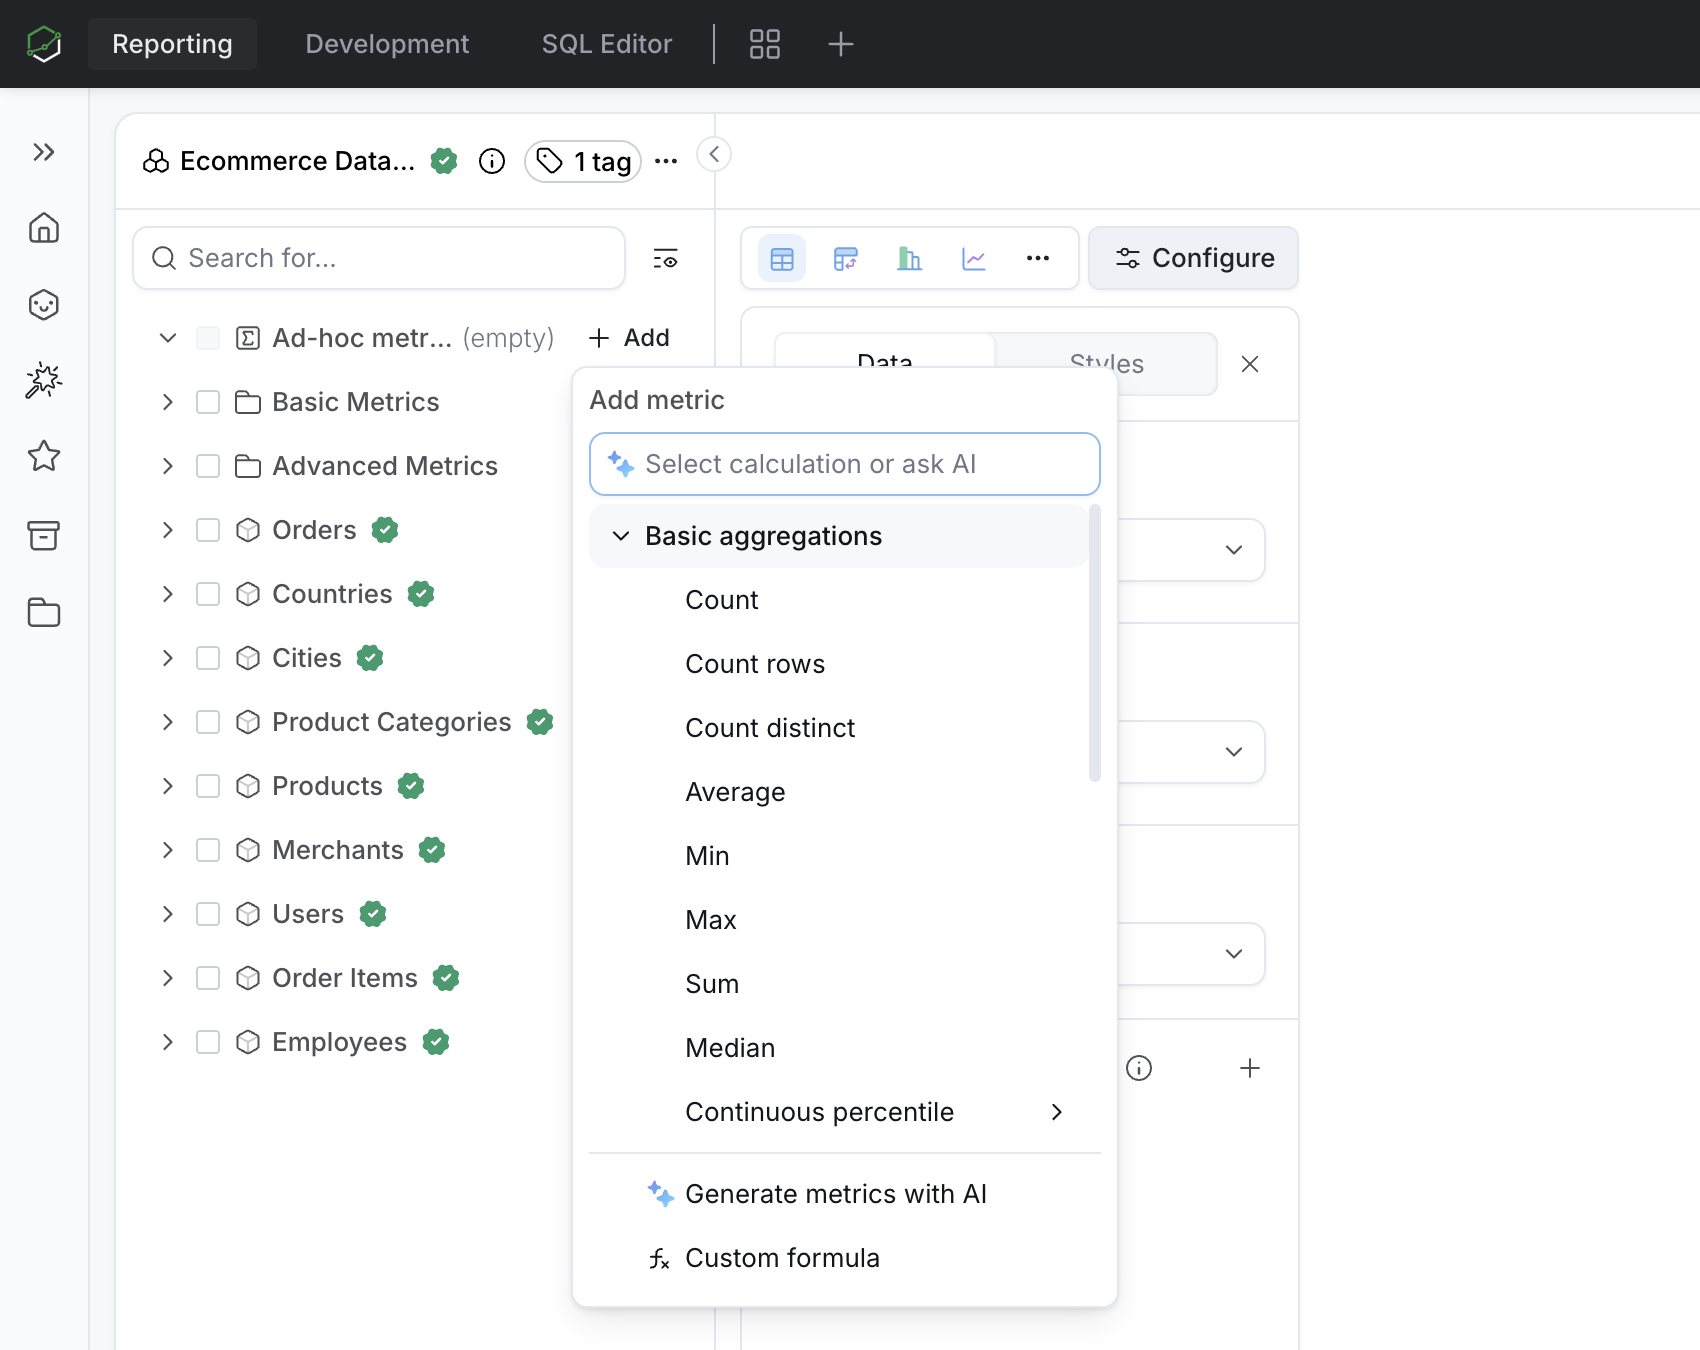
There are two quick ways to open Calculation Builder. For the full orientation, including the catalog, AI-generated metrics, and generated AQL, see Start building with Calculation Builder.
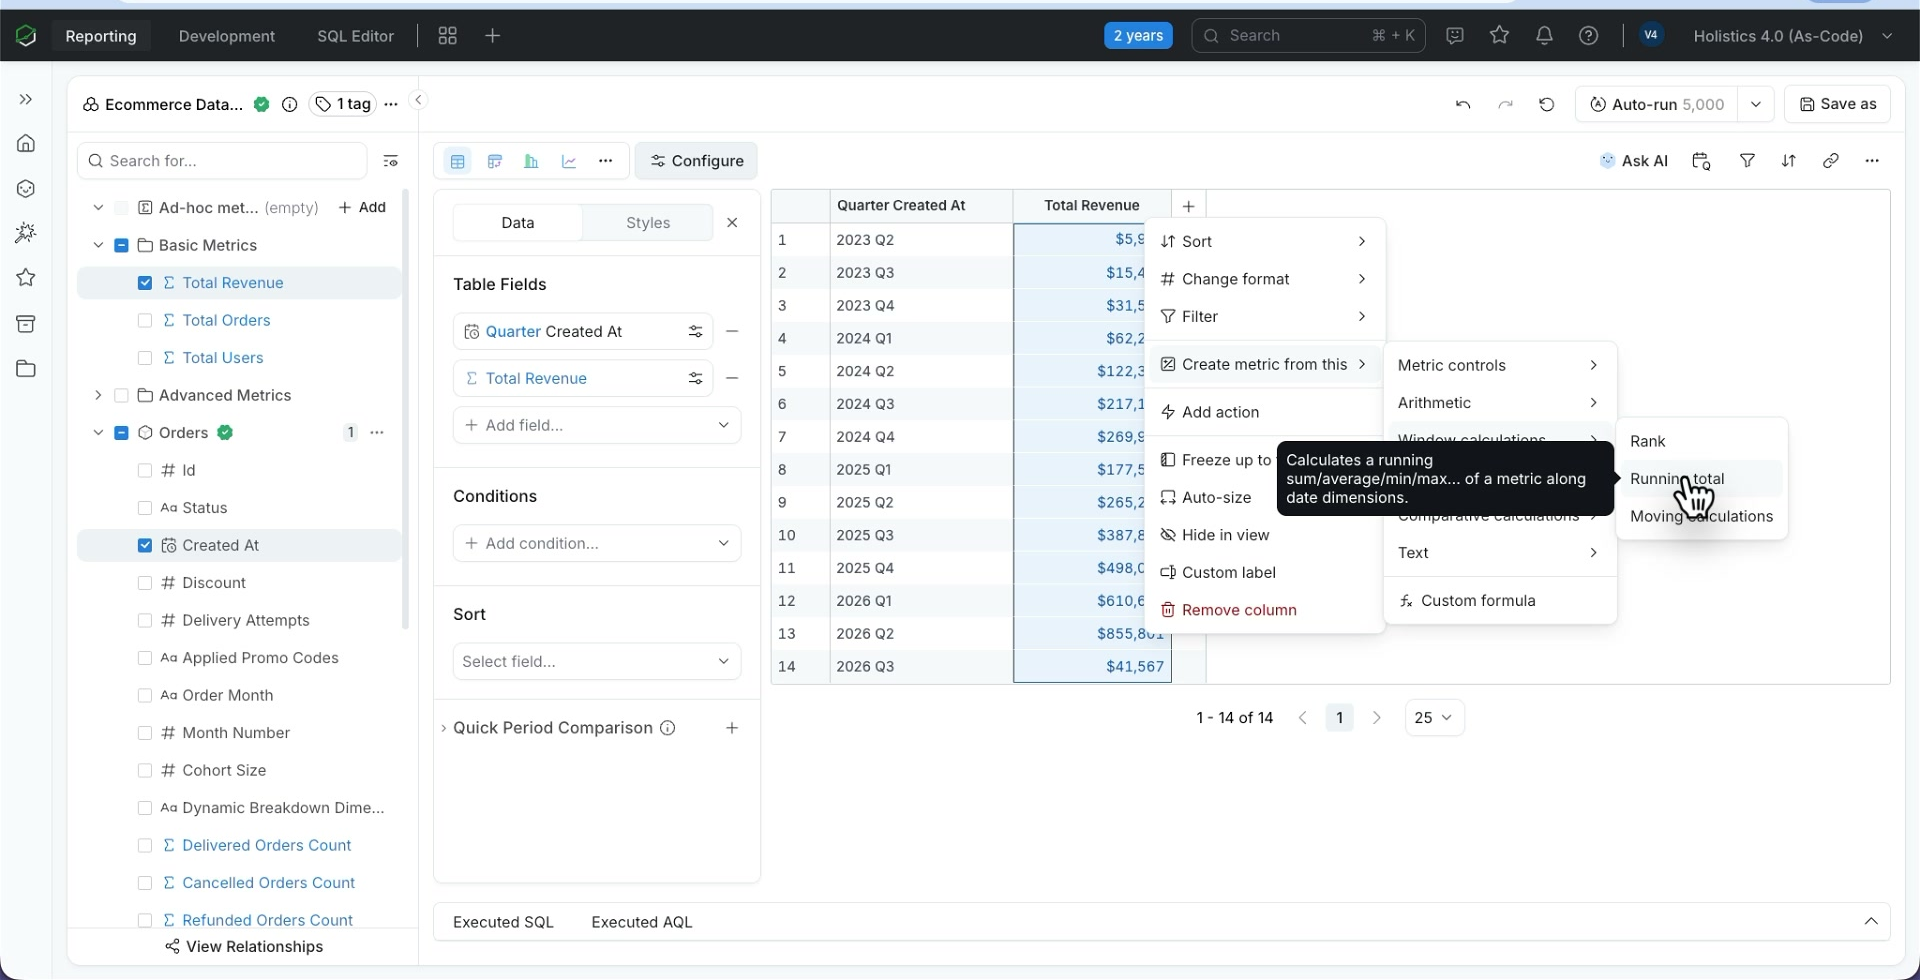
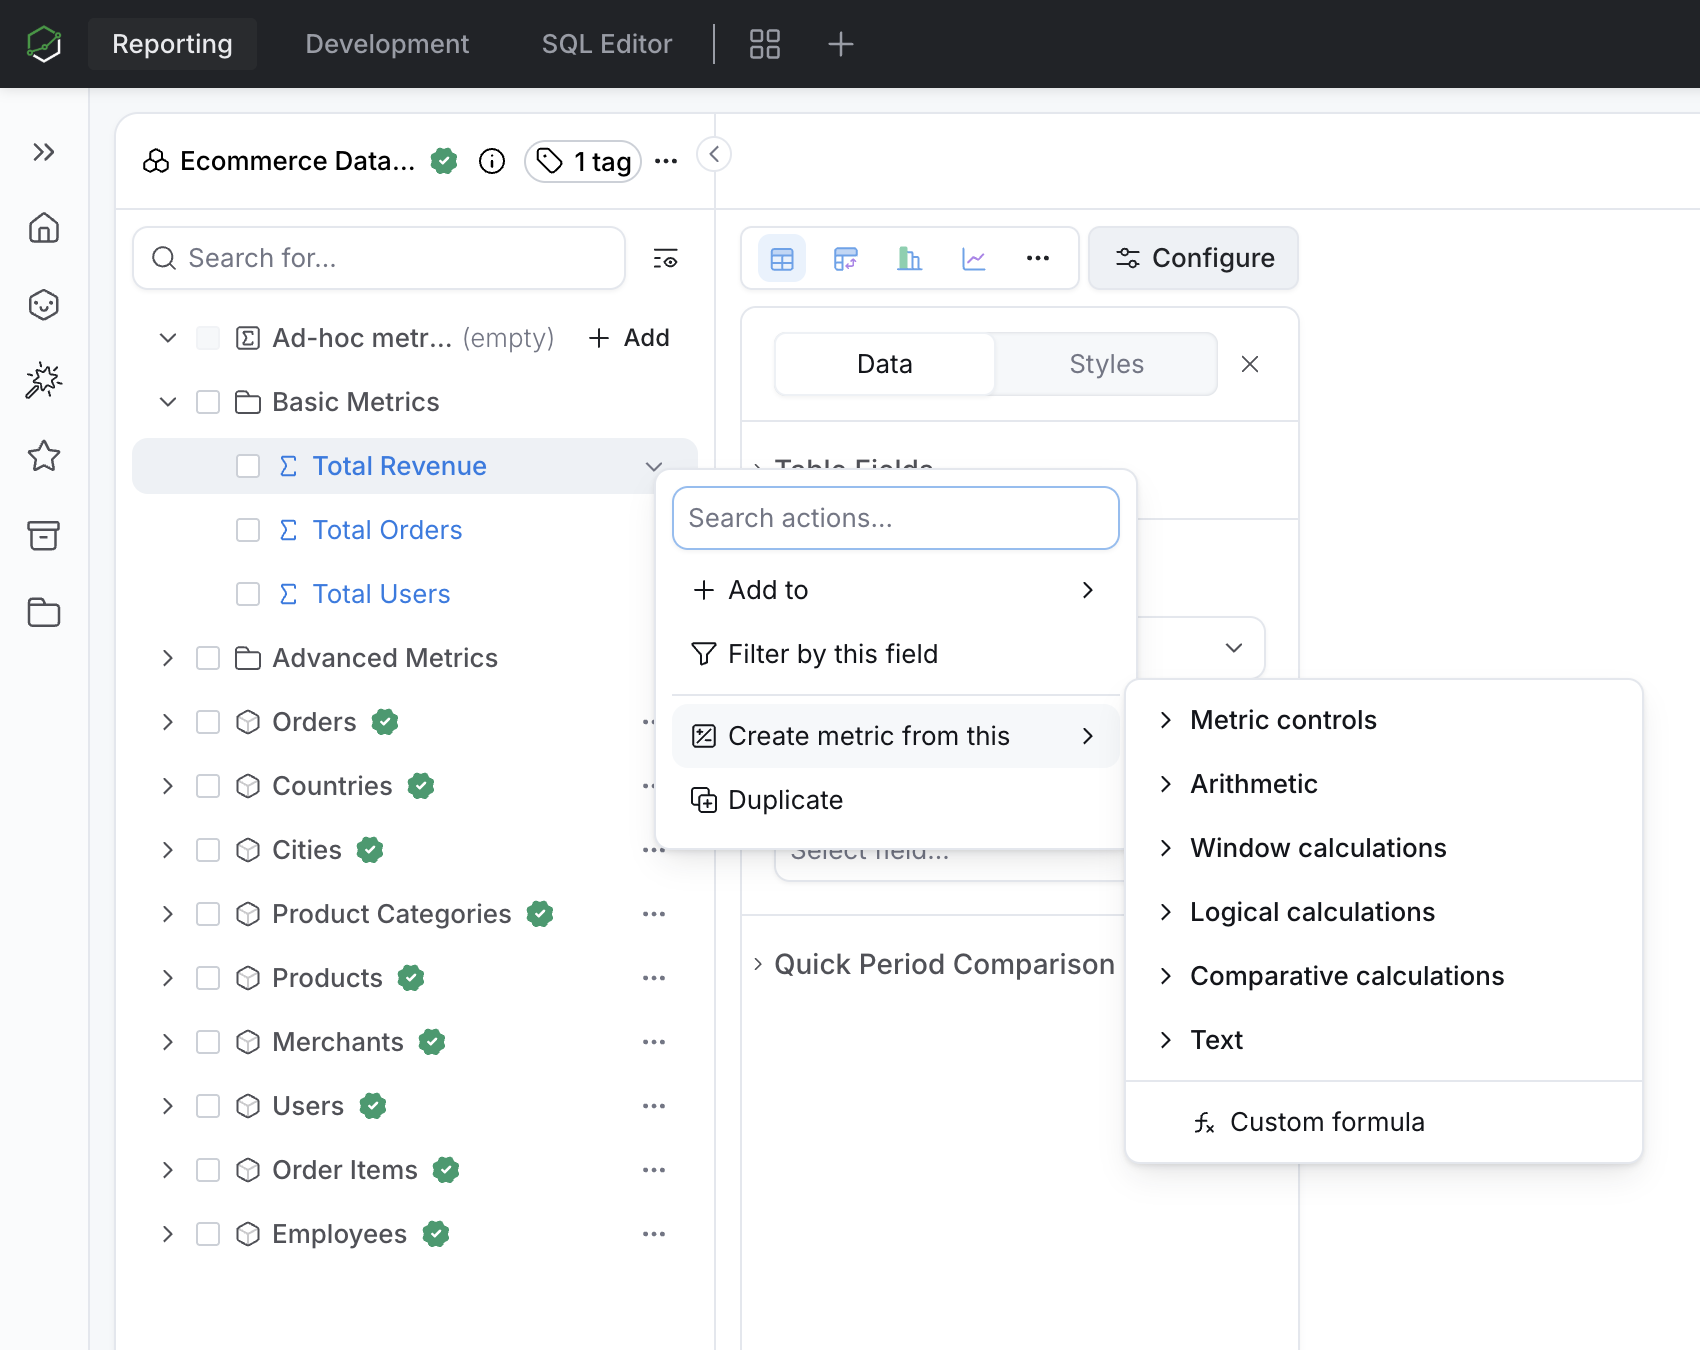
Once you know where the builder lives, it helps to understand a few controls that apply across many calculations.
Before you build
Calculation Builder is not a separate formula system. It creates normal Holistics metrics that you can reuse, inspect, adjust, and compose with other calculations.
Most calculations start from a metric you already have. From an existing metric's menu:
- Choose Create metric from this when you want a new metric based on the current one. For example, build a filtered revenue metric first, then compare that filtered metric against the previous period.
- Use Duplicate when you want to keep the same shape but change one condition, like duplicating a completed-orders metric and changing the status to refunded.
- Rename the metric through Label, Name, and Description so it reads clearly in the report.
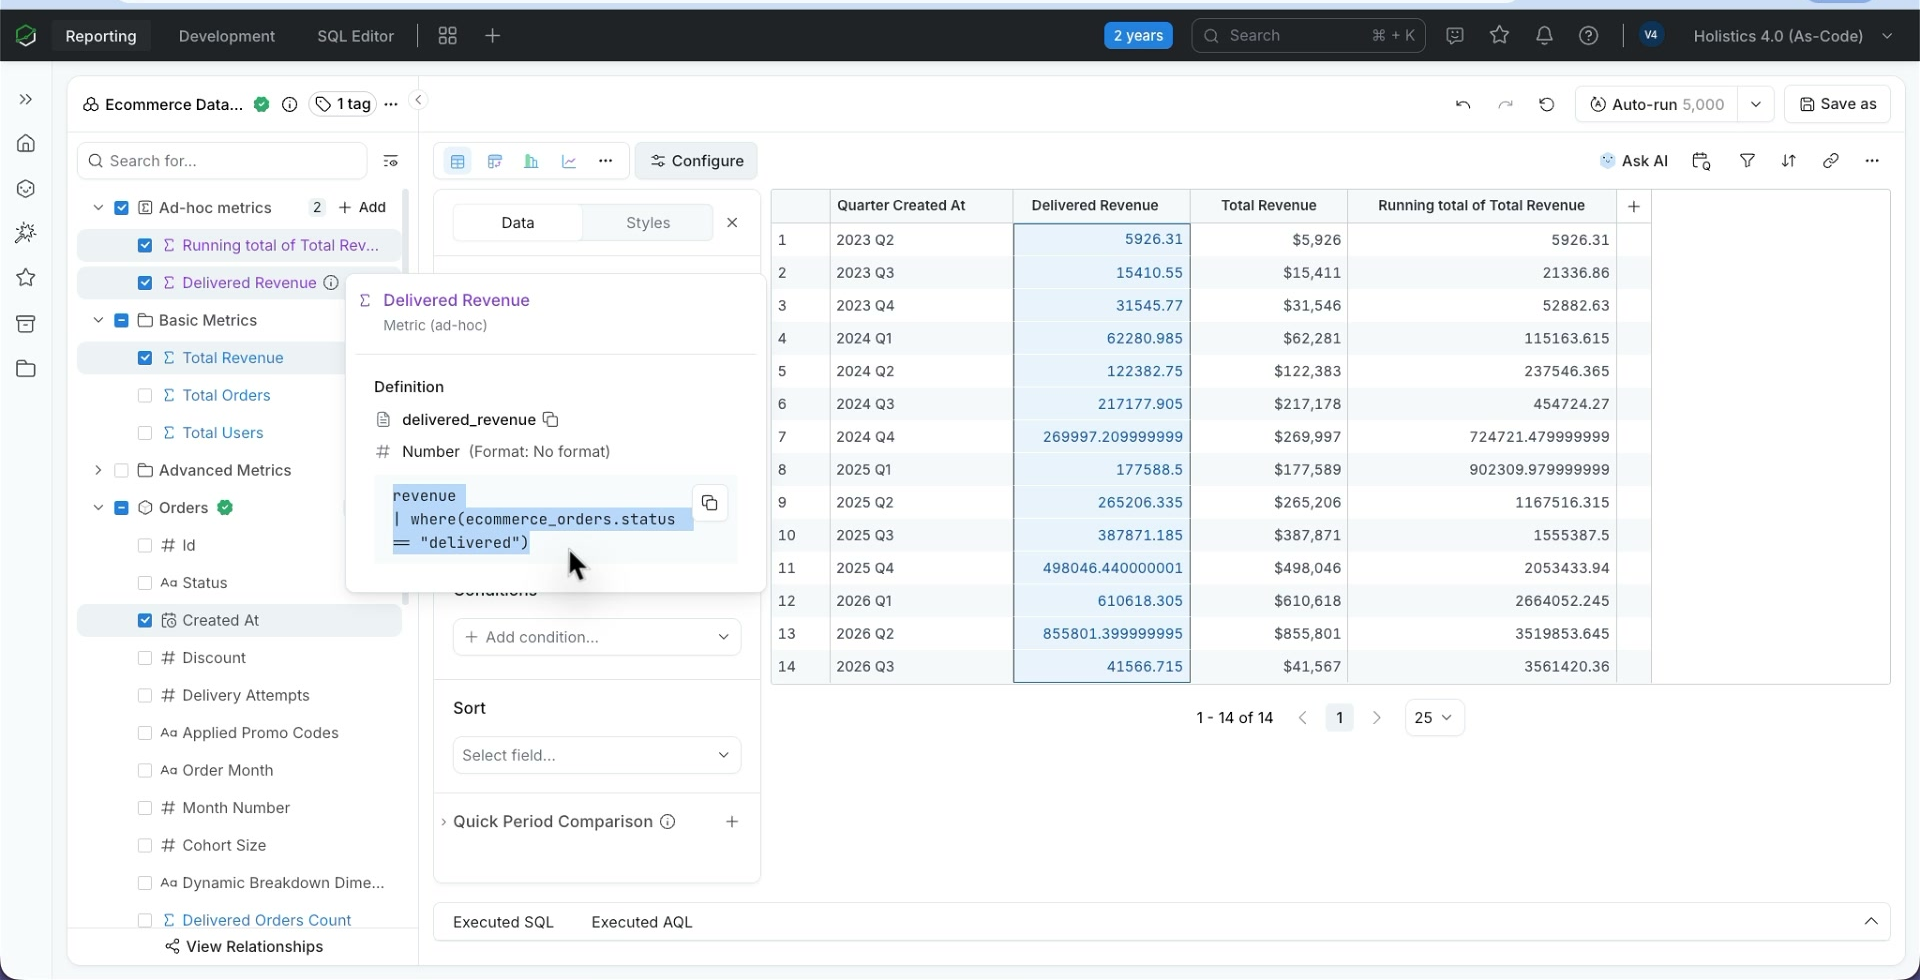
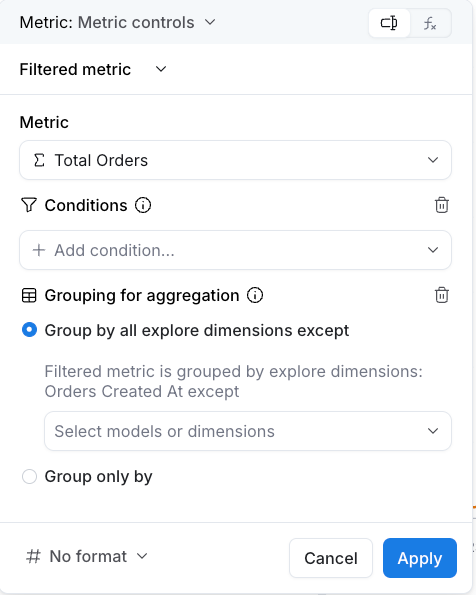
With that foundation, use the examples below as a menu of common calculations to try.
Core metrics
These are the everyday numbers: a metric scoped to the rows you care about, a ratio, and an aggregation over any field. They cover most of what an Explorer builds day to day.
Filter a metric to a subset
Scope one metric to a slice of rows, like an orders metric that counts only delivered orders.
Build a ratio like Average Order Value
Define a ratio like average order value once as one metric divided by another, correct at every grain.
Trends over time
Time-based calculations answer how a number is moving. Compare against a past period, accumulate as you go, or run a sliding window to smooth the trend or measure how much it's swinging.
Compare to a previous period
Put this quarter next to last, as a value, a change, or a percent, with no self-join.
Accumulate with a running total
Turn monthly revenue into cumulative revenue to date, accumulated along your date dimension.
Smooth a trend with a moving average
Average a noisy week-to-week line into a readable trend. A trailing window is the classic moving average; a centered window smooths most cleanly.
Measure volatility, totals, and extremes
The same window can do more than smooth. A moving standard deviation gauges volatility, a trailing sum gives a rolling total like trailing 12 months, and a moving min or max tracks running highs and lows.
Segment and compare
Sometimes the story is in how the parts stack up against each other. Show each slice as a share of the whole, or group a continuous field into tiers you can compare.
Show each part as a percent of total
Read each part as a share of the whole, and choose which whole: the row, the column, or the grand total.
Bucket values with Case when
Turn a continuous field into tiers (the result is a dimension), like grouping customers by age or by spend band.