Drill down & break down
Introduction
Drill down and break down give your team instant analytical depth without leaving the dashboard. These interactions transform static charts into exploratory tools. Click any data point to understand what's driving the numbers.
Both features work immediately on your existing dashboards with zero configuration required.
Getting started
Break down
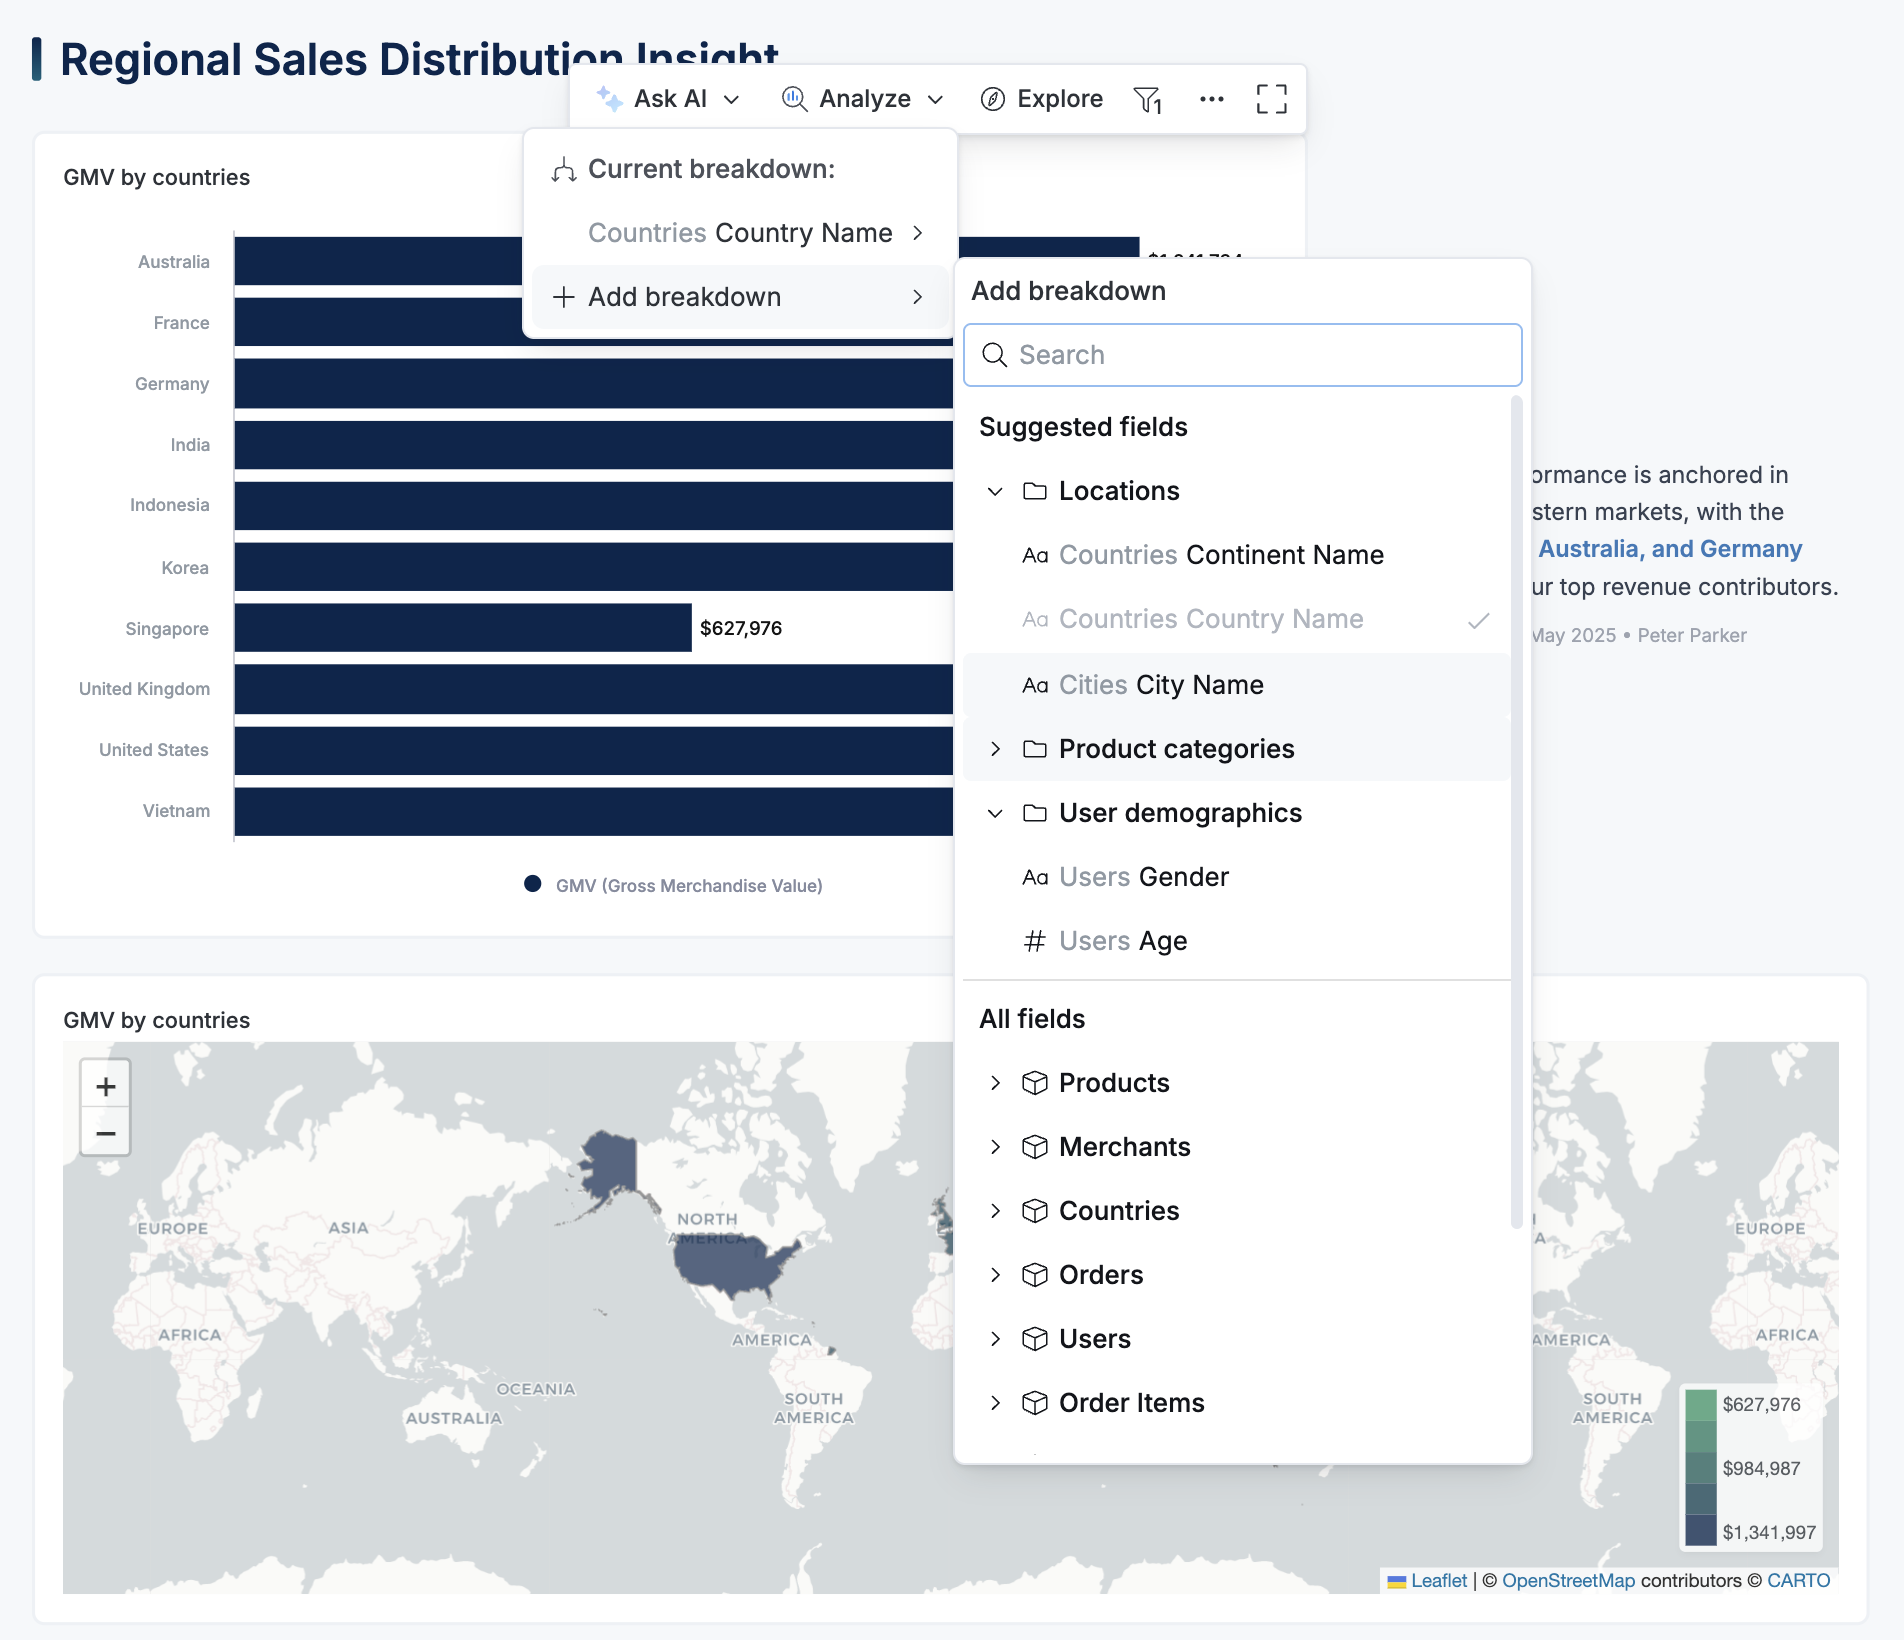
Break down lets you split a metric by any dimension you choose: product, region, customer segment, and more. Right-click on a chart or use Analyze in the toolbar to add or change breakdowns and see different perspectives of the same number.
Drill down
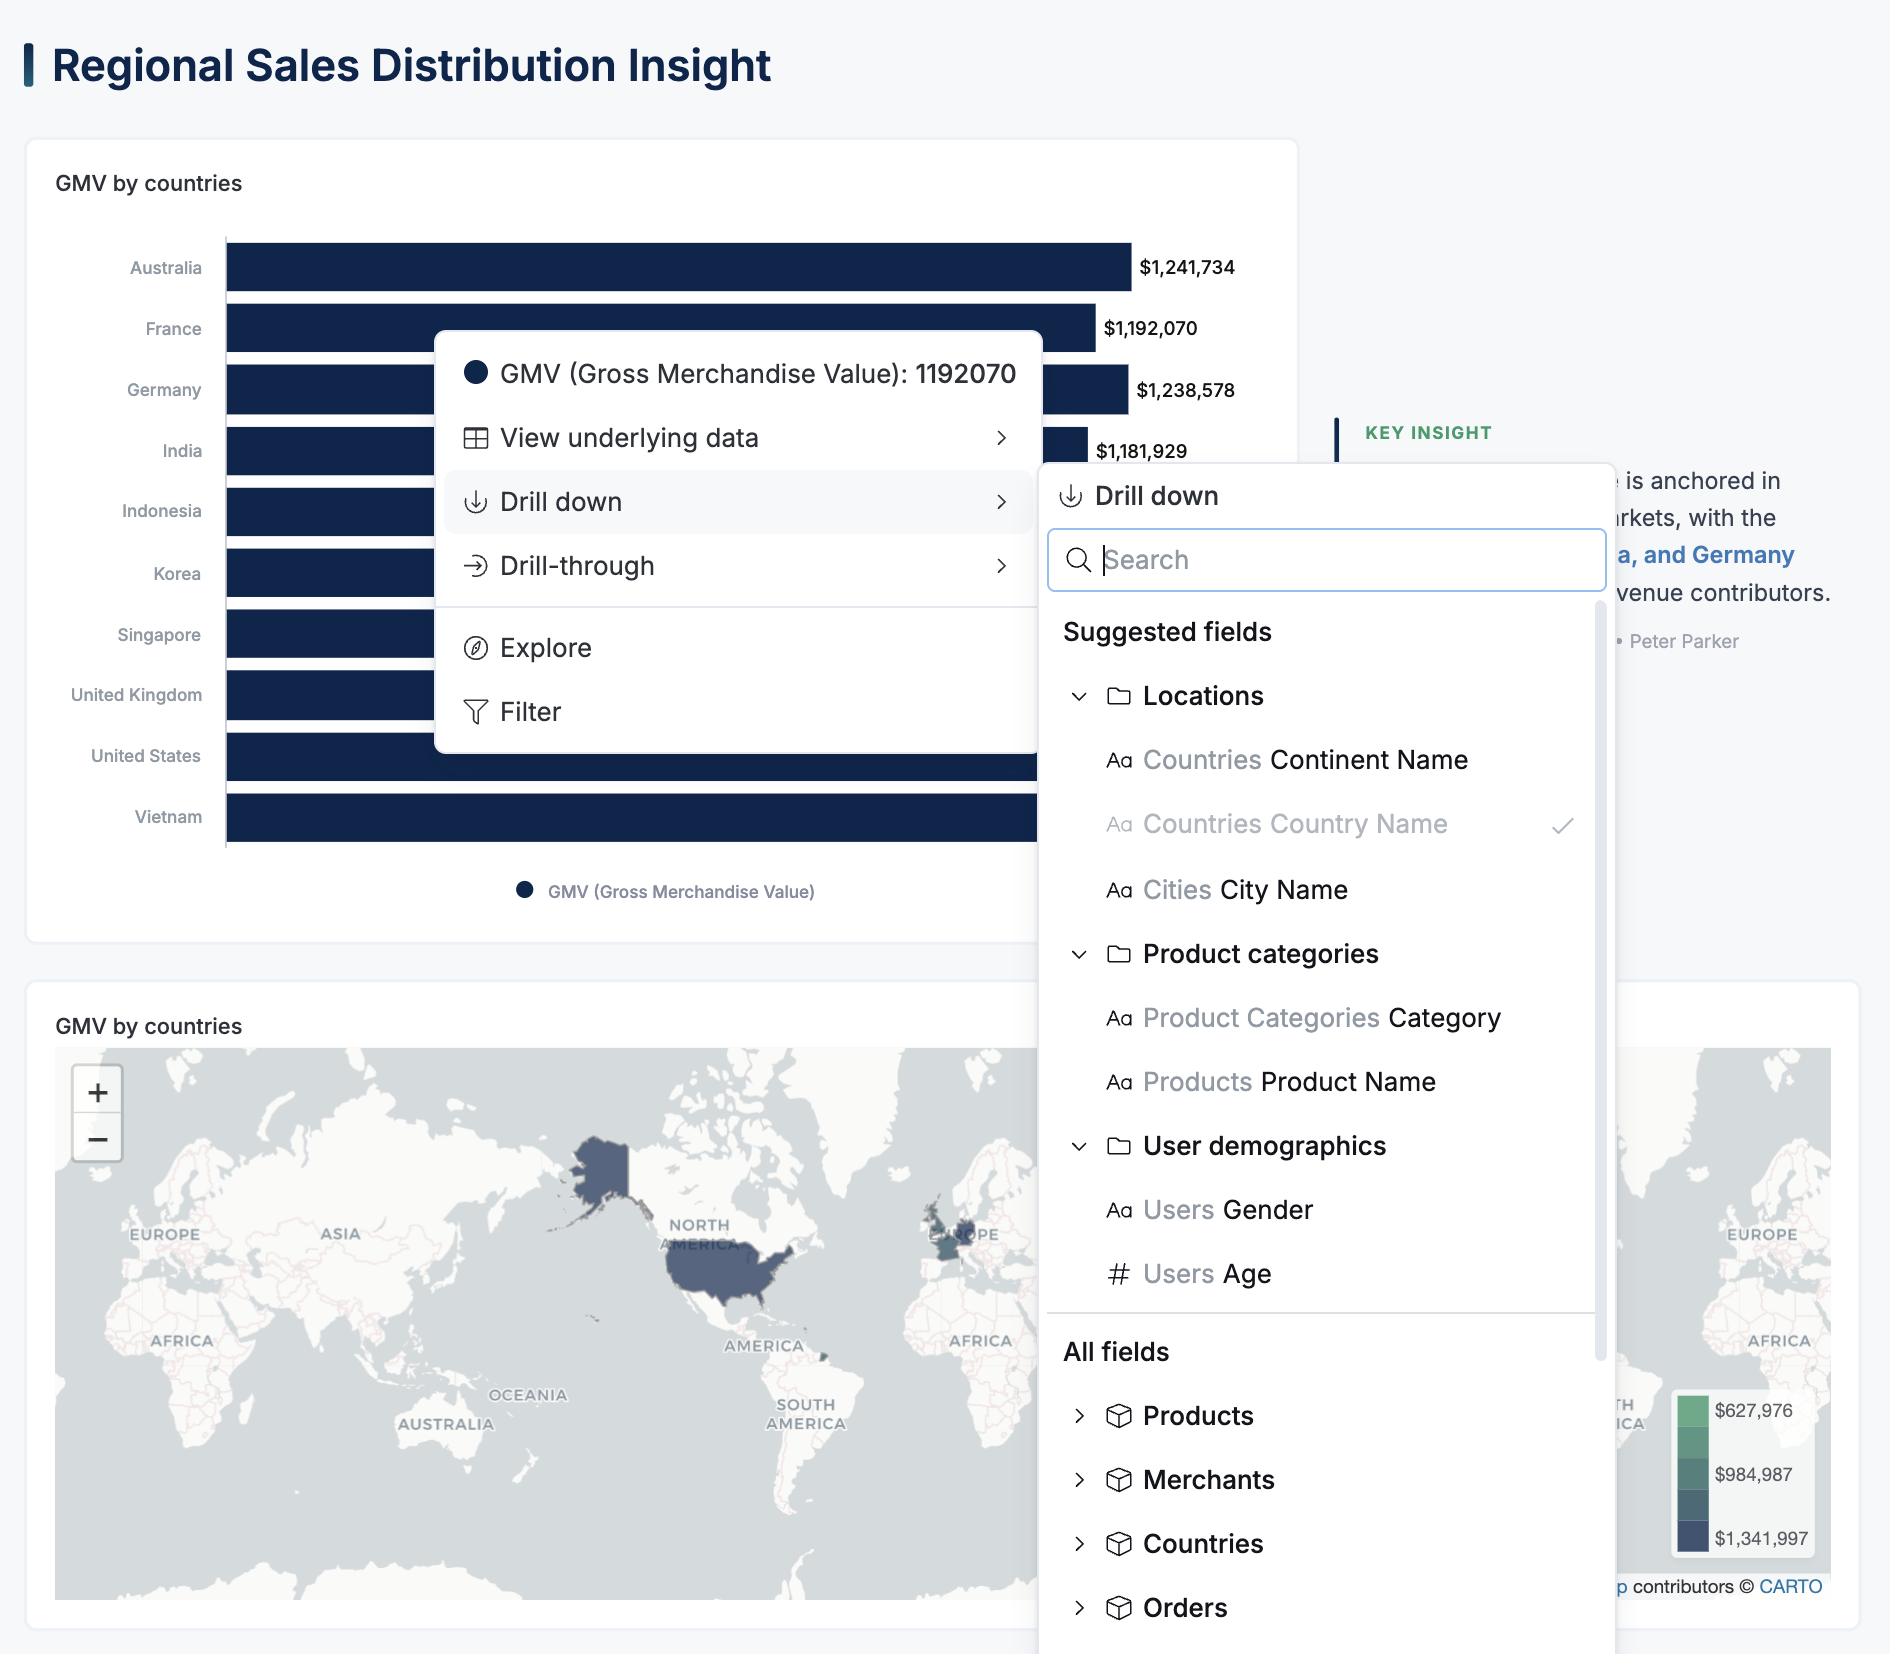
Drill down is a filtered breakdown applied to a specific data point. Right-click on any data point, select drill-down, and the chart filters to that item and shows its breakdown by your selected dimension. Each click takes you one level deeper in the hierarchy.
Break down context and configuration
As your needs grow, you can:
- Customize the dimension list: Organize dimensions into logical groups and control which ones appear
- Disable the feature: Turn off drill down and break down for specific datasets or visualizations
- Help AI understand your data: Your breakdown configuration also improves AI suggestions
Customize the dimension list
By default, the dimension list shows every available dimension from the dataset. This works fine for small datasets, but as your data model grows, users may face a long, unorganized list that makes finding the right dimension difficult.
Customizing the dimension list solves this by letting you:
- Highlight relevant dimensions: Surface the most useful breakdowns for each context
- Organize into logical groups: Group dimensions by category (e.g., locations, products, user demographics)
- Guide the drill-down path: Arrange fields in a natural hierarchy (e.g., continent → country → city)
Here's an example of a customized dimension list in action:
You can configure the dimension list at either the dataset level or the visualization level. This customization will apply to all metrics within the selected dataset or visualization.
Customize at dataset level
In Development, open your dataset definition, and add your breakdown group definition under: dataset > context > analysis > breakdown > group
Only dimensions are allowed in group
Dataset ecommerce {

  models: [users, orders, cities, products]

  relationships: [
    relationship(orders.user_id > users.id, true),
    ...
  ]

  context {
    analysis {
      breakdown{
        group location {
          label: 'Locations'
          fields: [
            r(users.continent),
            r(users.country),
            r(users.city),
          ]
        }

        group product {
          label: 'Products'
          fields: [
            r(products.category),
            r(products.name),
          ]
        }
      }
    }
  }
}
Customize at visualization level
In Development, open your dashboard definition, and add your breakdown group definition under: dashboard > VizBlock > analysis > breakdown > group
Note that this will override any configuration defined at the dataset level.
block v23: VizBlock {
  label: 'Count of Users'
  viz: CombinationChart {
    dataset: ecommerce

    x_axis: VizFieldFull {
      ref: r(users.sign_up_date)
    }

    y_axis {
      series {
        field: VizFieldFull {
          ref: 'count_of_users'
        }
      }
    }

    context {
        analysis {
            breakdown {
                group user_attributes {
                    label: 'User attributes'
                    fields: [
                        r(users.country),
                        r(users.city),
                        r(users.gender),
                        r(users.age_group)
                    ]
                }
            }
        }
    }
  }
}
Best practices
- Assign a clear and intuitive
labelto each breakdown group to improve the end-user experience. - Arrange fields in the
groupaccording to the preferred order, as this will imply the drill-down hierarchy, for instance: continent > country > city.
Disable the feature
Sometimes you need to turn off drill down and break down. For example, when a dataset contains sensitive dimensions you don't want users exploring, or when breakdowns don't make sense for certain visualizations.
You can disable the feature for an entire dataset or a specific visualization:
Dataset ecommerce {

  models: [...]

  relationships: [...]

  metric {...}

  settings {
    analysis_interactions {
      breakdown {
        enabled: false
      }
    }
  }
}
Note that the most restrictive configuration applies. In other words, for "Drill down" and "Break down" to be available in a visualization, it must be enabled at both the dataset and visualization levels.
Bonus: Help AI understand your data
The breakdown groups you configure aren't just for end users. They also help Holistics AI provide smarter suggestions. When you define meaningful dimension groups, the AI uses this context to better understand your data model and deliver more relevant recommendations.
Learn more about Context for AI.
Supported visualizations
- Line, column, bar, area and combination charts
- Pie, donut, pyramid and funnel charts
- Pivot table
- Conversion funnel chart (only Break Down available)
Who has access
Users with permission to explore the associated dataset can access these interactions (typically those with the Explorer, Analyst, or Admin roles). To customize or disable these features, you need the Analyst or Admin role.
These features are not supported in Shareable Links.