EduPulse Analytics
Education · Light · Tabbed
A course analytics theme that holds up across quite different content shapes. Three tabs, each with a different job.
What makes it work
- Teal and green with pinned-note illustrations, which suits the subject without tipping into cute.
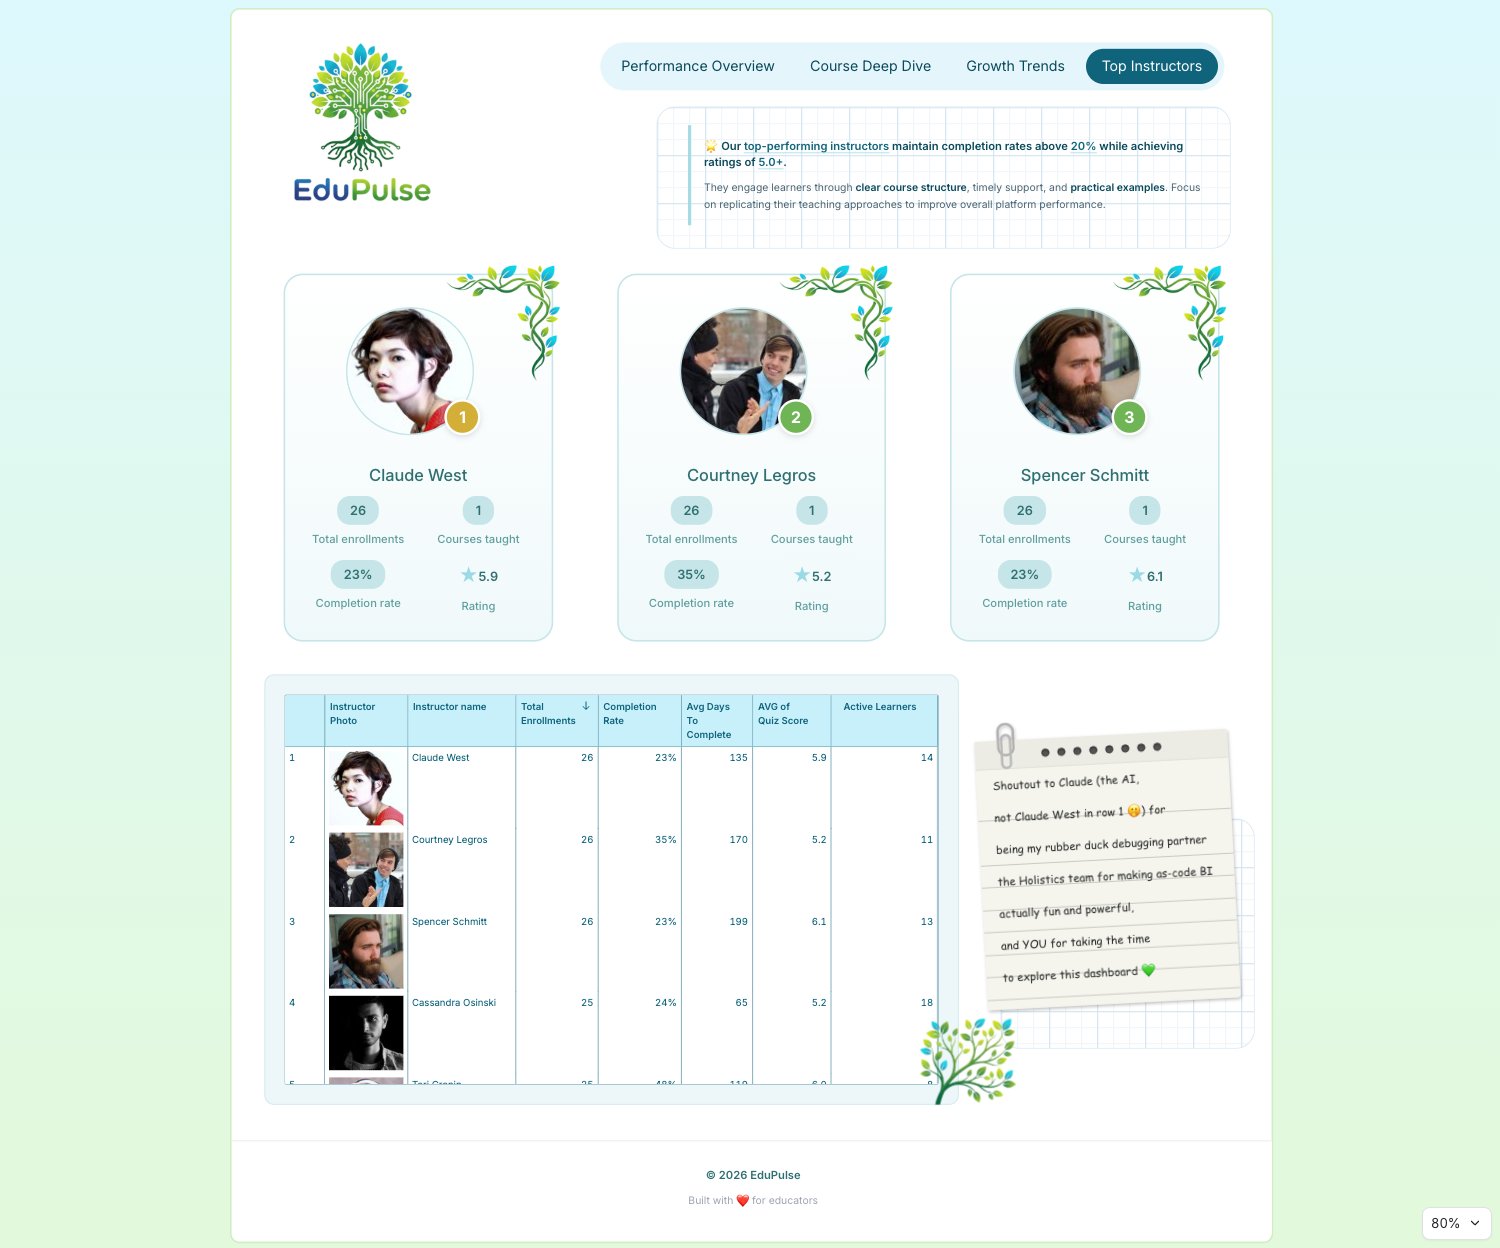
- Instructor cards combine a photo, a name, and two metrics in a single block.
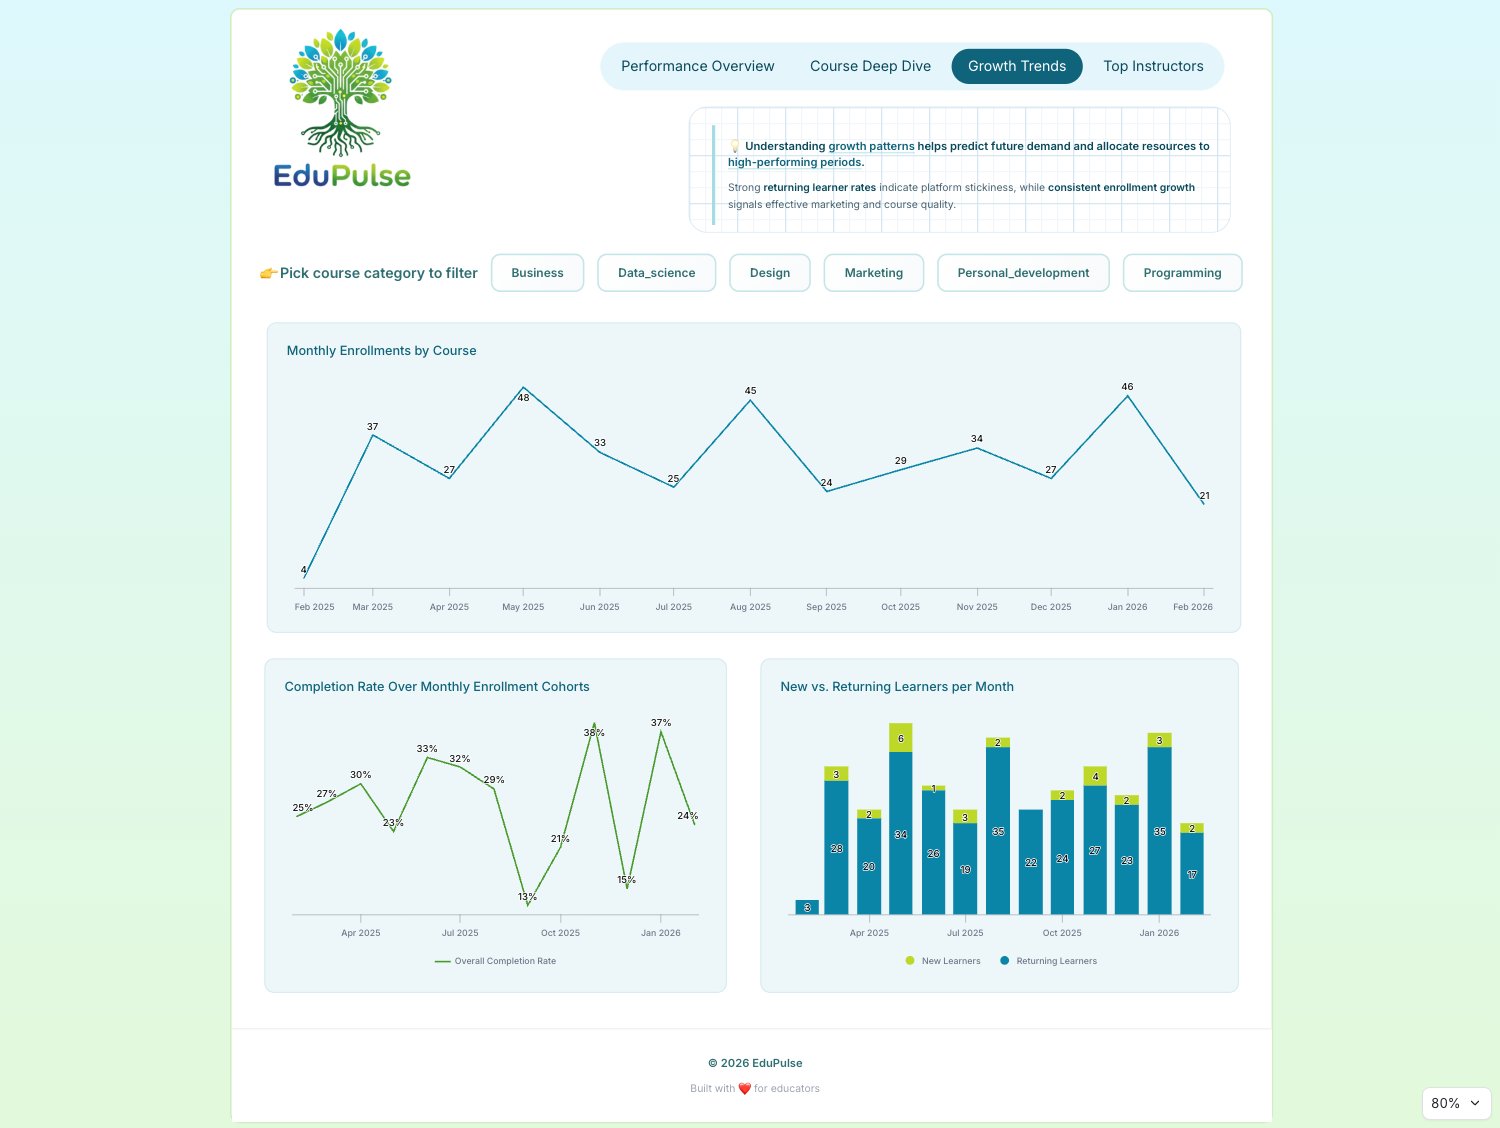
- The growth trends tab drops to plain time series, and the theme still reads as the same product.
- A good example of a theme that survives contact with a table.
The views
Each tab is shown below at full width.
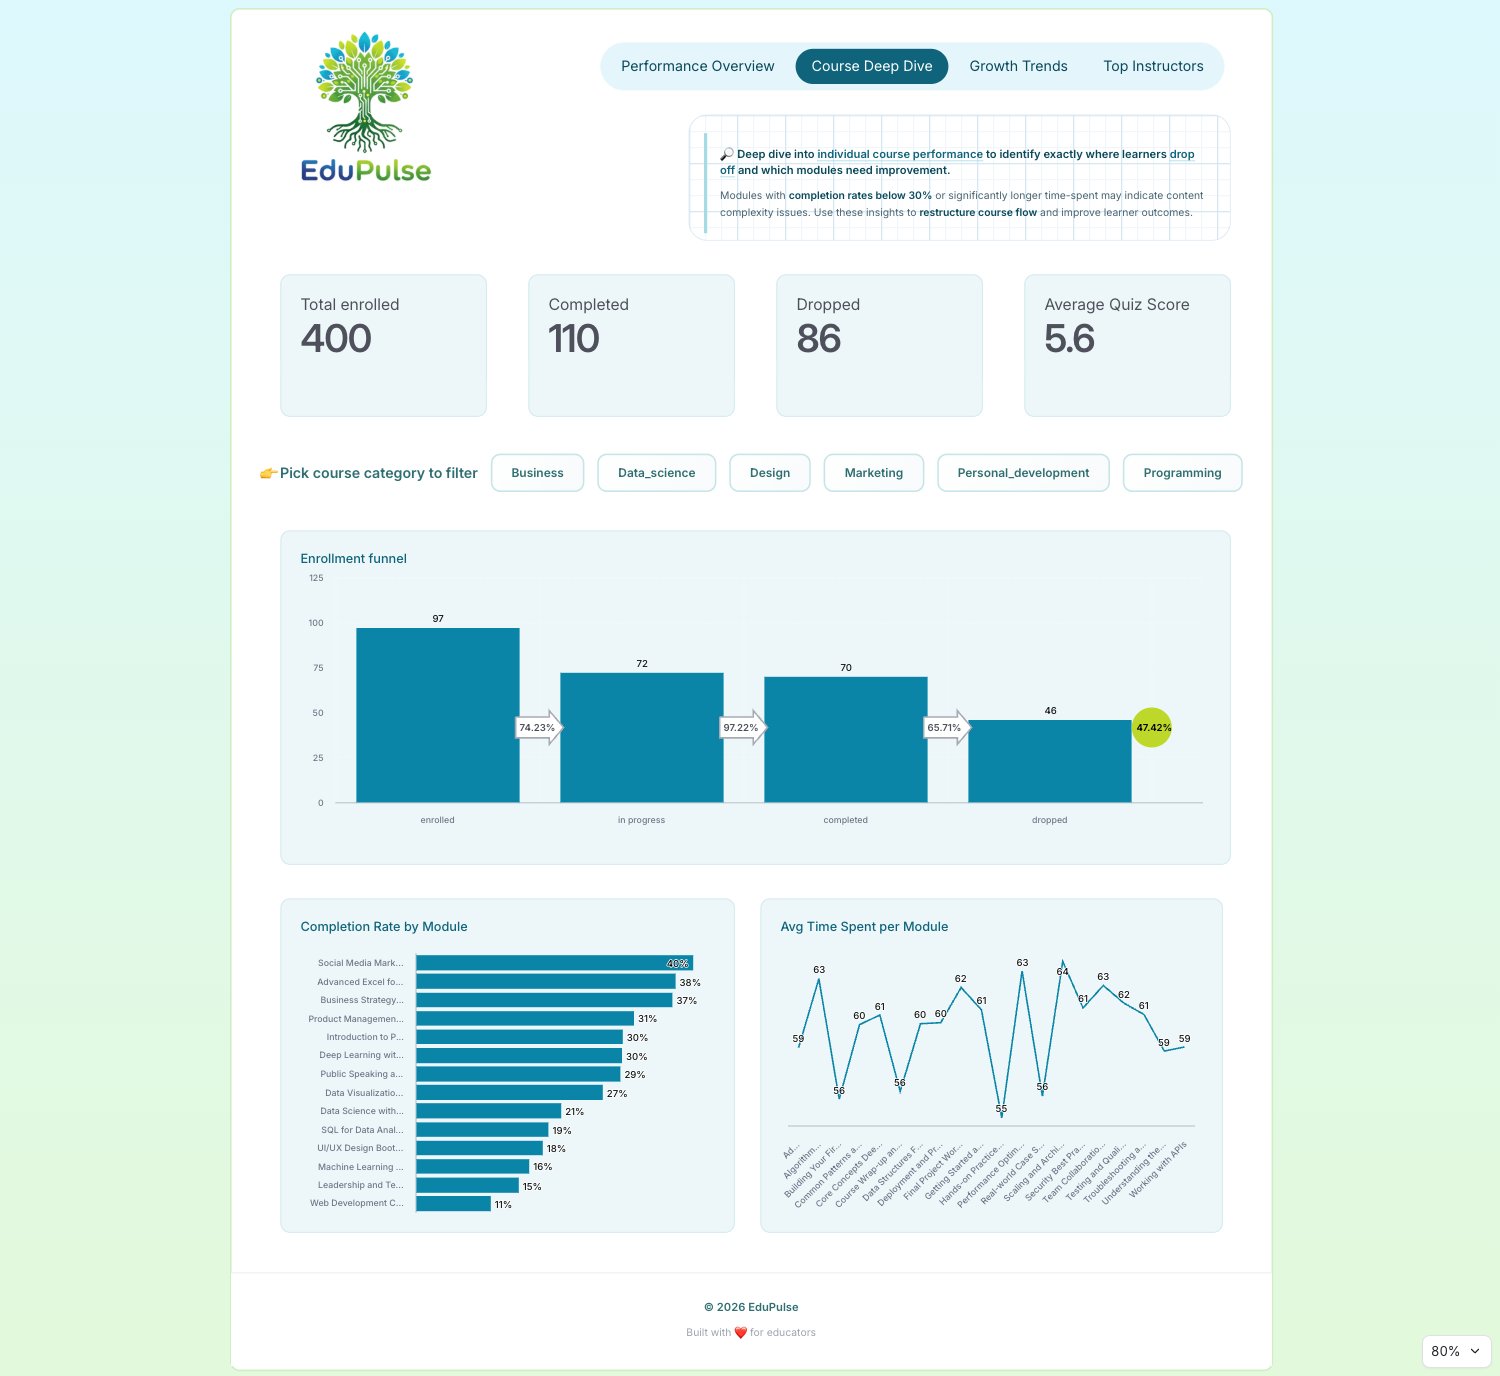
Course Deep Dive
Growth Trends
Top Instructors
See it live
Open the live dashboard to click through it yourself. No Holistics account needed.
Theme code
The theme this dashboard actually uses, written out as a reusable PageTheme. Paste it into a
.theme.aml file under Development > Library > Themes to reuse it across your own dashboards,
or inline it as a single dashboard's theme: property. Chart colour palettes are set
separately, so they are not included here.
edupulse_analytics_theme.theme.aml
PageTheme edupulse_analytics_theme {
  background {
    bg_image: "linear-gradient(to top, #E3F9DB, #DDF8FF)"
  }
  canvas {
    border {
      border_color: "#CFEEC3"
      border_width {
        top: 2
        left: 2
        right: 2
        bottom: 2
      }
      border_radius {
        top_left: 12
        top_right: 12
        bottom_left: 12
        bottom_right: 12
      }
    }
    shadow: "none"
  }
  block {
    text {
      font_color: "#0F647B"
    }
    label {
      font_size: 16
      font_color: "#0F647B"
    }
    border {
      border_color: "#C7E4EC"
      border_width {
        top: 1
        left: 1
        right: 1
        bottom: 1
      }
      border_radius {
        top_left: 12
        top_right: 12
        bottom_left: 12
        bottom_right: 12
      }
    }
    padding {
      top: 24
      left: 24
      right: 24
      bottom: 24
    }
    background {
      bg_color: "#EDF7F9"
    }
  }
  viz {
    table {
      header {
        bg_color: "#C7F0FB"
      }
      general {
        font_color: "#0F647B"
        hover_color: "#E1F5F9"
        banding_color: "transparent"
        grid_color: "#629AA9"
        border_color: "#629AA9"
      }
    }
  }
}