Squad Reporting
Project delivery · Light · Tabbed
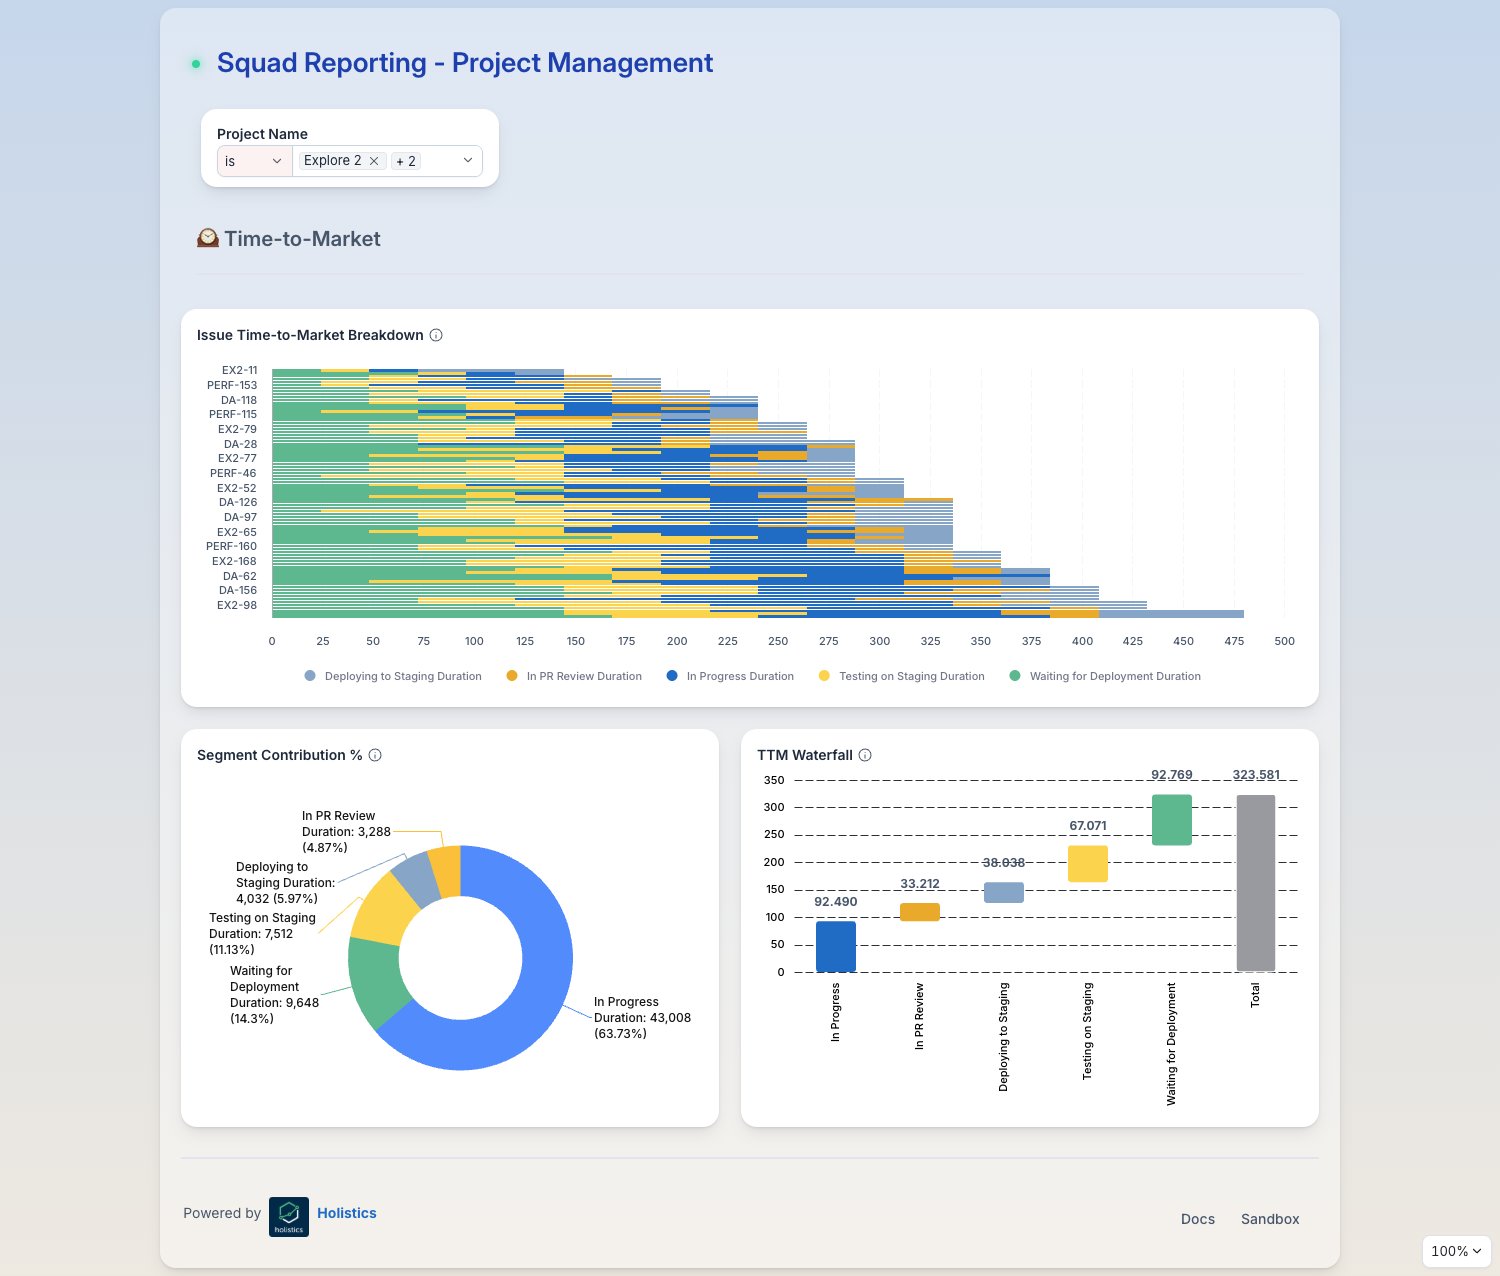
Engineering delivery metrics across four tabs. The interesting part is the time-to-market breakdown, which turns a vague complaint into a measured one.
What makes it work
- A light blue theme that stays out of the way of dense tables.
- The time-to-market waterfall splits cycle time into its stages, so the bottleneck stage is visible rather than inferred.
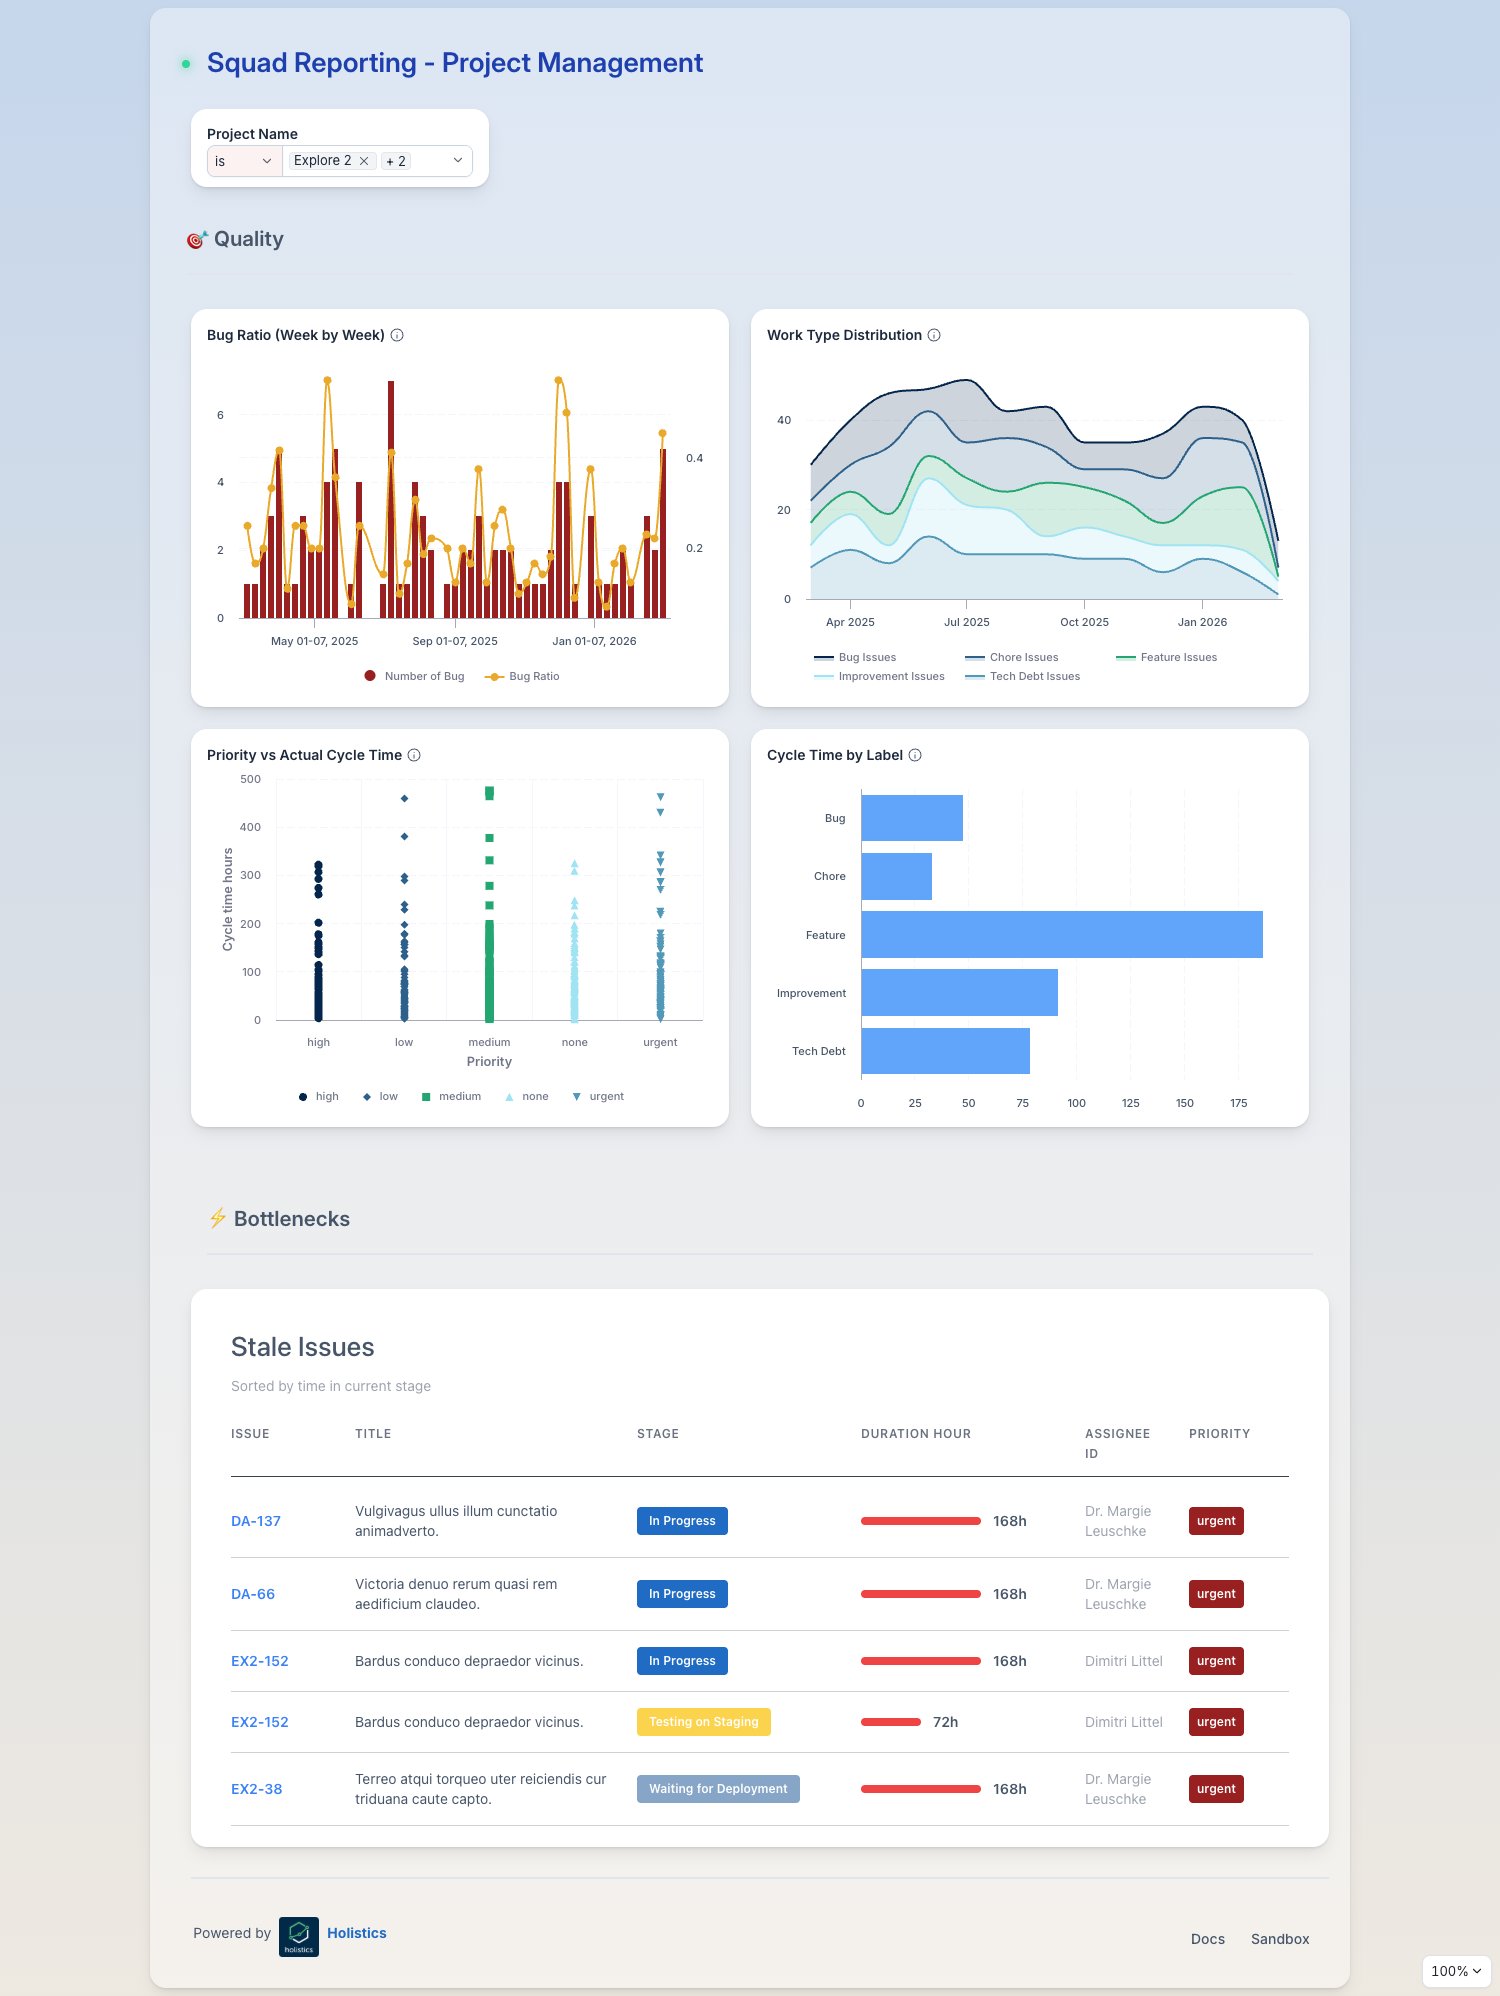
- Quality and bottleneck metrics get their own tab instead of being mixed into the overview.
- Consistent card sizing keeps the grid calm even where the content varies.
The views
Each tab is shown below at full width.
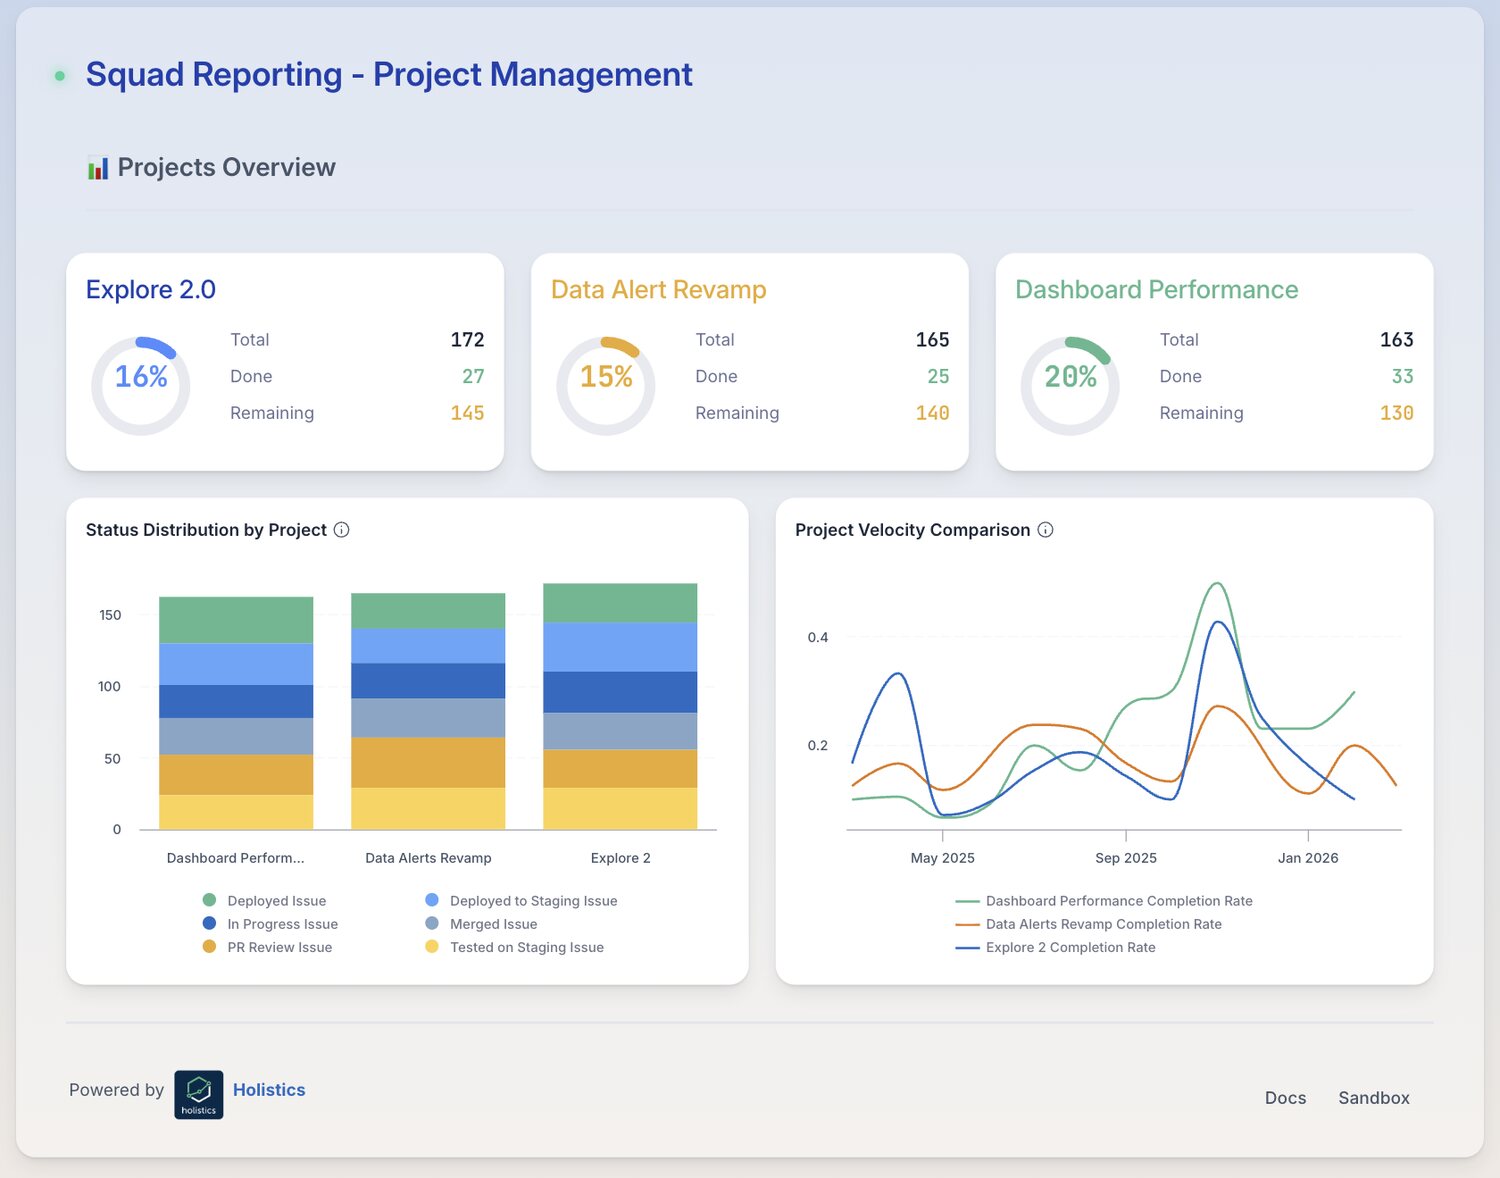
Projects Overview
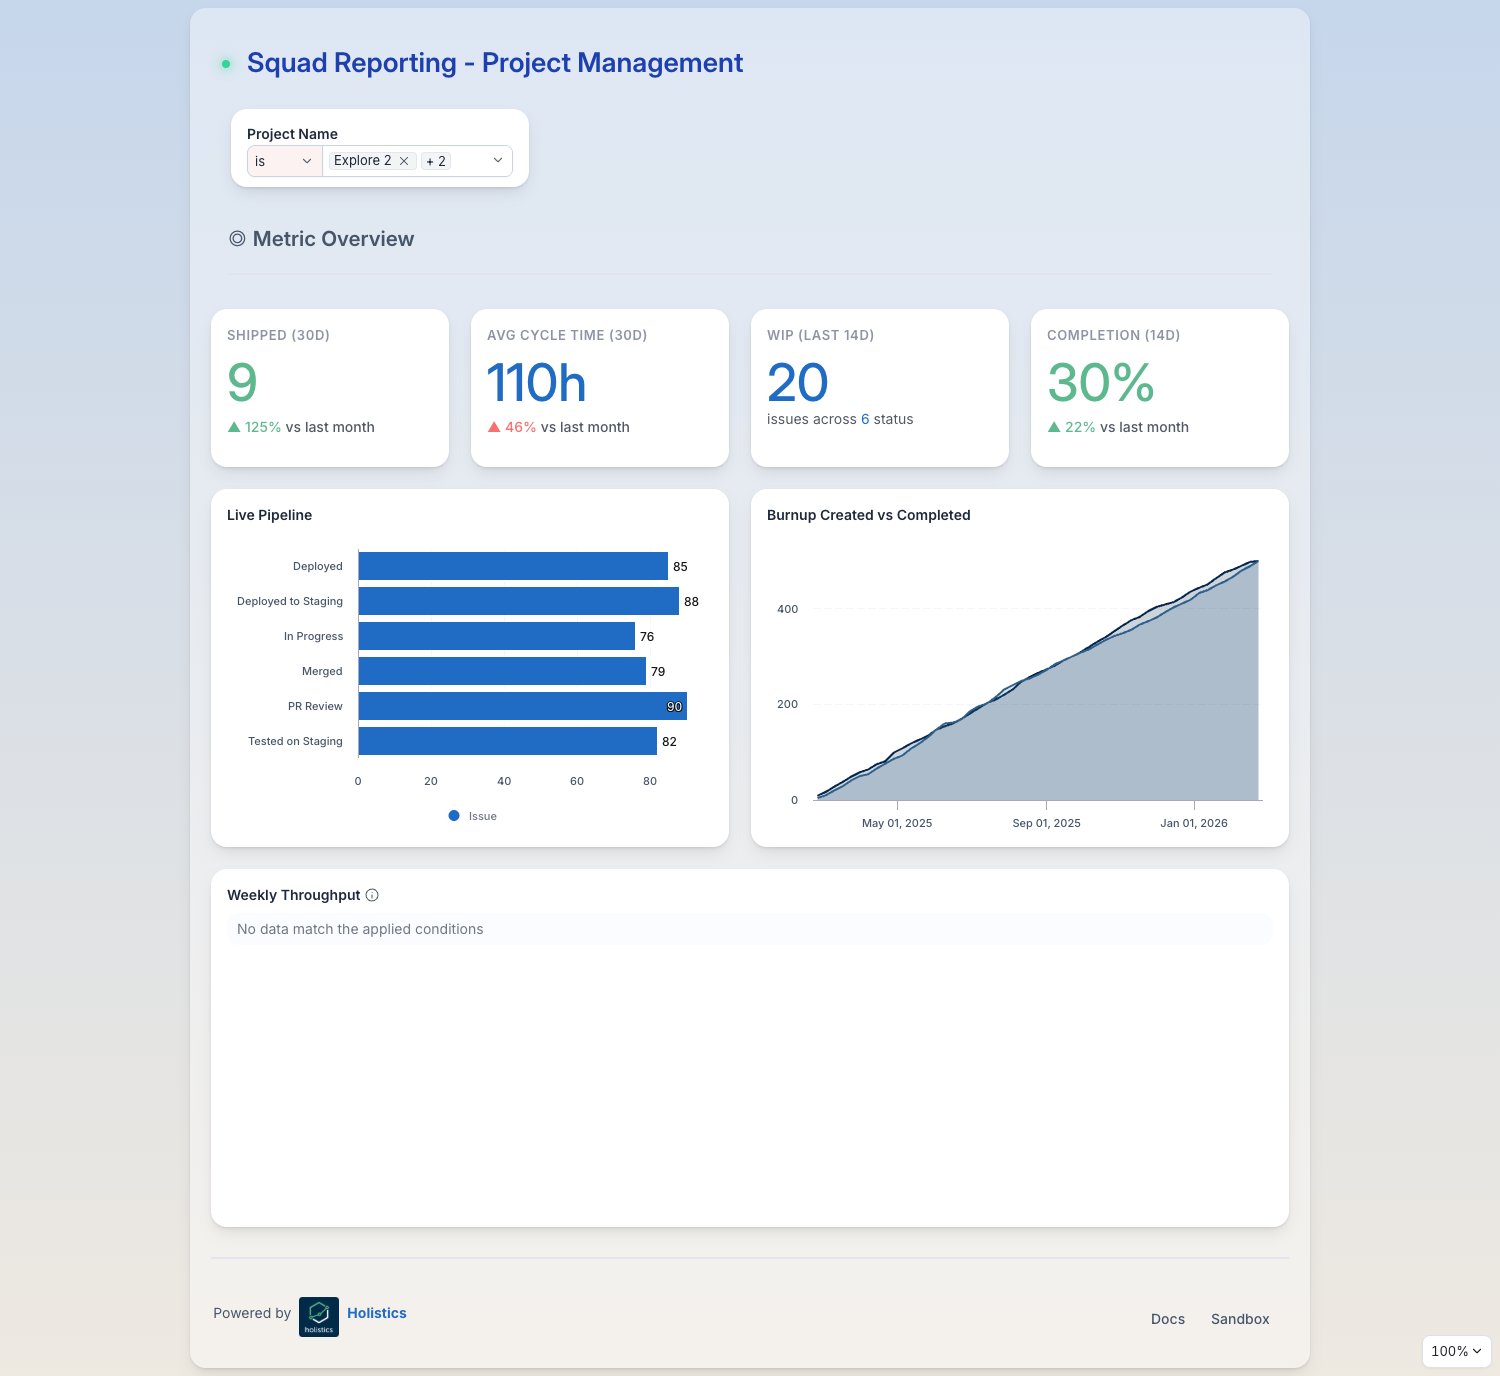
Metric Overview
Time-to-Market
Quality and Bottlenecks
See it live
Open the live dashboard to click through it yourself. No Holistics account needed.
Theme code
The theme this dashboard actually uses, written out as a reusable PageTheme. Paste it into a
.theme.aml file under Development > Library > Themes to reuse it across your own dashboards,
or inline it as a single dashboard's theme: property. Chart colour palettes are set
separately, so they are not included here.
squad_reporting_theme.theme.aml
PageTheme squad_reporting_theme {
  title: "Electric Gradient"
  background {
    bg_image: "linear-gradient(180deg, rgba(32, 107, 196, 0.2) 0%, rgba(245, 166, 35, 0.1) 100%)"
  }
  canvas {
    border {
      border_color: "#e2e8f0"
      border_style: "none"
      border_radius {
        top_left: 16
        top_right: 16
        bottom_left: 16
        bottom_right: 16
      }
    }
    shadow: "md"
    background {
      bg_color: "rgba(255,255,255,0.4)"
    }
  }
  block {
    text {
      font_color: "#475569"
      font_family: "Inter"
    }
    label {
      font_color: "#1e293b"
      font_family: "Inter"
      font_weight: "semibold"
    }
    border {
      border_radius {
        top_left: 16
        top_right: 16
        bottom_left: 16
        bottom_right: 16
      }
    }
    shadow: "md"
    padding {
      top: 16
      left: 16
      right: 16
      bottom: 16
    }
    background {
      bg_color: "#ffffff"
    }
  }
  viz {
    table {
      header {
        bg_color: "#F3F4F6"
        font_size: 11
        font_color: "#1e293b"
        font_weight: "semibold"
      }
      general {
        font_color: "#1e293b"
        hover_color: "#F9FAFB"
        banding_color: "#F5F5F5"
        grid_color: "#e2e8f0"
        border_color: "#e2e8f0"
      }
      sub_title {
        font_size: 11
        font_color: "#475569"
      }
      sub_header {
        bg_color: "#F5F5F5"
        font_size: 11
        font_color: "#1e293b"
      }
    }
  }
}
The theme is paired with custom CSS, which lives beside it rather than inside it. See Custom CSS for where it goes.
Custom CSS
/* KPI styles */
.h-kpi-metric-kpi {
font-size: 46px;
color: #1e293b;
}
.h-kpi-metric-label {
font-size: 16px;
color: #475569;
}
.h-kpi-metric-diff .friendly-diff:not(.negative) {
background: #d0fbdf;
color: #166534;
}
.h-kpi-metric-diff .friendly-diff.negative {
background: #fee2e2;
color: #991b1b;
}
/* Control variables */
.h-theme-control-block {
/* Select */
--h-select-text: #1e293b;
--h-select-placeholder: rgba(30, 41, 59, 0.6);
--h-select-border: #cbd5e1;
--h-select-border-hover: #475569;
--h-select-border-focus: #206bc4;
--h-select-trigger-icon: rgba(30, 41, 59, 0.7);
/* Input */
--h-input-disabled-bg: #F5F5F5;
--h-input-text-color: #1e293b;
--h-input-placeholder-color: rgba(30, 41, 59, 0.6);
--h-input-border: #cbd5e1;
--h-input-border-hover: #475569;
--h-input-border-focus: #206bc4;
--h-input-selection-bg: rgba(32, 107, 196, 0.2);
--h-input-trigger-icon: rgba(30, 41, 59, 0.7);
/* Badge */
--h-badge-bg: #F3F4F6;
--h-badge-text: #1e293b;
--h-badge-border: #e2e8f0;
--h-badge-hover-bg: #F9FAFB;
/* Checkbox */
--h-checkbox-hover-bg: #F9FAFB;
--h-checkbox-border: #cbd5e1;
--h-checkbox-checked-bg: #206bc4;
--h-checkbox-checked-border: #206bc4;
--h-checkbox-focus-ring: rgba(32, 107, 196, 0.2);
}
/* Checkbox text */
.h-checkbox {
color: #1e293b;
}
/* Date filter mark — synced with badge */
.h-highlightable-input mark {
background-color: #F3F4F6;
color: #1e293b;
border: 1px solid #e2e8f0;
}
/* Pivot total row */
.ag-floating-bottom .ag-cell {
background-color: #F3F4F6;
}
.ag-floating-bottom .ag-cell:not(.h-following-span) {
color: #1e293b;
}
/* Metric sheet sparkline */
.h-chart-cell {
--h-table-sparkline-color: #206bc4;
}
/* Chart axis labels */
.highcharts-xaxis-labels span,
.highcharts-yaxis-labels span {
color: #475569 !important;
}