# Show all dimension values (including empty)
> Learn how to display all users, dates, or categories in your reports, even when they have no associated data
## Introduction
Missing data in reports is a common issue. Sometimes you need to see all possible values in your dimensions, even when there's no associated data. For example:
- Show all users, including those who made no orders yet
- Display all dates in a time series, even days with no sales
This guide covers two main scenarios and how to handle each one.
## Use Case 1: Show All Users (Even with Empty Orders)
### The Problem
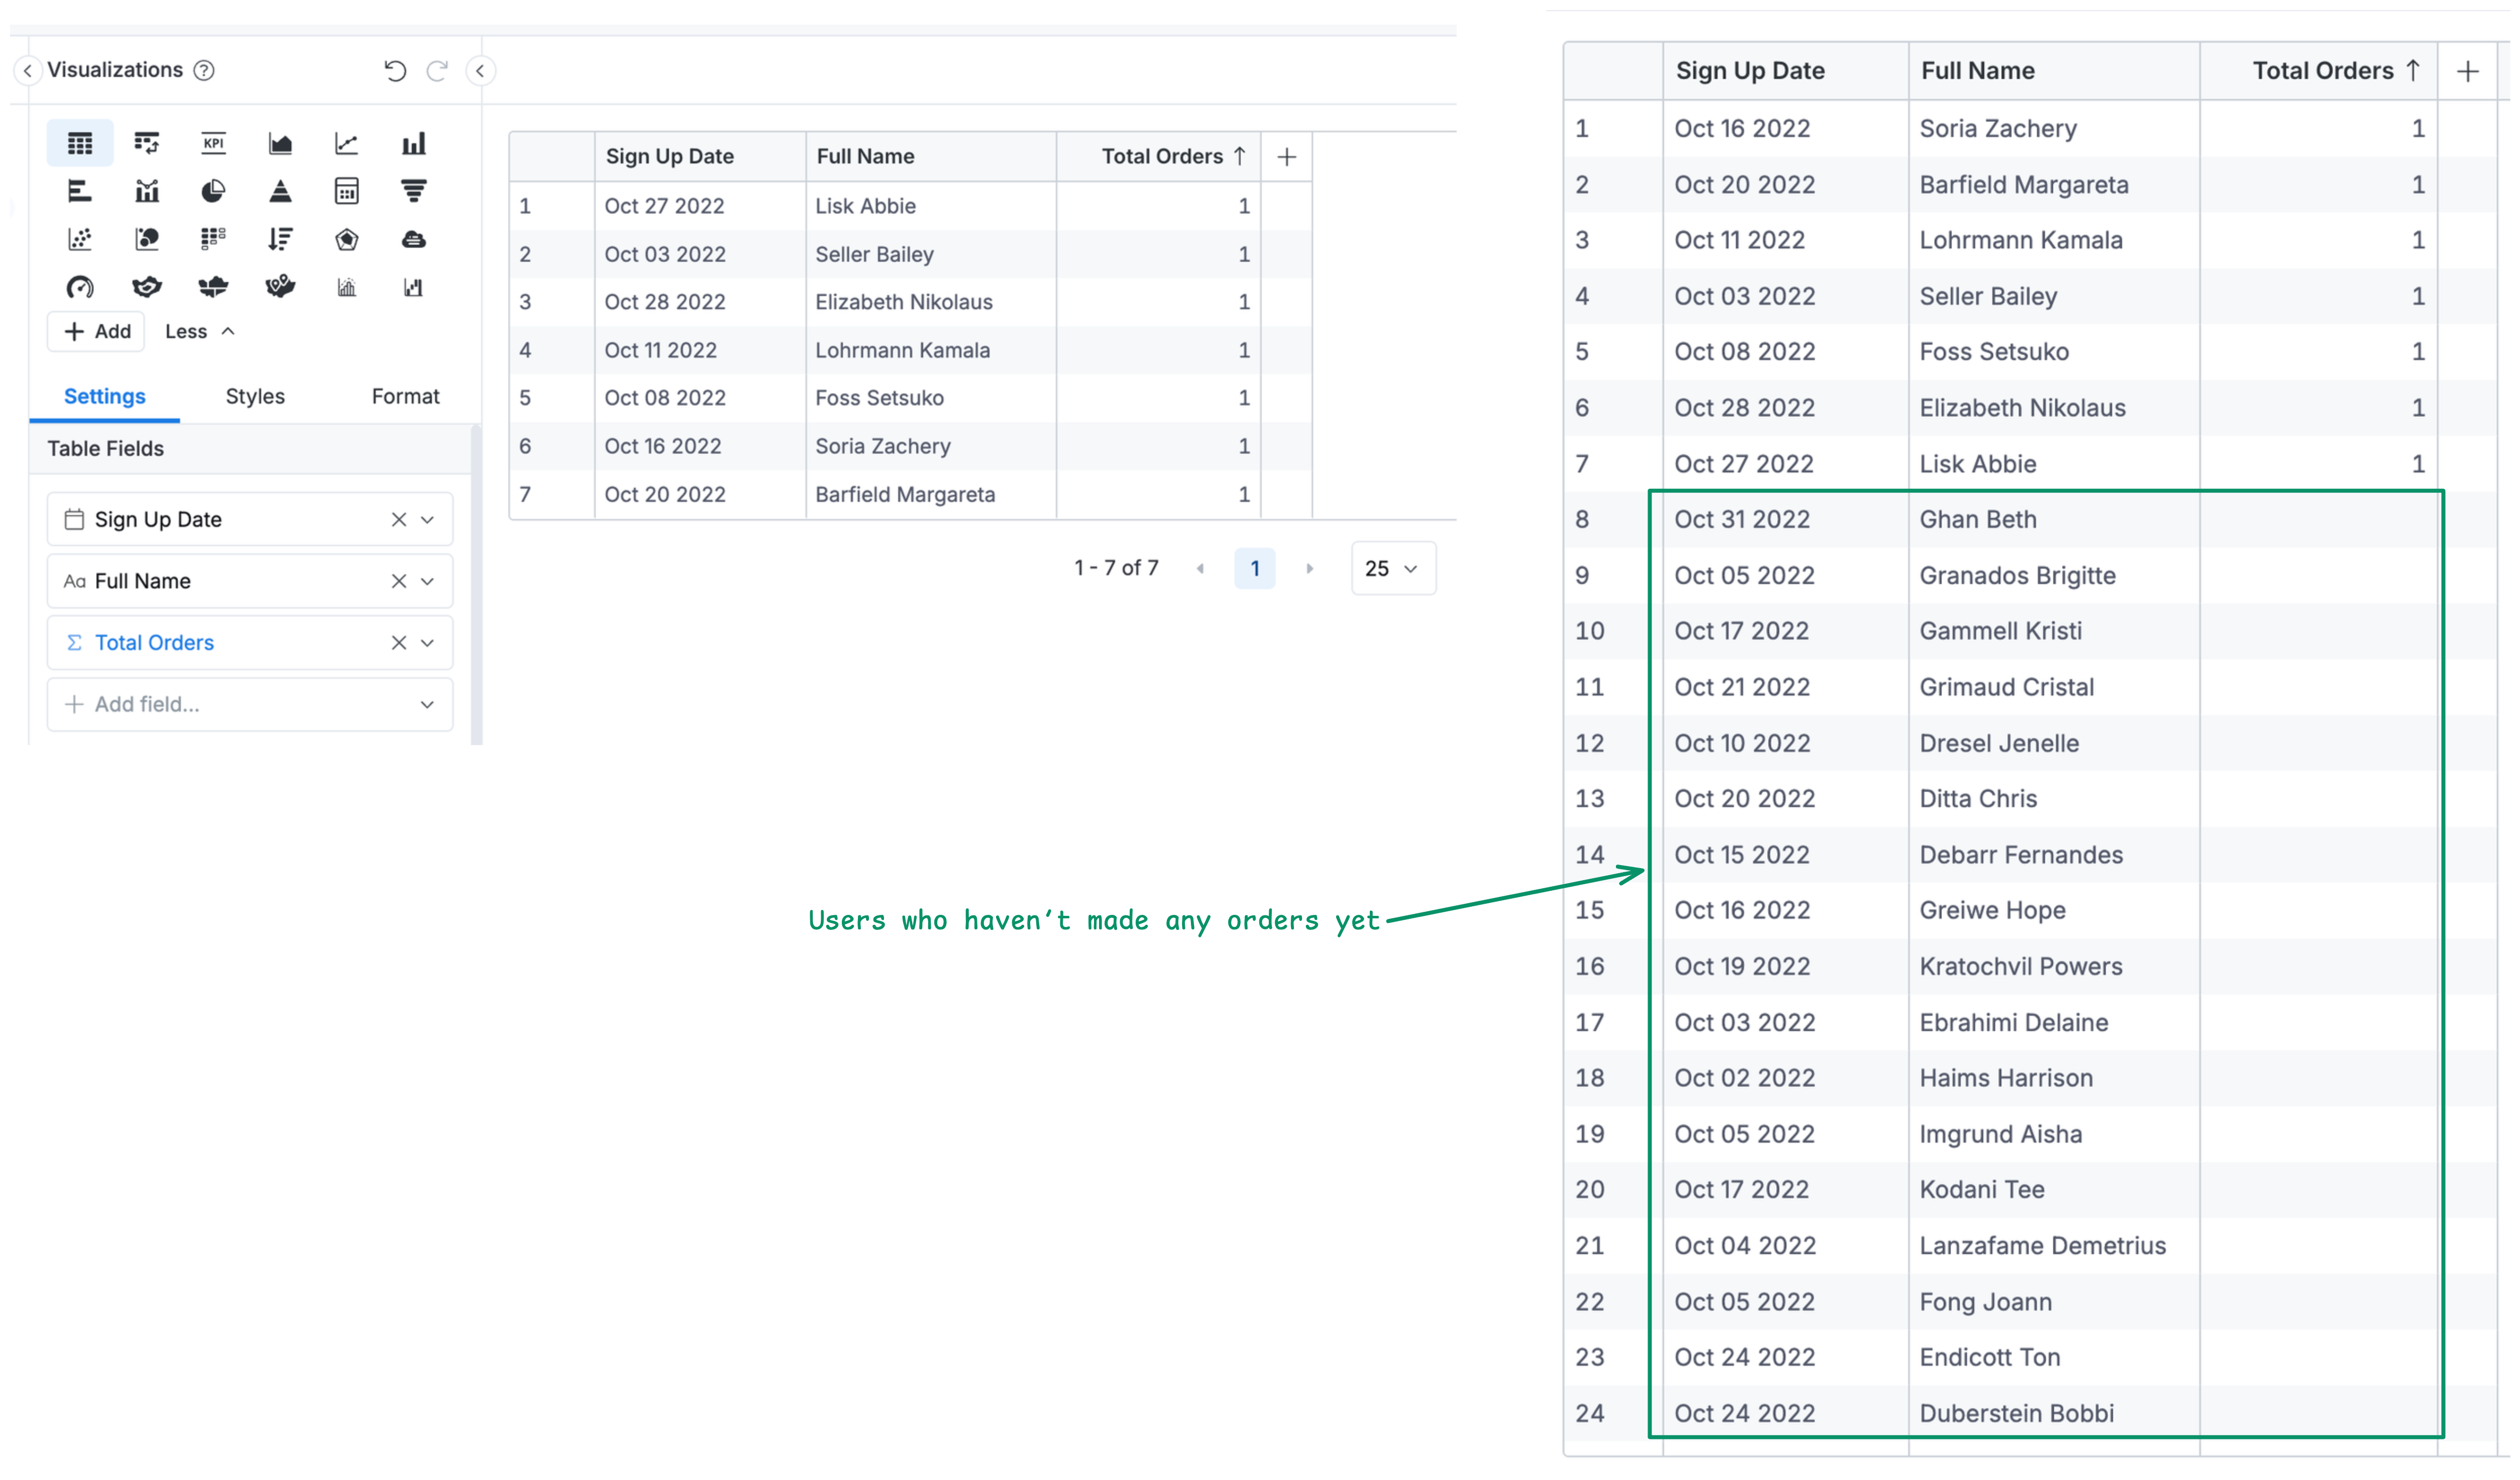
You want a table showing order counts by user, but users who haven't placed any orders are missing from the results.
### Why This Happens
Let's say we have a dataset ecommerce like this
```aml title="ecommerce.dataset.aml"
Dataset ecommerce {
...
models: [orders, users, date_dim]
relationships: [
relationship(orders.user_id > users.id, true),
relationship(orders.created_date > date_dim.date_key)
]
}
```
When Holistics explores data with metrics from the many-side of a relationship (like `orders`), it performs a LEFT JOIN from many to one. This means:
- Start from `orders` (many side) → LEFT JOIN to `users` (one side)
- Only users who have orders will appear in results
- Users with no orders are excluded because they don't exist in the starting table
For more details, visit our doc about [**How JOINS are constructed**](/docs/datasets/dataset-relationships#how-joins-are-constructed)
### High-Level Approach
Force Holistics to include all users by adding a metric from the users model (for e.g., `total users`). When a model has a metric, Holistics ensures all its rows appear in results.
```aml
explore {
dimensions {
users.full_name
}
measures {
count_orders: count(orders.id), // Your original metric
total_users: count(users.id) // Forces all users to appear
}
}
```
### Hide the Helper Metric
Since you don't want to show "Total Users" in your report, simply hide the column:
Click the column header → Hide Column. Your table now shows all users (including those with no orders) but keeps the helper metric hidden.
For more details, see [**Show/hide columns**](/docs/charts/table#show--hide-columns)
### What if you want to apply filters?
Sometimes you'll need to filter your data - for instance, you might only want to count delivered orders (where `orders.status == 'delivered'`).
Here's the catch: when you apply this filter, users without any orders disappear from your report again. Why? The filter travels from the `orders` model to the `users` model. Since some users don't have any delivered orders (or any orders at all), they get filtered out completely.
```aml
explore {
dimensions {
users.full_name
}
measures {
count_orders: count(orders.id), // Your original metric
total_users: count(users.id) // Forces all users to appear
}
filters {
//highlight-next-line
orders.status == "delivered"
}
}
```
The solution is to modify your helper metric so it stays isolated at the `users` level and isn't affected by filters on other models like `orders`. You do this by adding `keep_grains(users)` to your metric definition.
```aml
explore {
dimensions {
users.full_name
}
measures {
count_orders: count(orders.id),
//highlight-next-line
total_users: count(users.id) | keep_grains(users)
}
filters {
orders.status == "delivered"
}
}
```
For more details, see the [`keep_grains`](/as-code/reference/keep) documentation.
By keeping the metric at the `users` grain, filters on other models won't affect which users appear in your results. Users with no delivered orders will still show up with a count of zero.
This same principle applies to Use Case 2 below when working with date dimensions and filtered data.
## Use Case 2: Running Totals Across All Dates
### The Problem
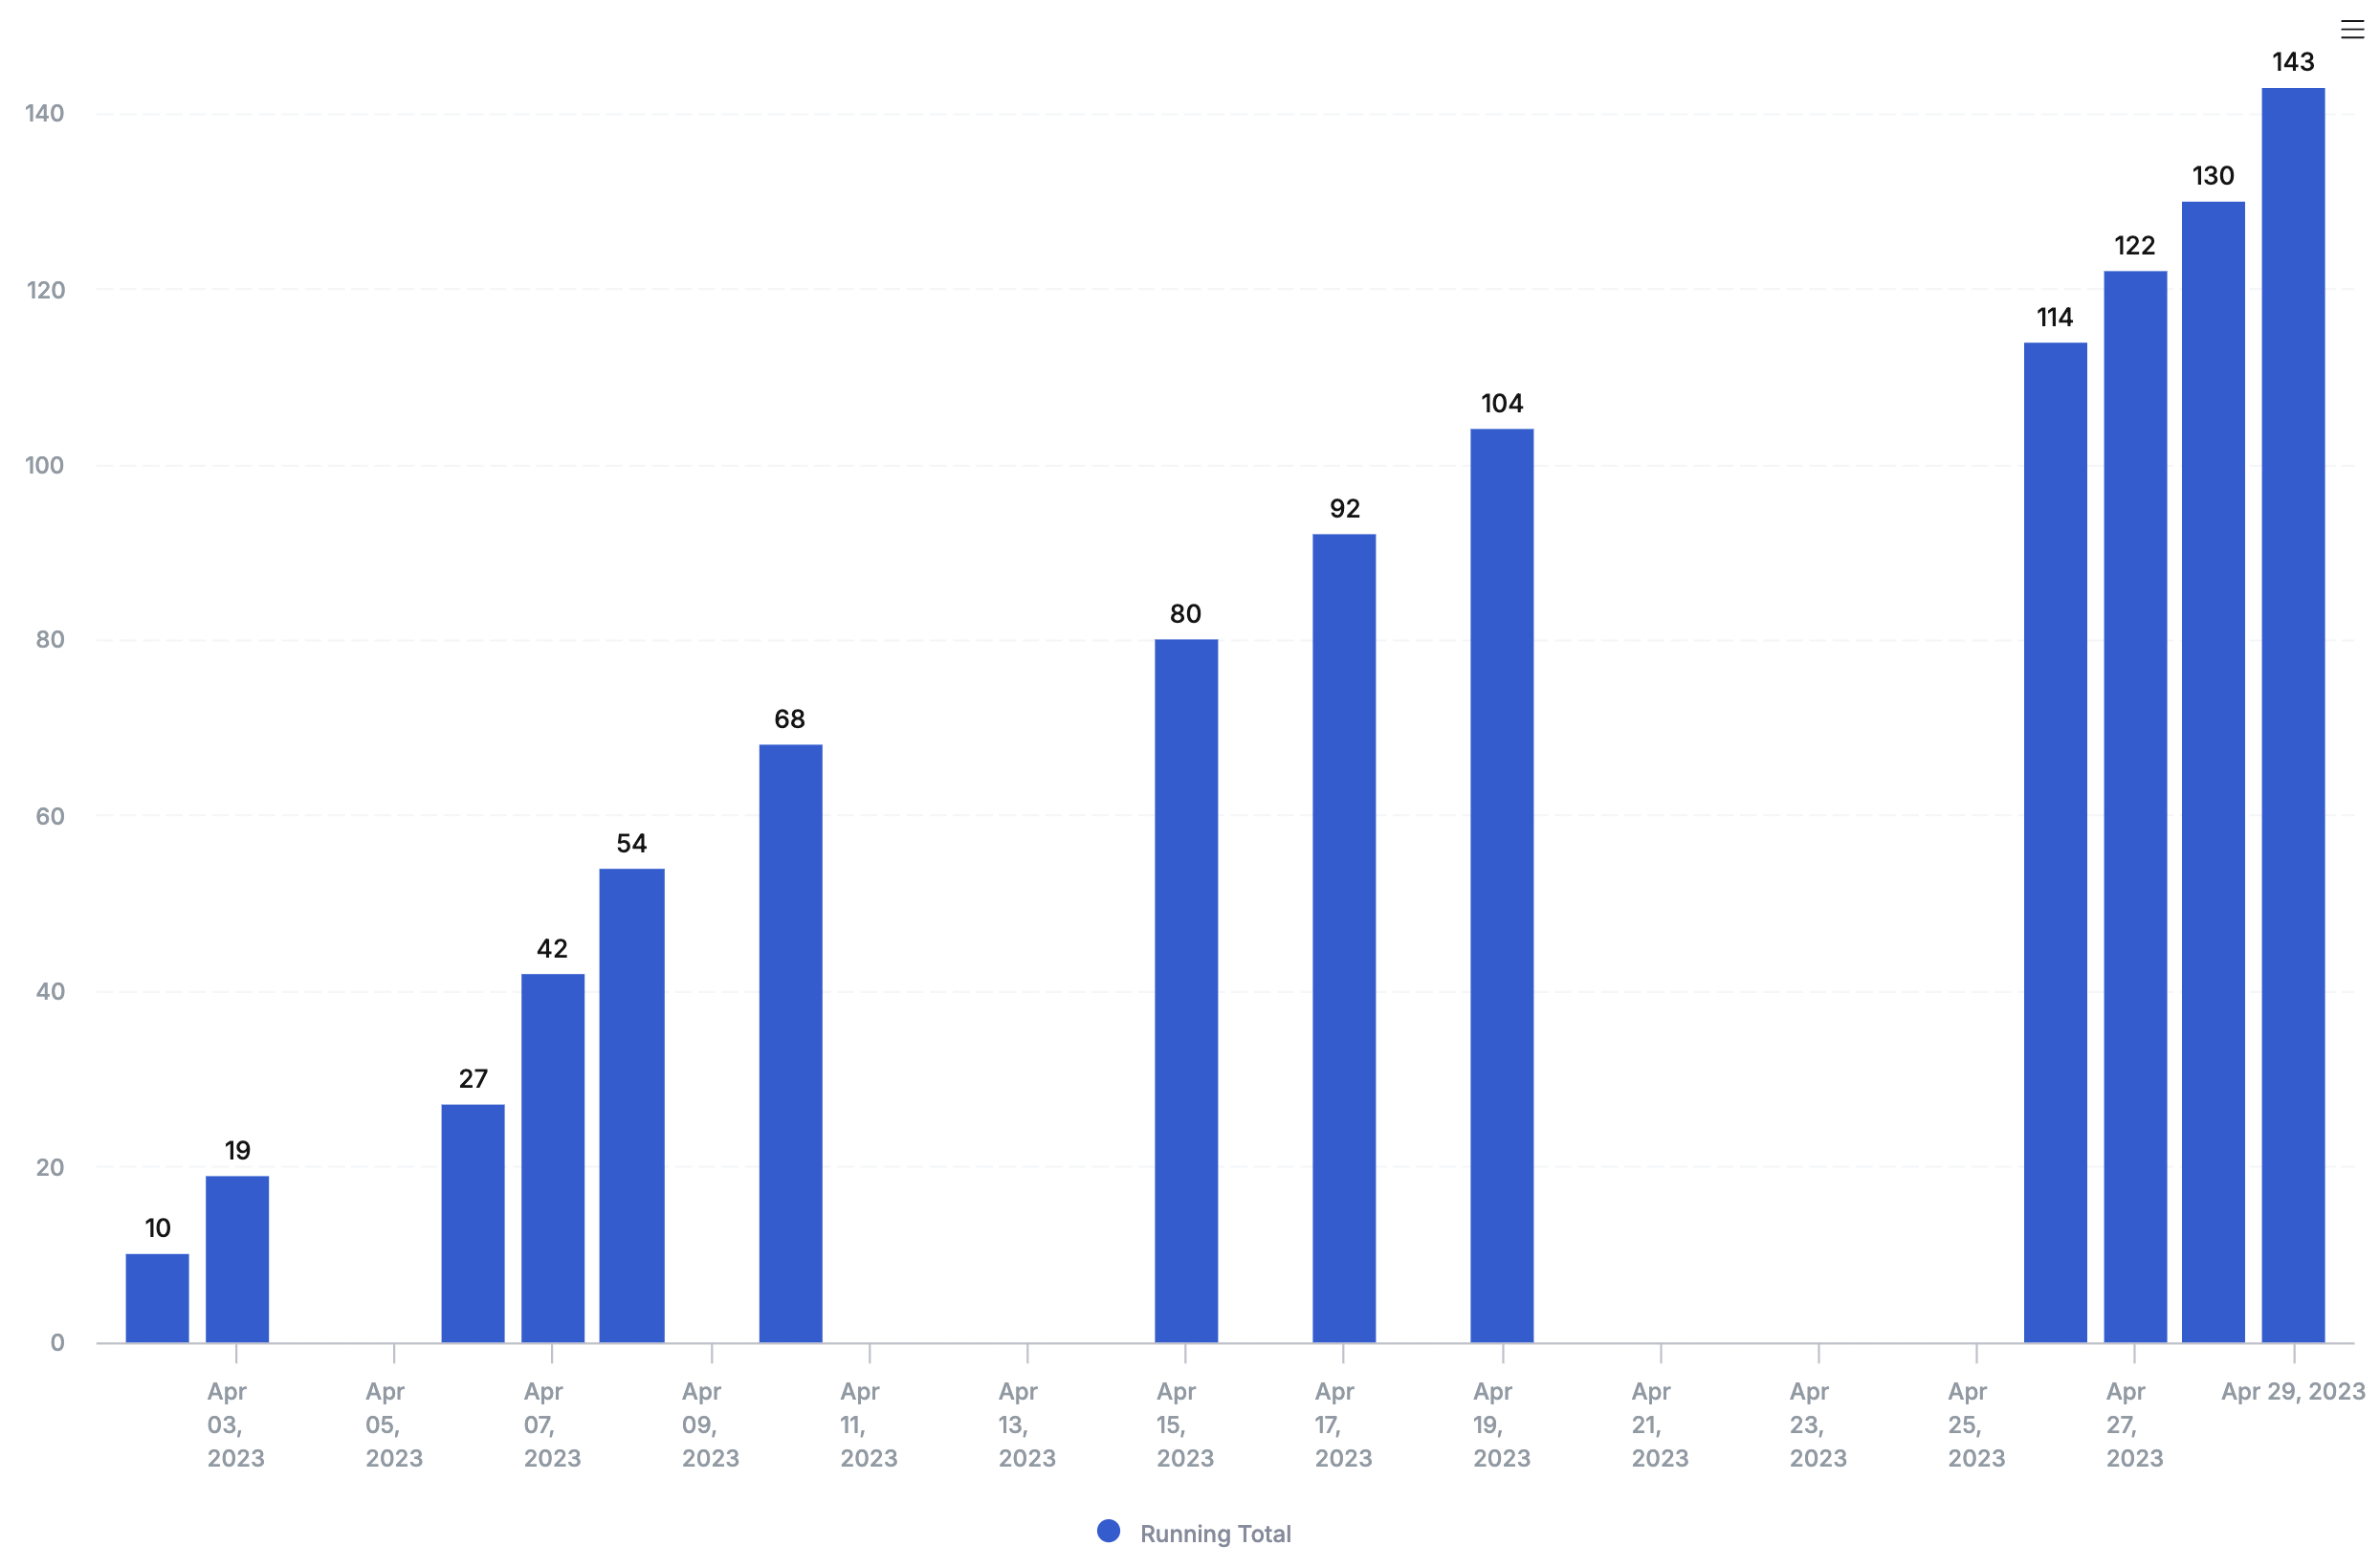
You want to create a running total chart by date, but missing dates create awkward jumps in your line chart instead of smooth continuity.
### High-Level Approach
Same principle as Use Case 1, but applied to dates: add a metric from the date dimension to force all dates to appear.
```aml title="ecommerce.dataset.aml"
Dataset ecommerce {
...
metrics running_total_orders {
label: 'Running Total Orders'
type: 'number'
definition: @aql window_sum(orders.total_orders, order: 'x_axis') ;;
}
metrics total_dates {
label: 'Total Dates'
type: 'number'
definition: @aql count(date_dim.date_key);;
}
}
```
```aml
explore {
dimensions {
date_dim.date_key
}
measures {
running_total_orders: running_total_orders,
total_dates: total_dates // Forces all dates to appear
}
}
```
### Hide the Helper Metric
Since charts work differently than tables, you have several options to hide the helper metric:
#### Option 1: Use tooltips
Add the helper metric to tooltips instead of the main visualization:
This keeps your chart clean while ensuring all dates appear.
#### Option 2: The mathematical trick
Combine the helper with your main metric to make it invisible:
```aml
measure running_total_all_dates {
type: "number"
definition: @aql
running_total(count(orders.id)) + count(date_dim.date_key) - count(date_dim.date_key)
;;
}
```
This adds and subtracts the same value, forcing inclusion without changing results.
#### Option 3: Use conditions
Add the helper metric to visualization conditions instead of displaying it:
Set the condition: `count(date_dim.date_key) > -1`
Since count is always 0 or positive, this condition is always true and forces all dates to appear without showing the metric.
## When NOT to Use This
- **Large dimension tables**: Showing all 1 million users might affect the performance. Consider filtering first (e.g., users from last 3 months)
- **Irrelevant dimensions**: Not every report needs every possible value
## Related Concepts
- [Understanding Dataset Relationships](/docs/datasets/dataset-relationships)
- [Customizing Table Visualizations](/docs/charts/table)
- [Working with Tooltips](/docs/charts/customizing-chart-tooltip)