Customize client dashboards from a shared template
Introduction
Embedding already lets you serve one dashboard to many clients: permissions filter each viewer to their own data, and Dynamic Data Sources can route each client to their own database. That covers most multi-client setups without any extra work.
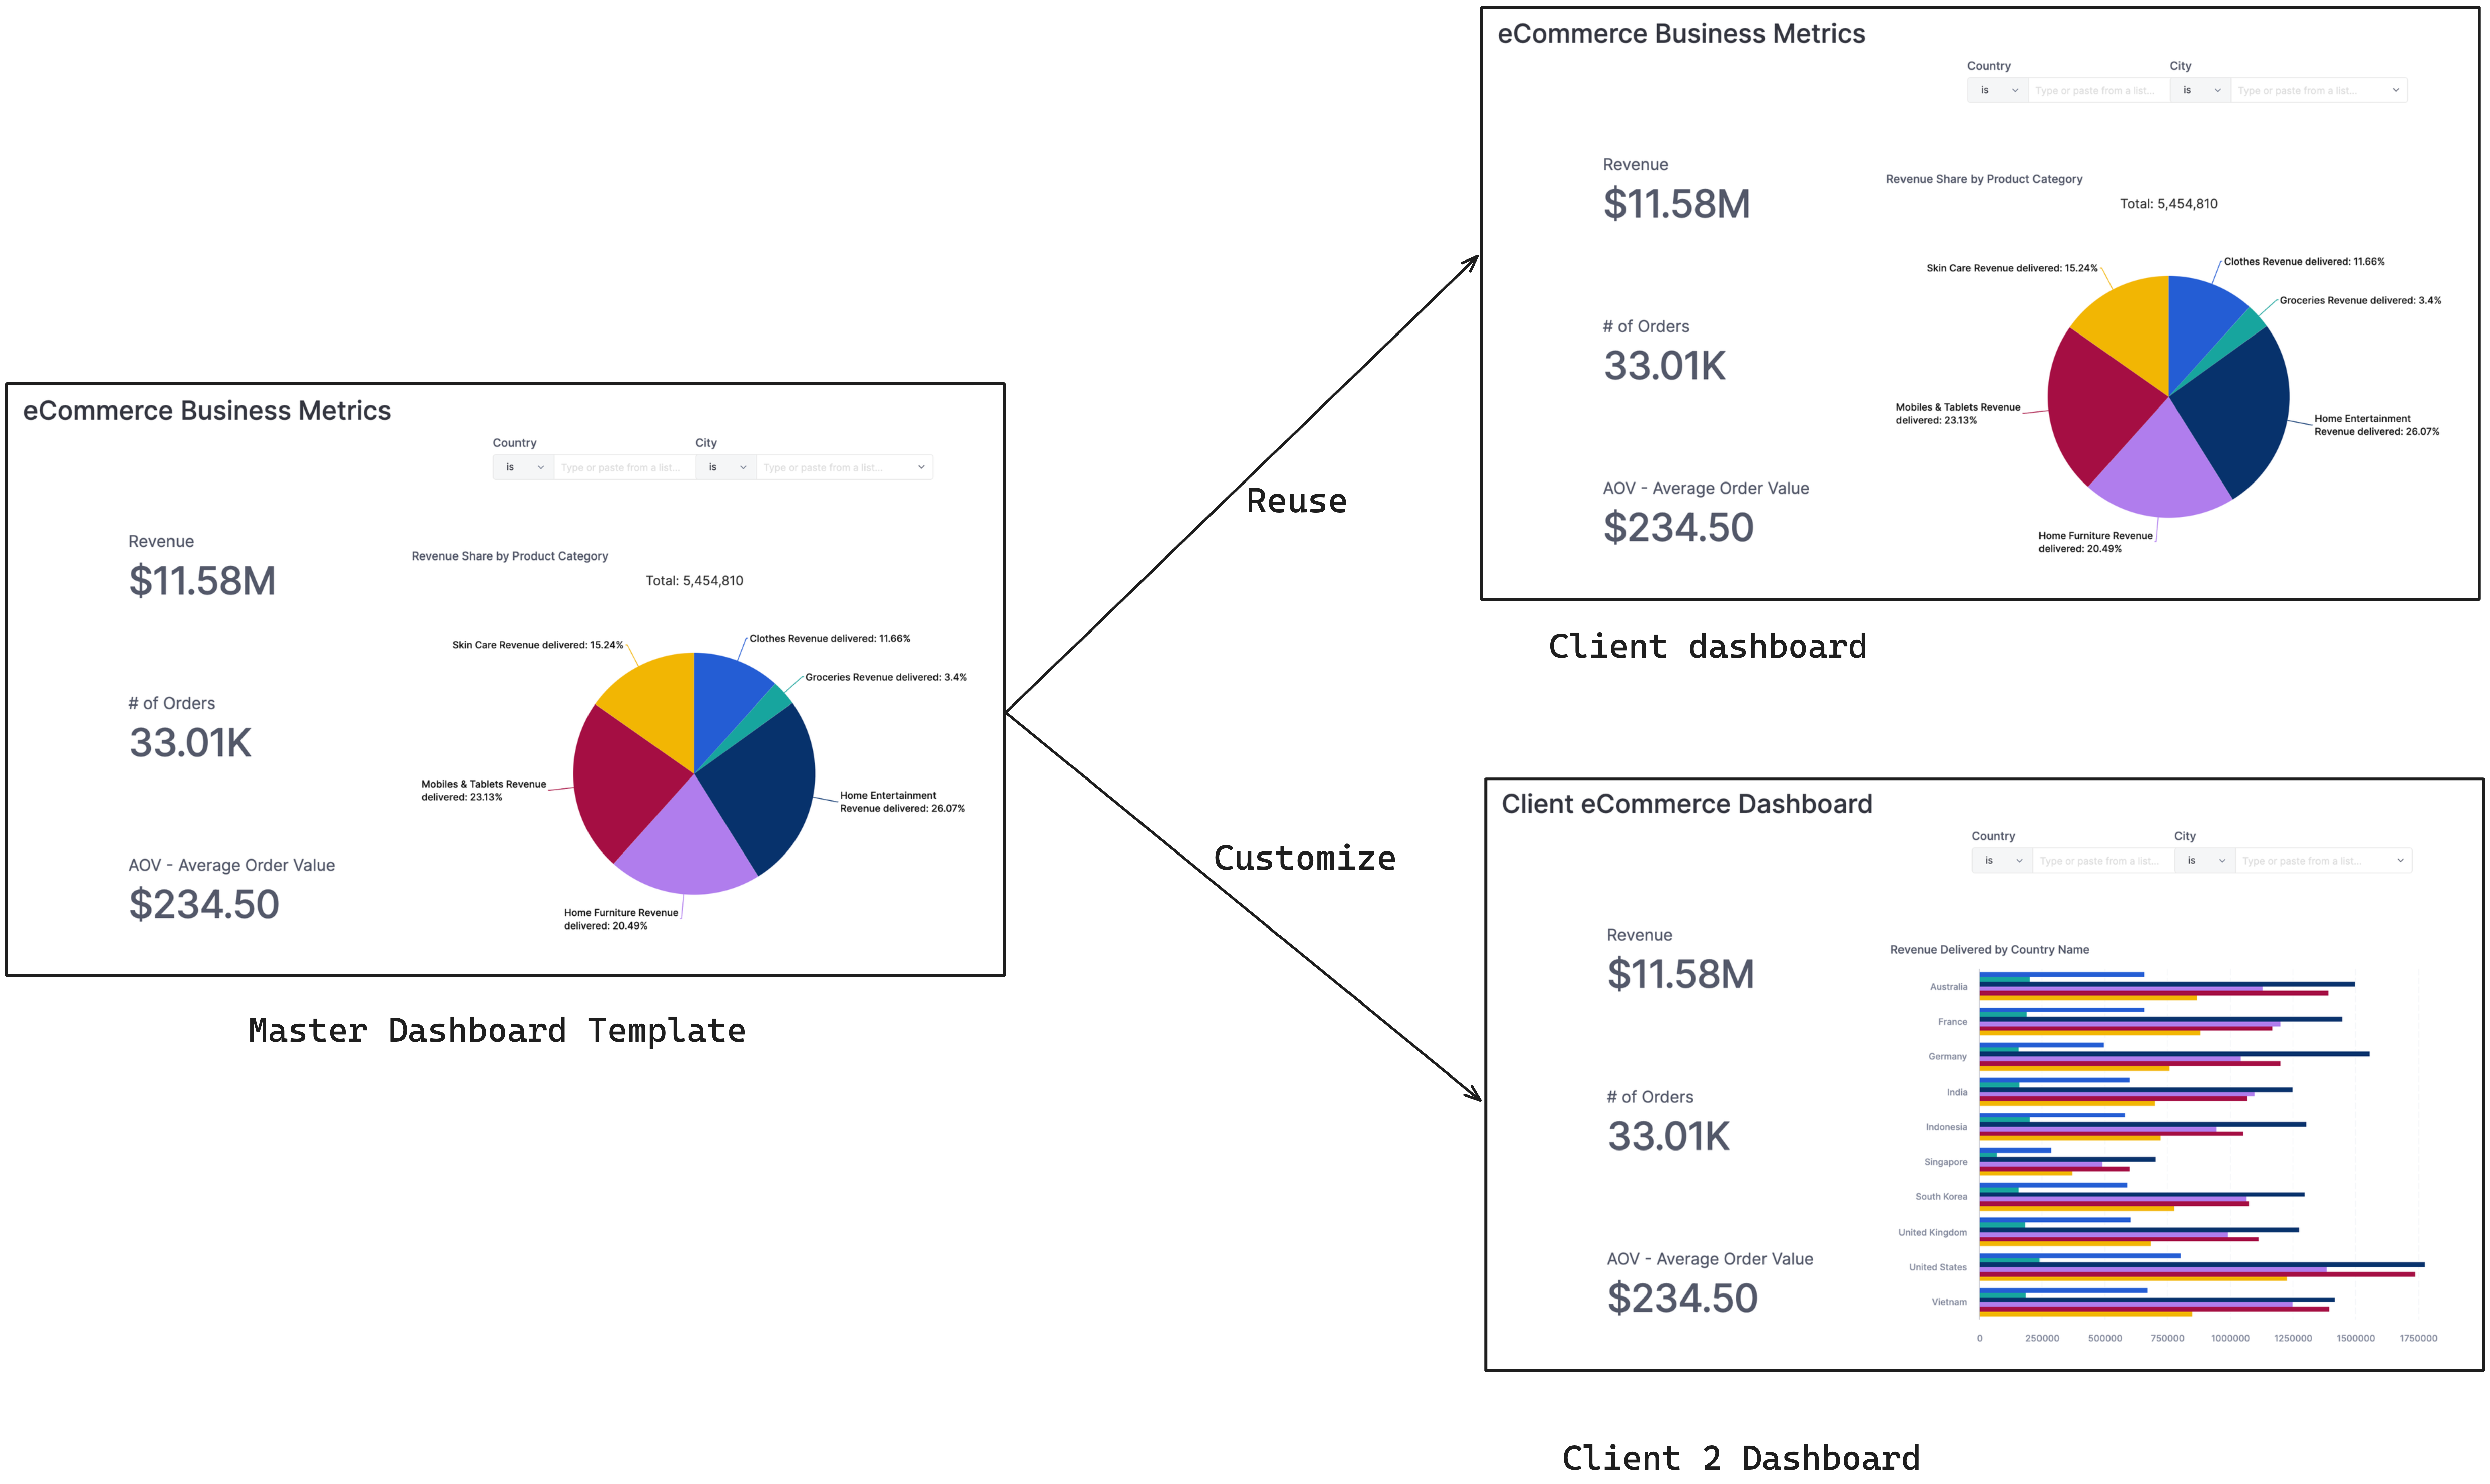
But sometimes clients need dashboards that look different from each other, not just show different data. One client wants an extra chart, another wants a different layout. Building each of these from scratch means maintaining several near-duplicate dashboards, where every shared update has to be repeated by hand.
This is where a master dashboard template helps: define the shared structure once, then use AML Extend to build each client's dashboard from it, overriding only what's different for that client.
- Reusability: update the template once, and the change propagates to every client dashboard that extends it.
- Client-specific customization: add or override charts in one client's dashboard without touching the template or any other client.
You can still combine this with per-client data sources when needed. See Point each client dashboard to its own data source below.
Step-by-step solution
- Define a master dashboard template with reusable chart components.
- Build client dashboards from the master dashboard template. Updating the template should propagate changes to all client dashboards.
- Customize specific client dashboards. Add or override charts in a specific client dashboard without affecting the template or other clients.
- (Optional) Point each client dashboard to its own data source. Combine with a dynamic dataset if clients also need their own data, not just their own charts.
Define a master dashboard template
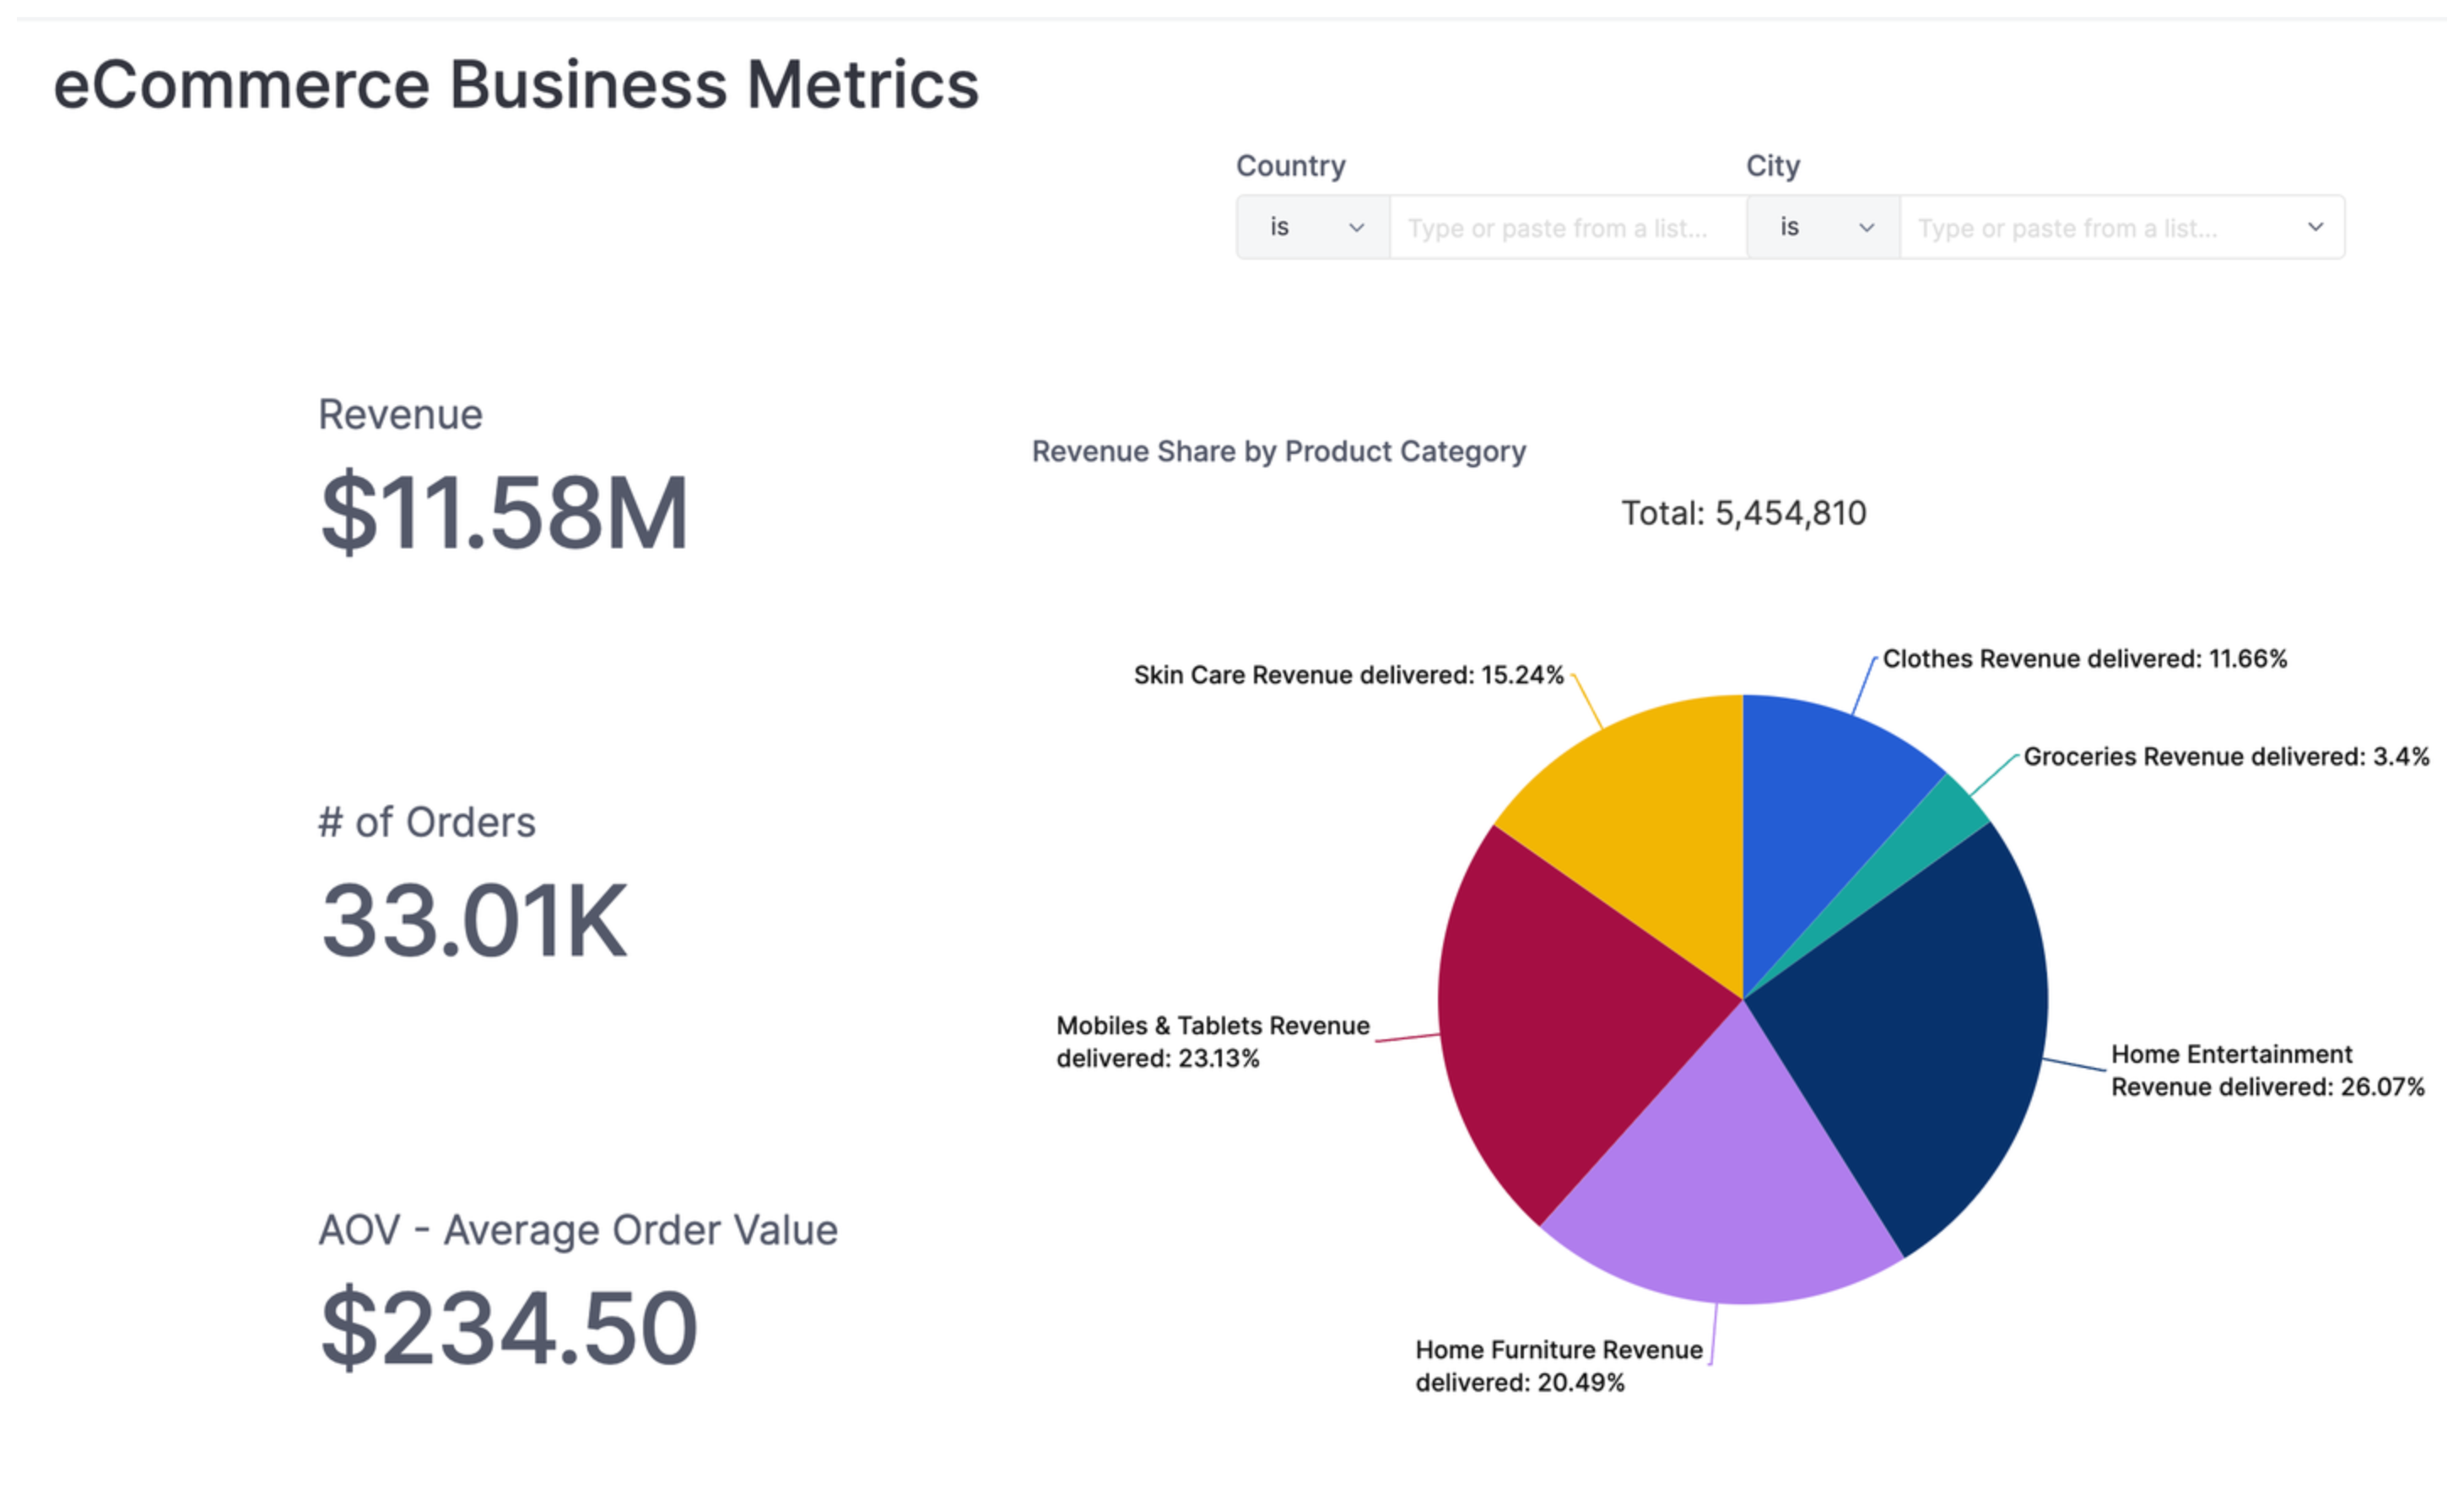
Create a master dashboard template as follows:
// In master_template.page.aml

// Define master dashboard template
Dashboard master_dashboard_template {
  title: 'eCommerce Business Metrics'
  block v1: VizBlock {
    viz: PieChart {
      // A default dataset. Can refer to client's dataset later
      dataset: default_dataset
      //...
      settings {
        // This draws the chart as a donut
        display_as_donut: false
        // ...
      }
    }
  }
  // ...
}
Build client dashboards from the master dashboard template
Once you define a dashboard template, use AML Extend to build client dashboards. Extending a dashboard lets you inherit all of its properties, including titles, charts, filters, and settings.
// In client_dashboard.page.aml
// Extend the master dashboard template into a client dashboard
Dashboard client_dashboard = master_dashboard_template.extend({})
The client dashboard will look the same as the master dashboard template.
Let's edit the pie chart in the master dashboard template so that it shows a donut instead of a pie.
// In master_template.page.aml
Dashboard master_dashboard_template {
  title: 'eCommerce Business Metrics'
  block v1: VizBlock {
    viz: PieChart {
      // A default dataset. Can refer to the client's dataset later
      dataset: default_dataset
      //...
      settings {
        // Changed this to `true` to display a donut pie
        display_as_donut: true
        // ...
      }
    }
  }
  // ...
}
You should see changes being reflected in the client dashboard.
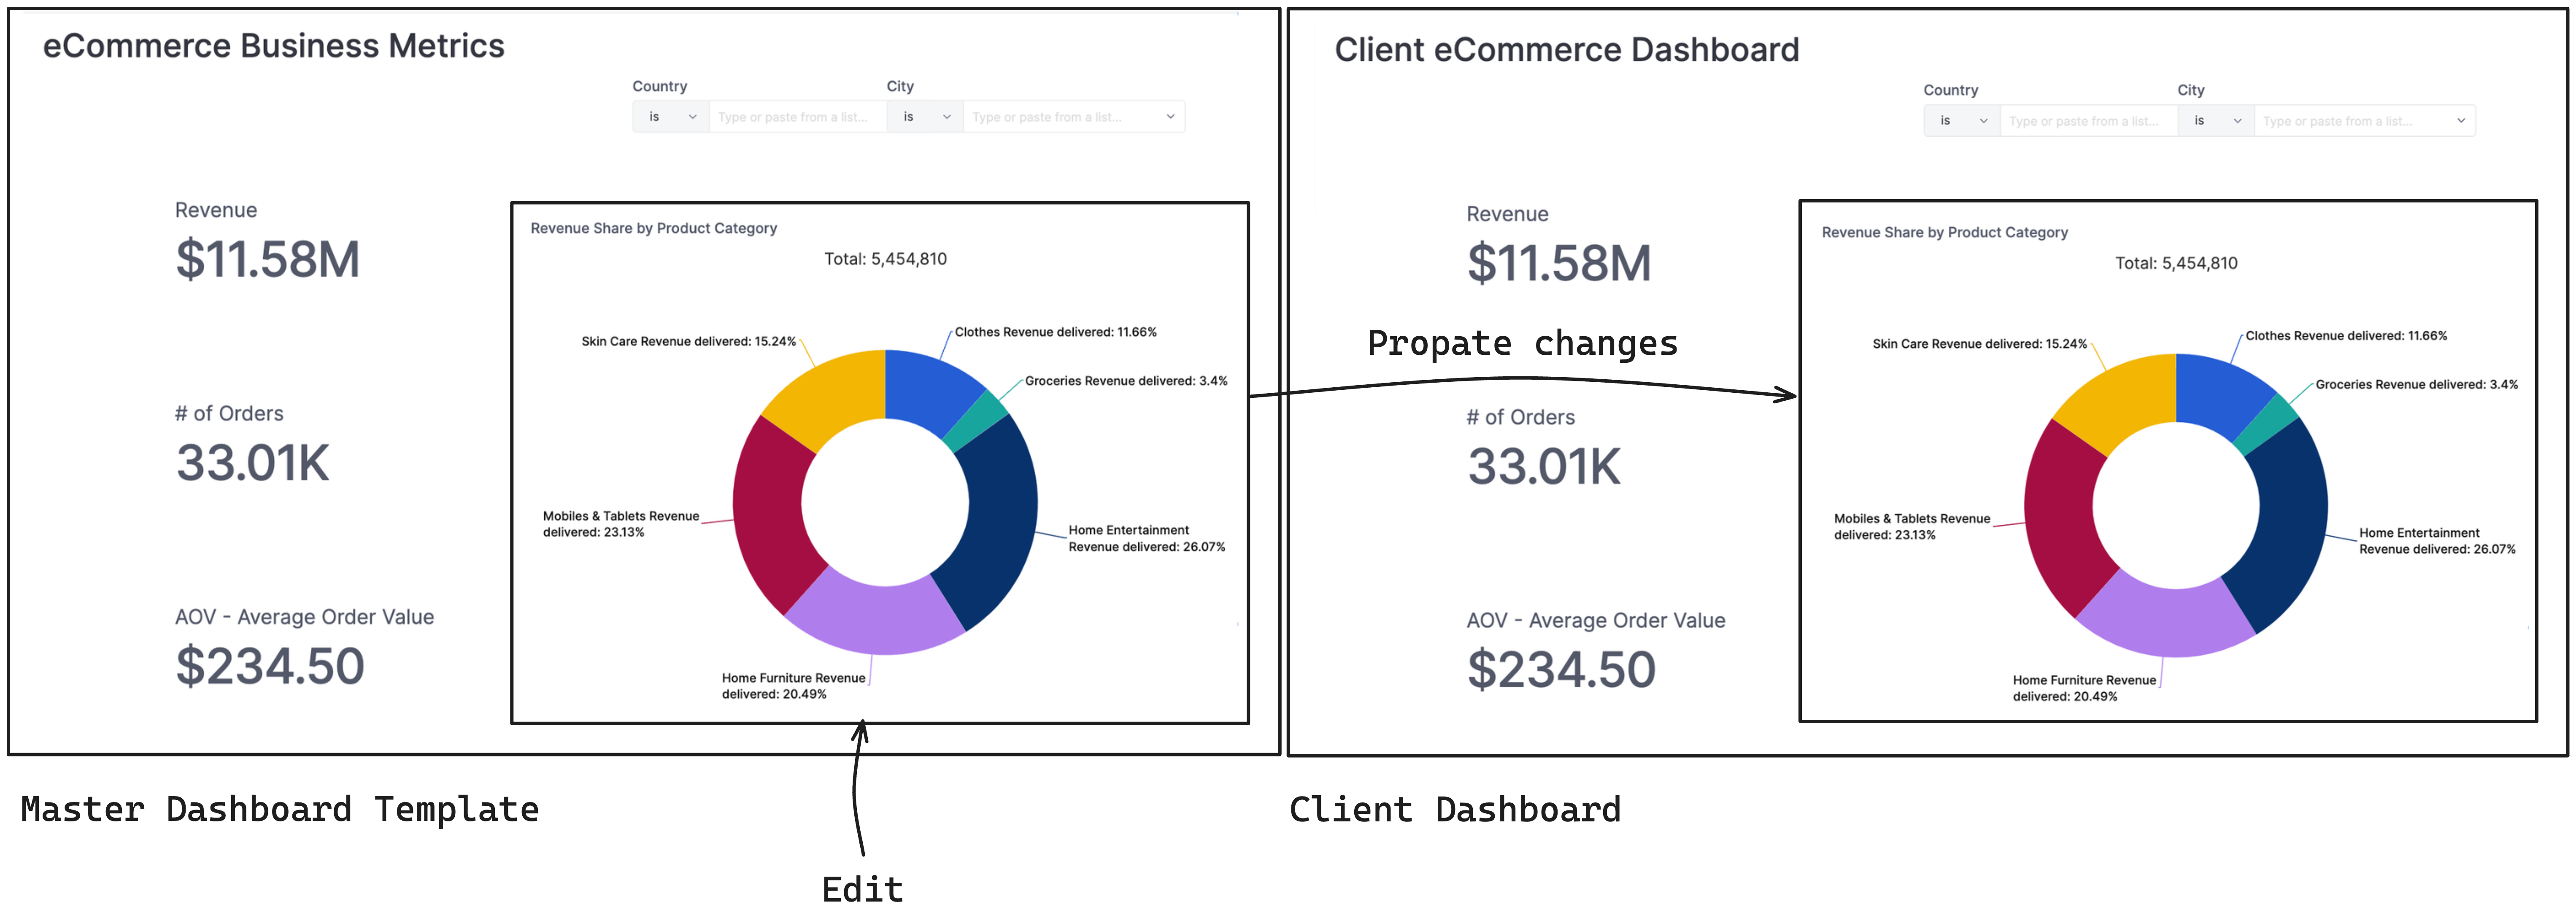
By extending the master dashboard template, you can add/edit the template and have changes propagated to all client dashboards automatically.
Customize specific client dashboards
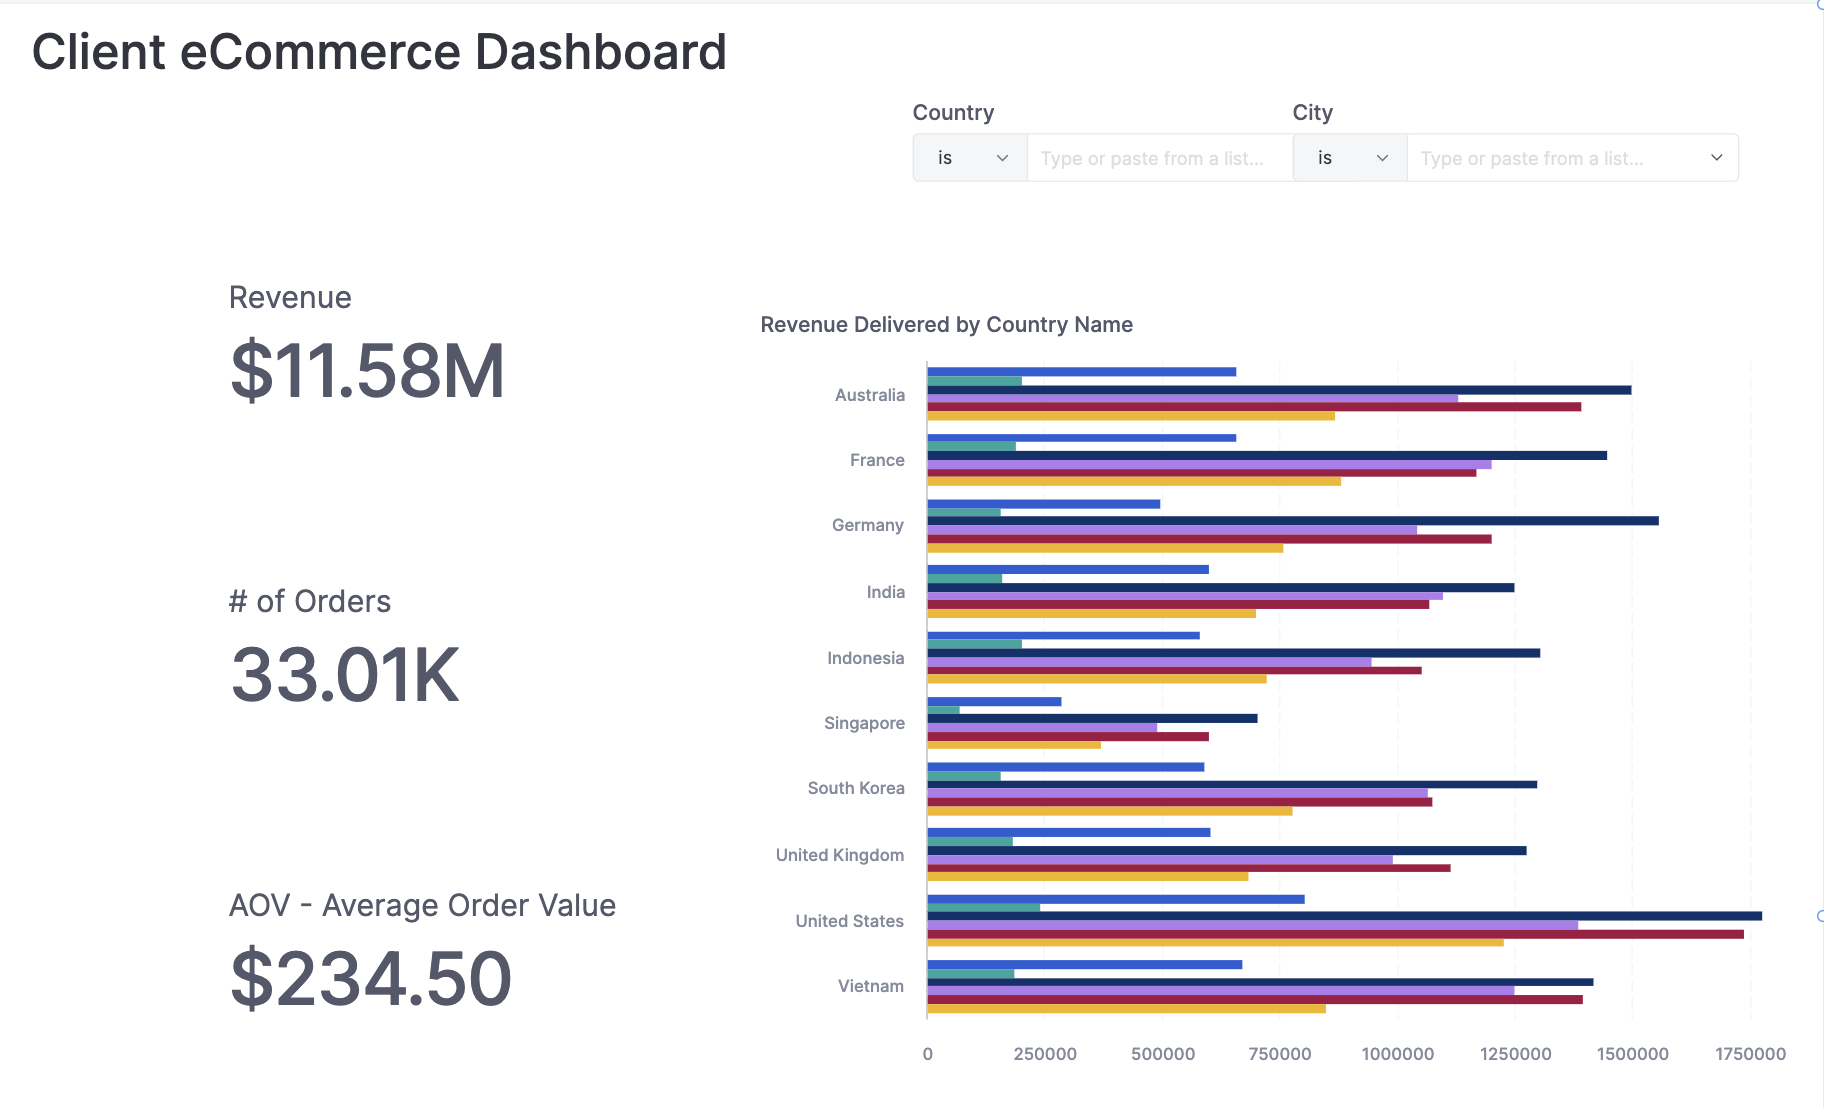
You can also use AML Extend to override a chart in the dashboard template. Define a new bar chart and use this instead and of the pie chart.
// In client_dashboard.page.aml
Dashboard client_dashboard = master_dashboard_template.extend({
// Define a bar chart for revenue share instead of a pie chart
  block v1: BarChart {
      dataset: default_dataset
      // ...
    }
  }
})
Now the client dashboard will use the bar chart instead of the pie chart. This doesn't affect the dashboard template or any other client dashboards you may have.
Point each client dashboard to its own data source
So far, every client dashboard has used the same default_dataset. If your clients also need to see their own data, not just their own charts, you can pass a dataset into a chart via an AML Function:
// In client_dashboard.page.aml
// Refactor this function to accept a dataset param
Func getRevenueShareBarChart(dataset_param) {
  VizBlock {
    viz: BarChart {
      // Use the dataset param instead of hard-coded value
      dataset: dataset_param
      // ...
    }
  }
}

Dashboard client_dashboard = master_dashboard_template.extend({
  // Call the function with the client's actual data source
  block v1: getRevenueShareBarChart(client_dataset);
})
For most cases, prefer Dynamic Data Sources: it routes each client to their own database automatically based on the embed payload, so you don't have to pass a dataset into every chart manually.
See also
- Dynamic Data Sources: route each client's dashboard to their own database automatically based on the embed payload.
- AML Extend: full reference for extending dashboards, datasets, and other AML objects.