Period Comparison (Date & Time)
Introduction
Period Comparison enables non-technical users to visually compare data from different time periods, like comparing revenue data this quarter with same quarter last year.


Setting up
The general steps are as follows:
- Select (at least) an aggregrated field or measure from dataset
- Enable Period Comparison in Visualization Settings
- Select a date field used for period comparison
- Select Comparison Type & Period to compare
- Filter the Period Comparison's Date Field (optional): Require if you're using a non-time-series chart. Read below to learn more about this case.
Mechanism
Period Comparison supports two types of comparison:
- Previous period: a relative time shift from the original timeframe (Example: compare with 2 months ago)
- Custom period (Beta): an absolute timeframe chosen by you (Example: compare with range 2022-05-24 to 2022-08-11)
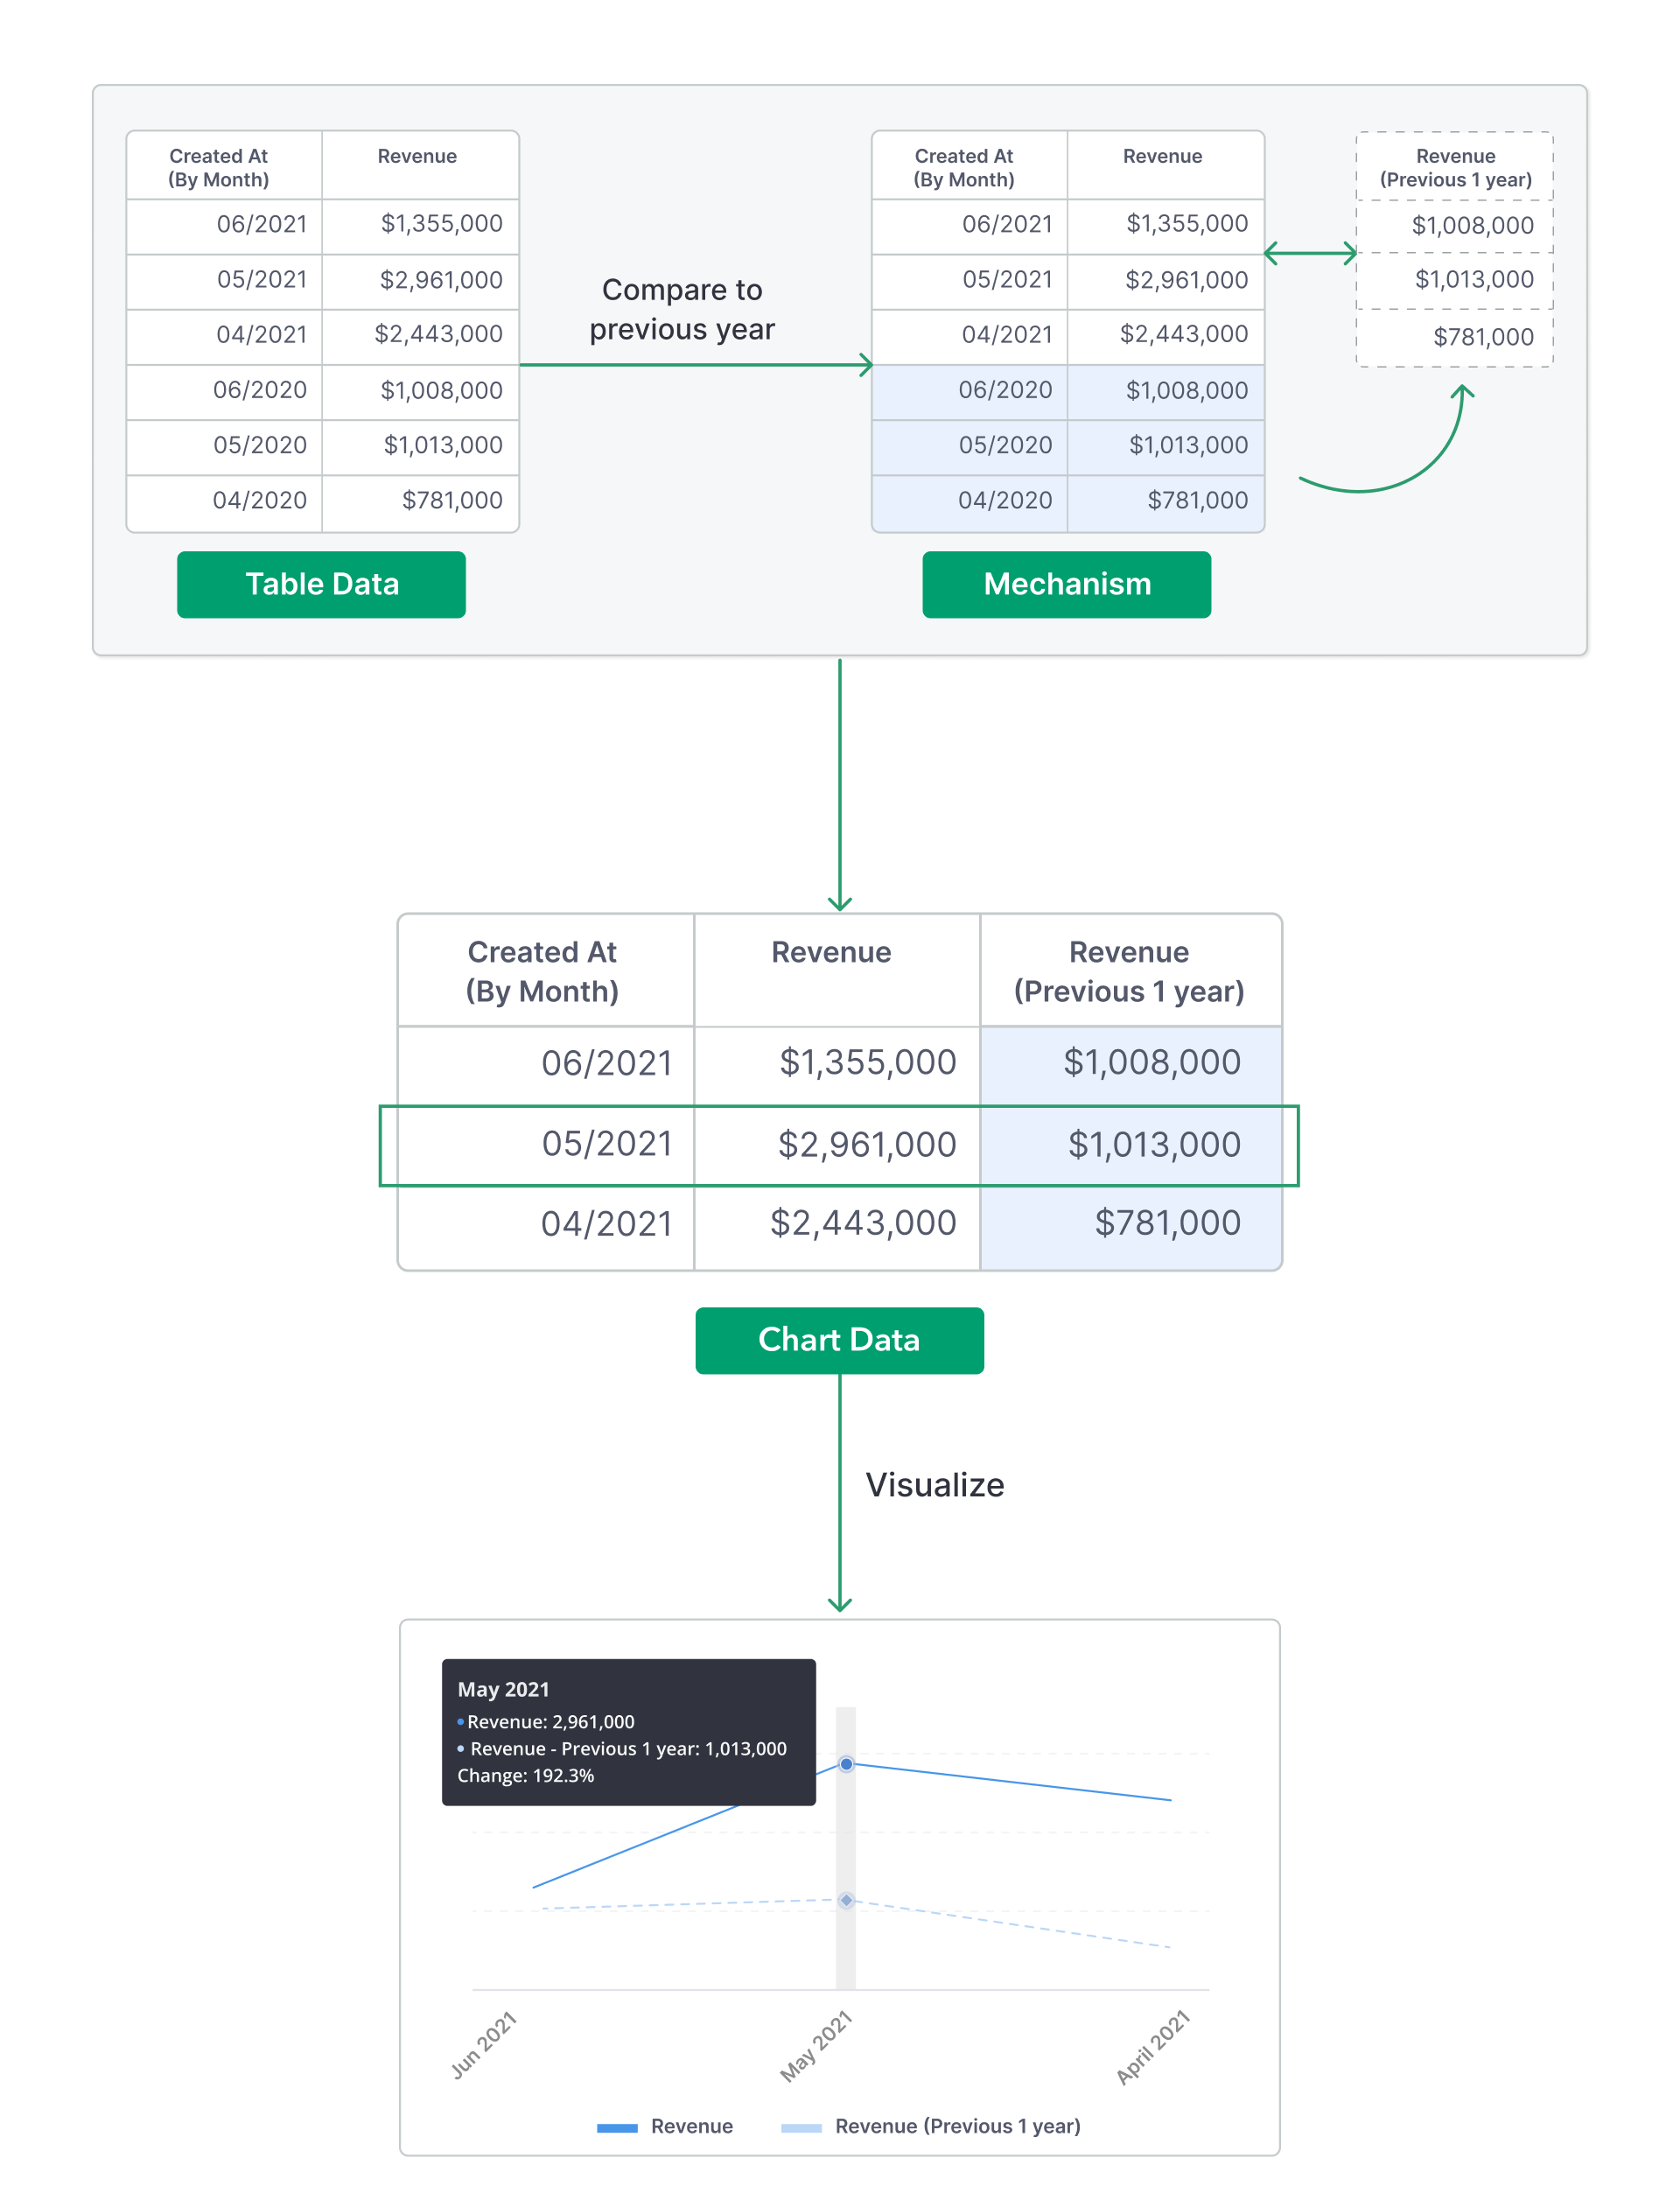
1. Previous period Comparison
Period Comparison measures metrics in the present and compares them to a comparable period of time in the past. The goal is to adjust the slice of the past you are looking at, so the same amount of time has passed in the two periods you are comparing.
For each metric, Period Comparison will generate an additional data series whose data points are shifted by a certain time. Then two series will be overlaid on top of each other.
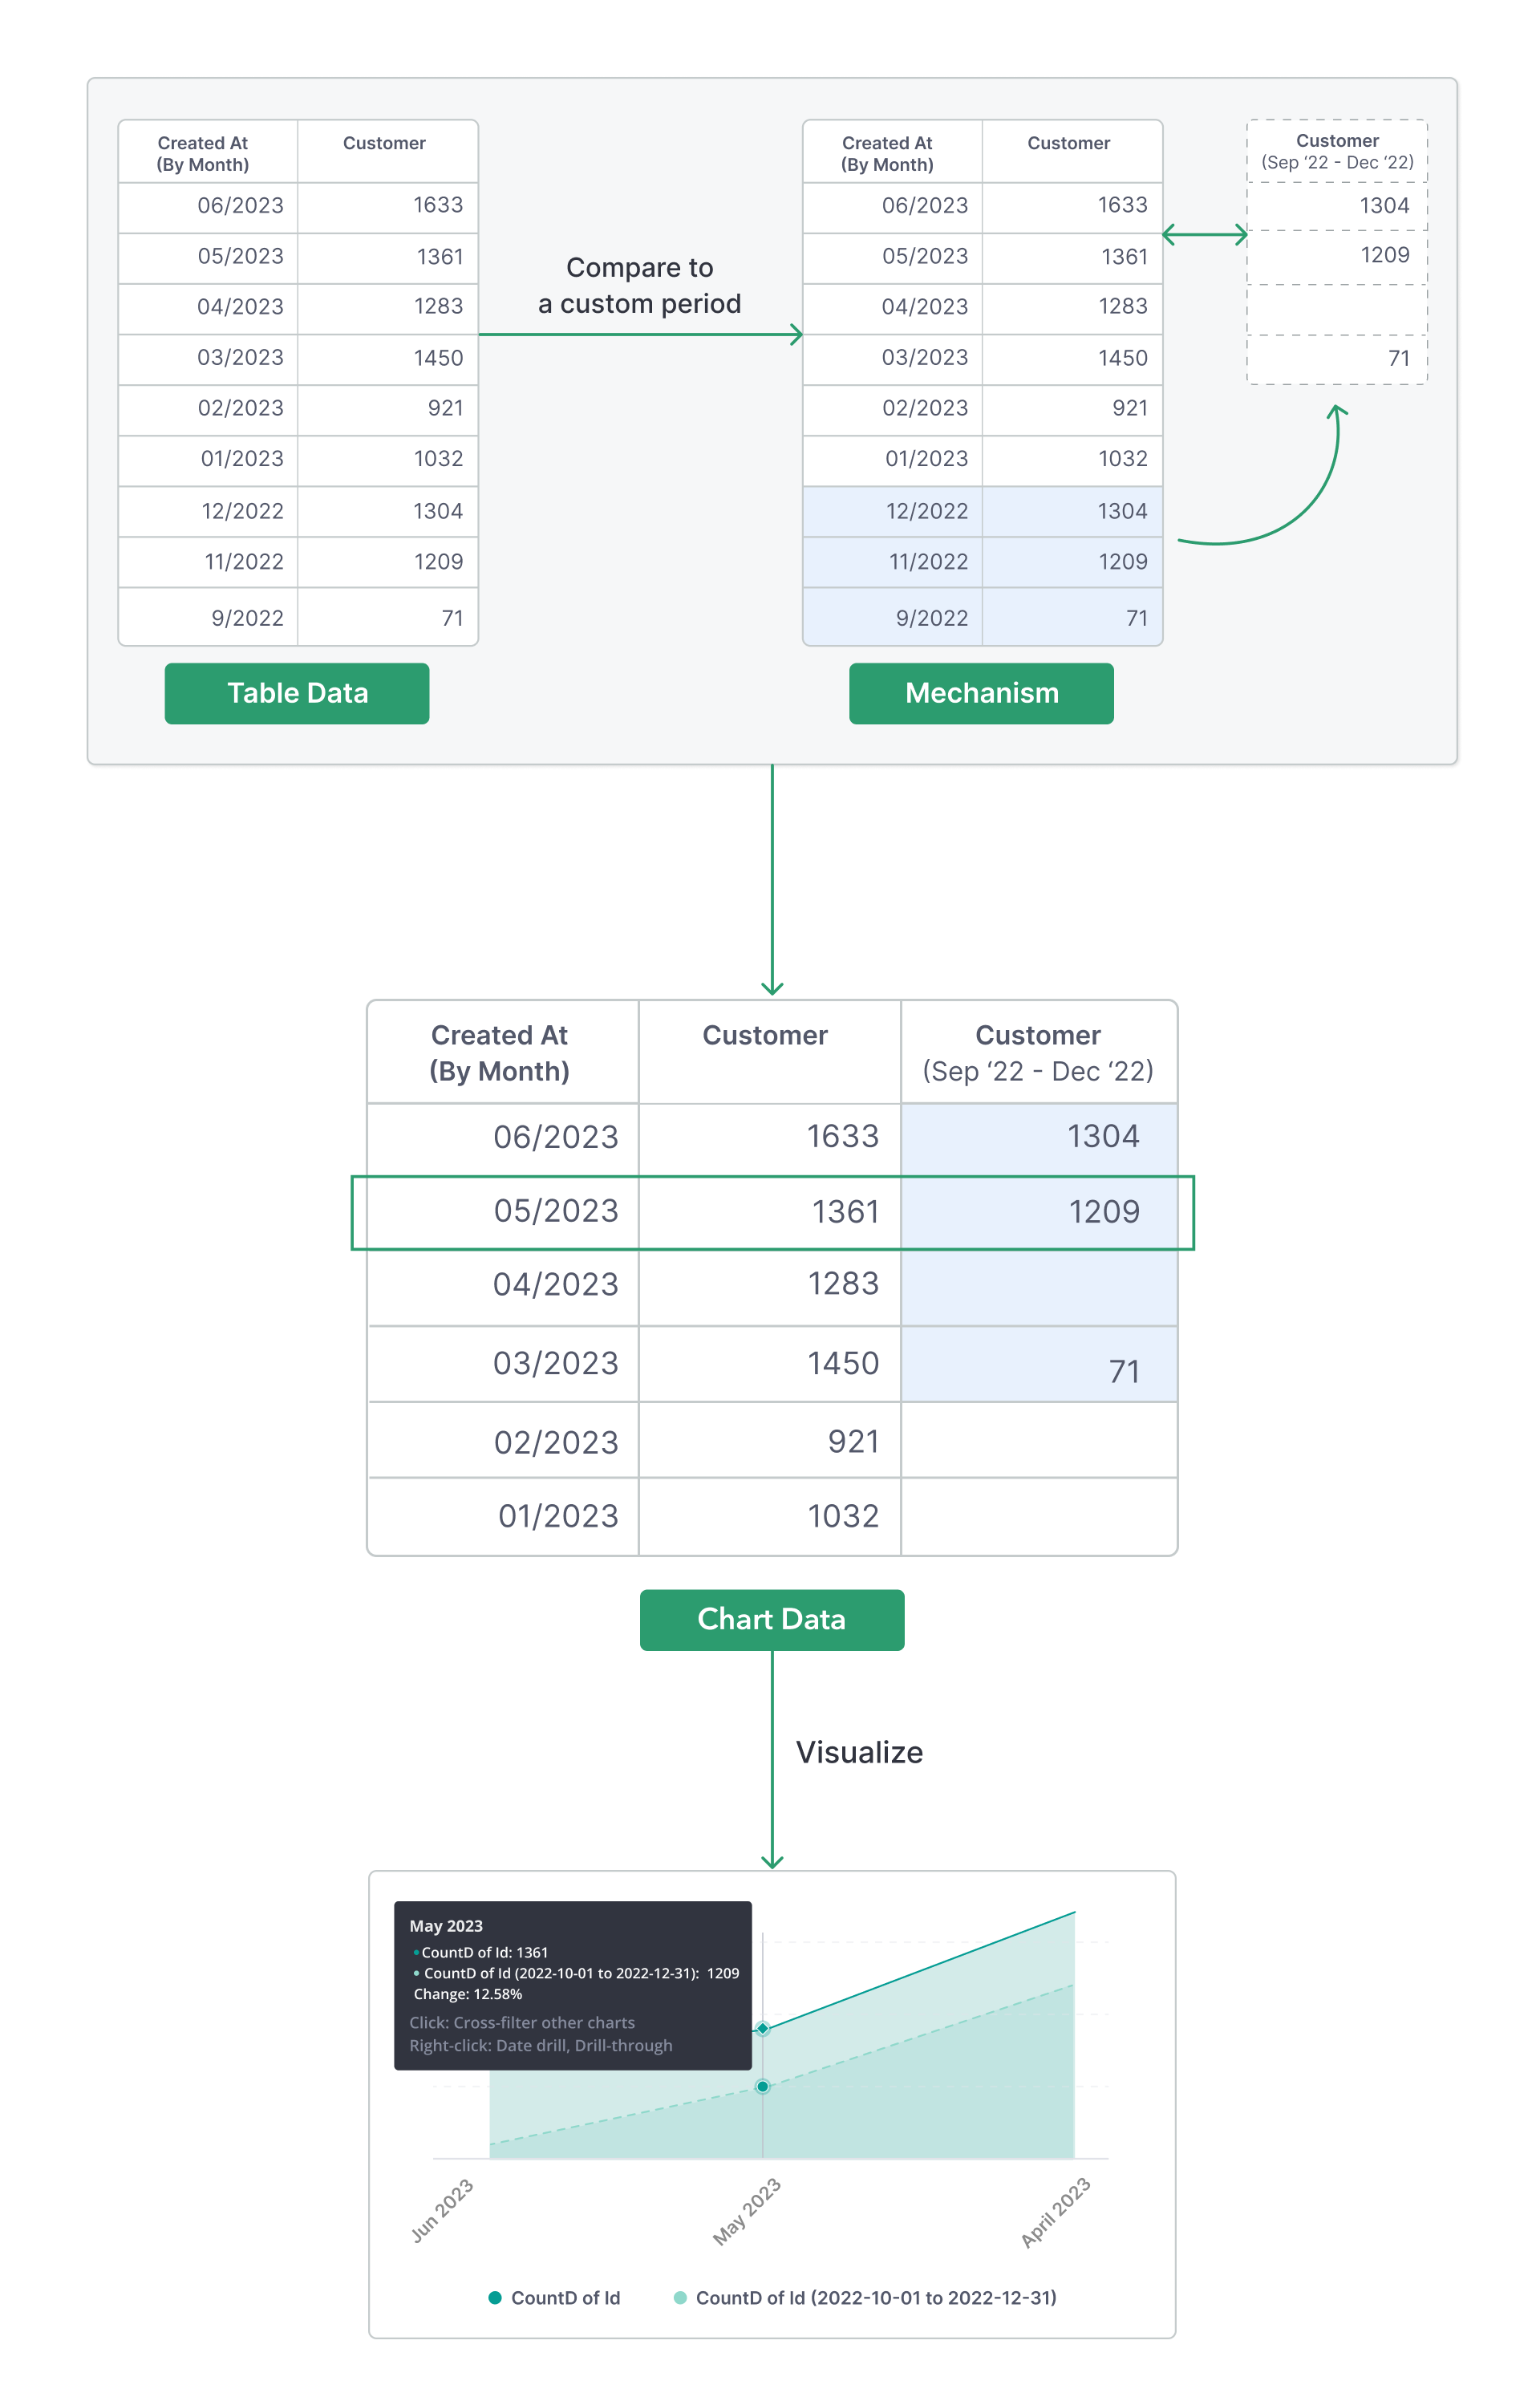
2. Custom period Comparison (Beta)
The Custom period comparison type is currently in Beta.
Period Comparison will generate another data series from the chosen arbitrary timeframe, and put it next to the original series. These two series will then be overlaid on top of each other in the chart.
Applying date filter for non-time-series charts
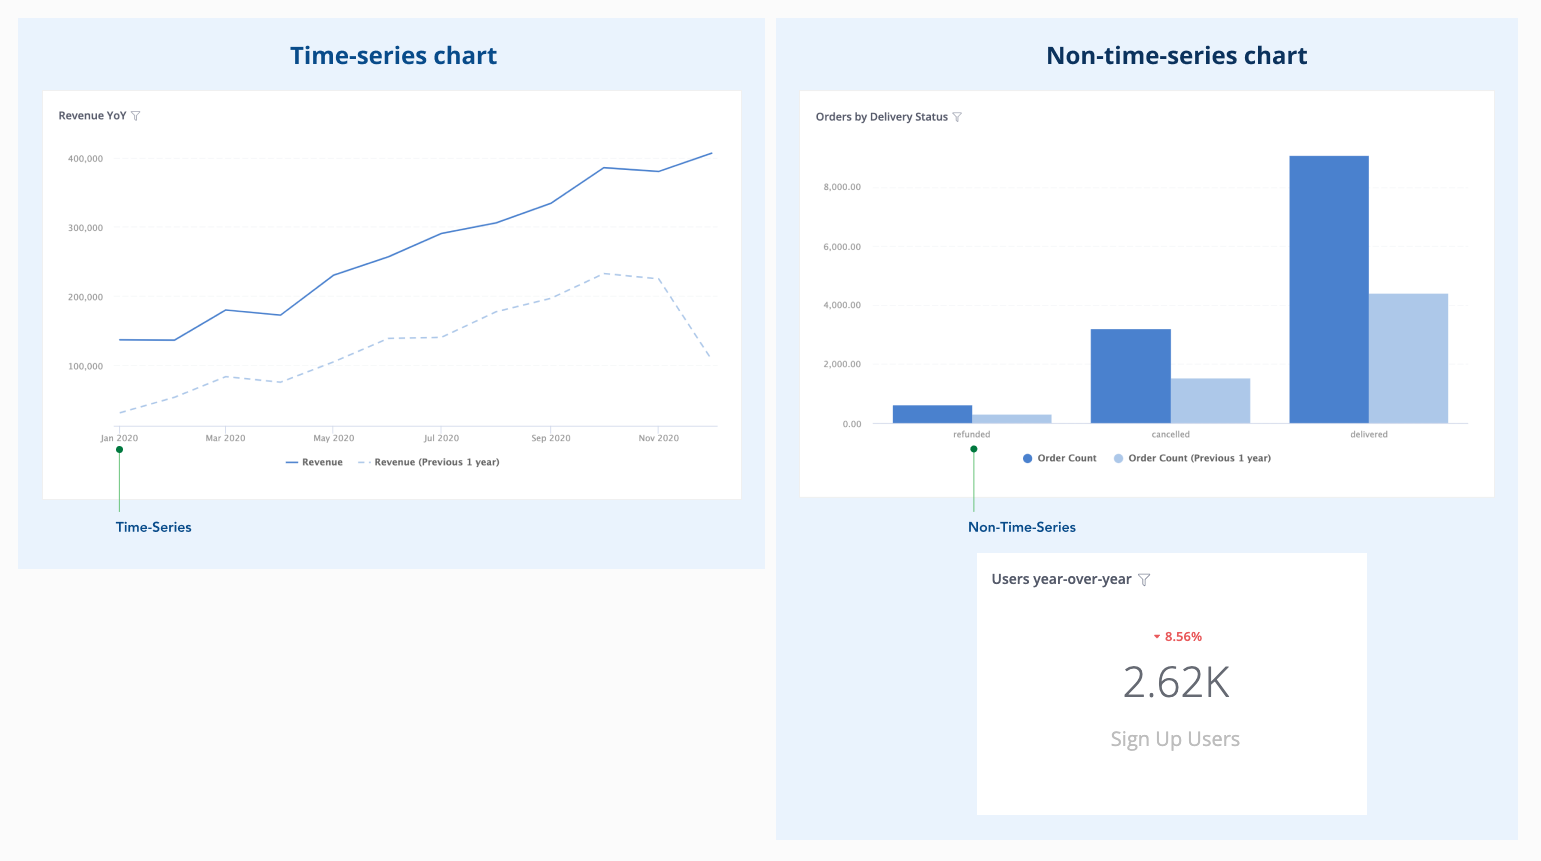
In general, there are two main kinds of charts when comparing date period:
- Time-series chart
- Non-time-series (categorical) chart
Time-series chart visualizes a sequence of data points indexed in time order. While non-time-series chart visualizes a sequence of data points without timestamps. Metric KPI is a non-time-series chart.
For non-time-series charts, each Comparison type of Period Comparison behaves differently:
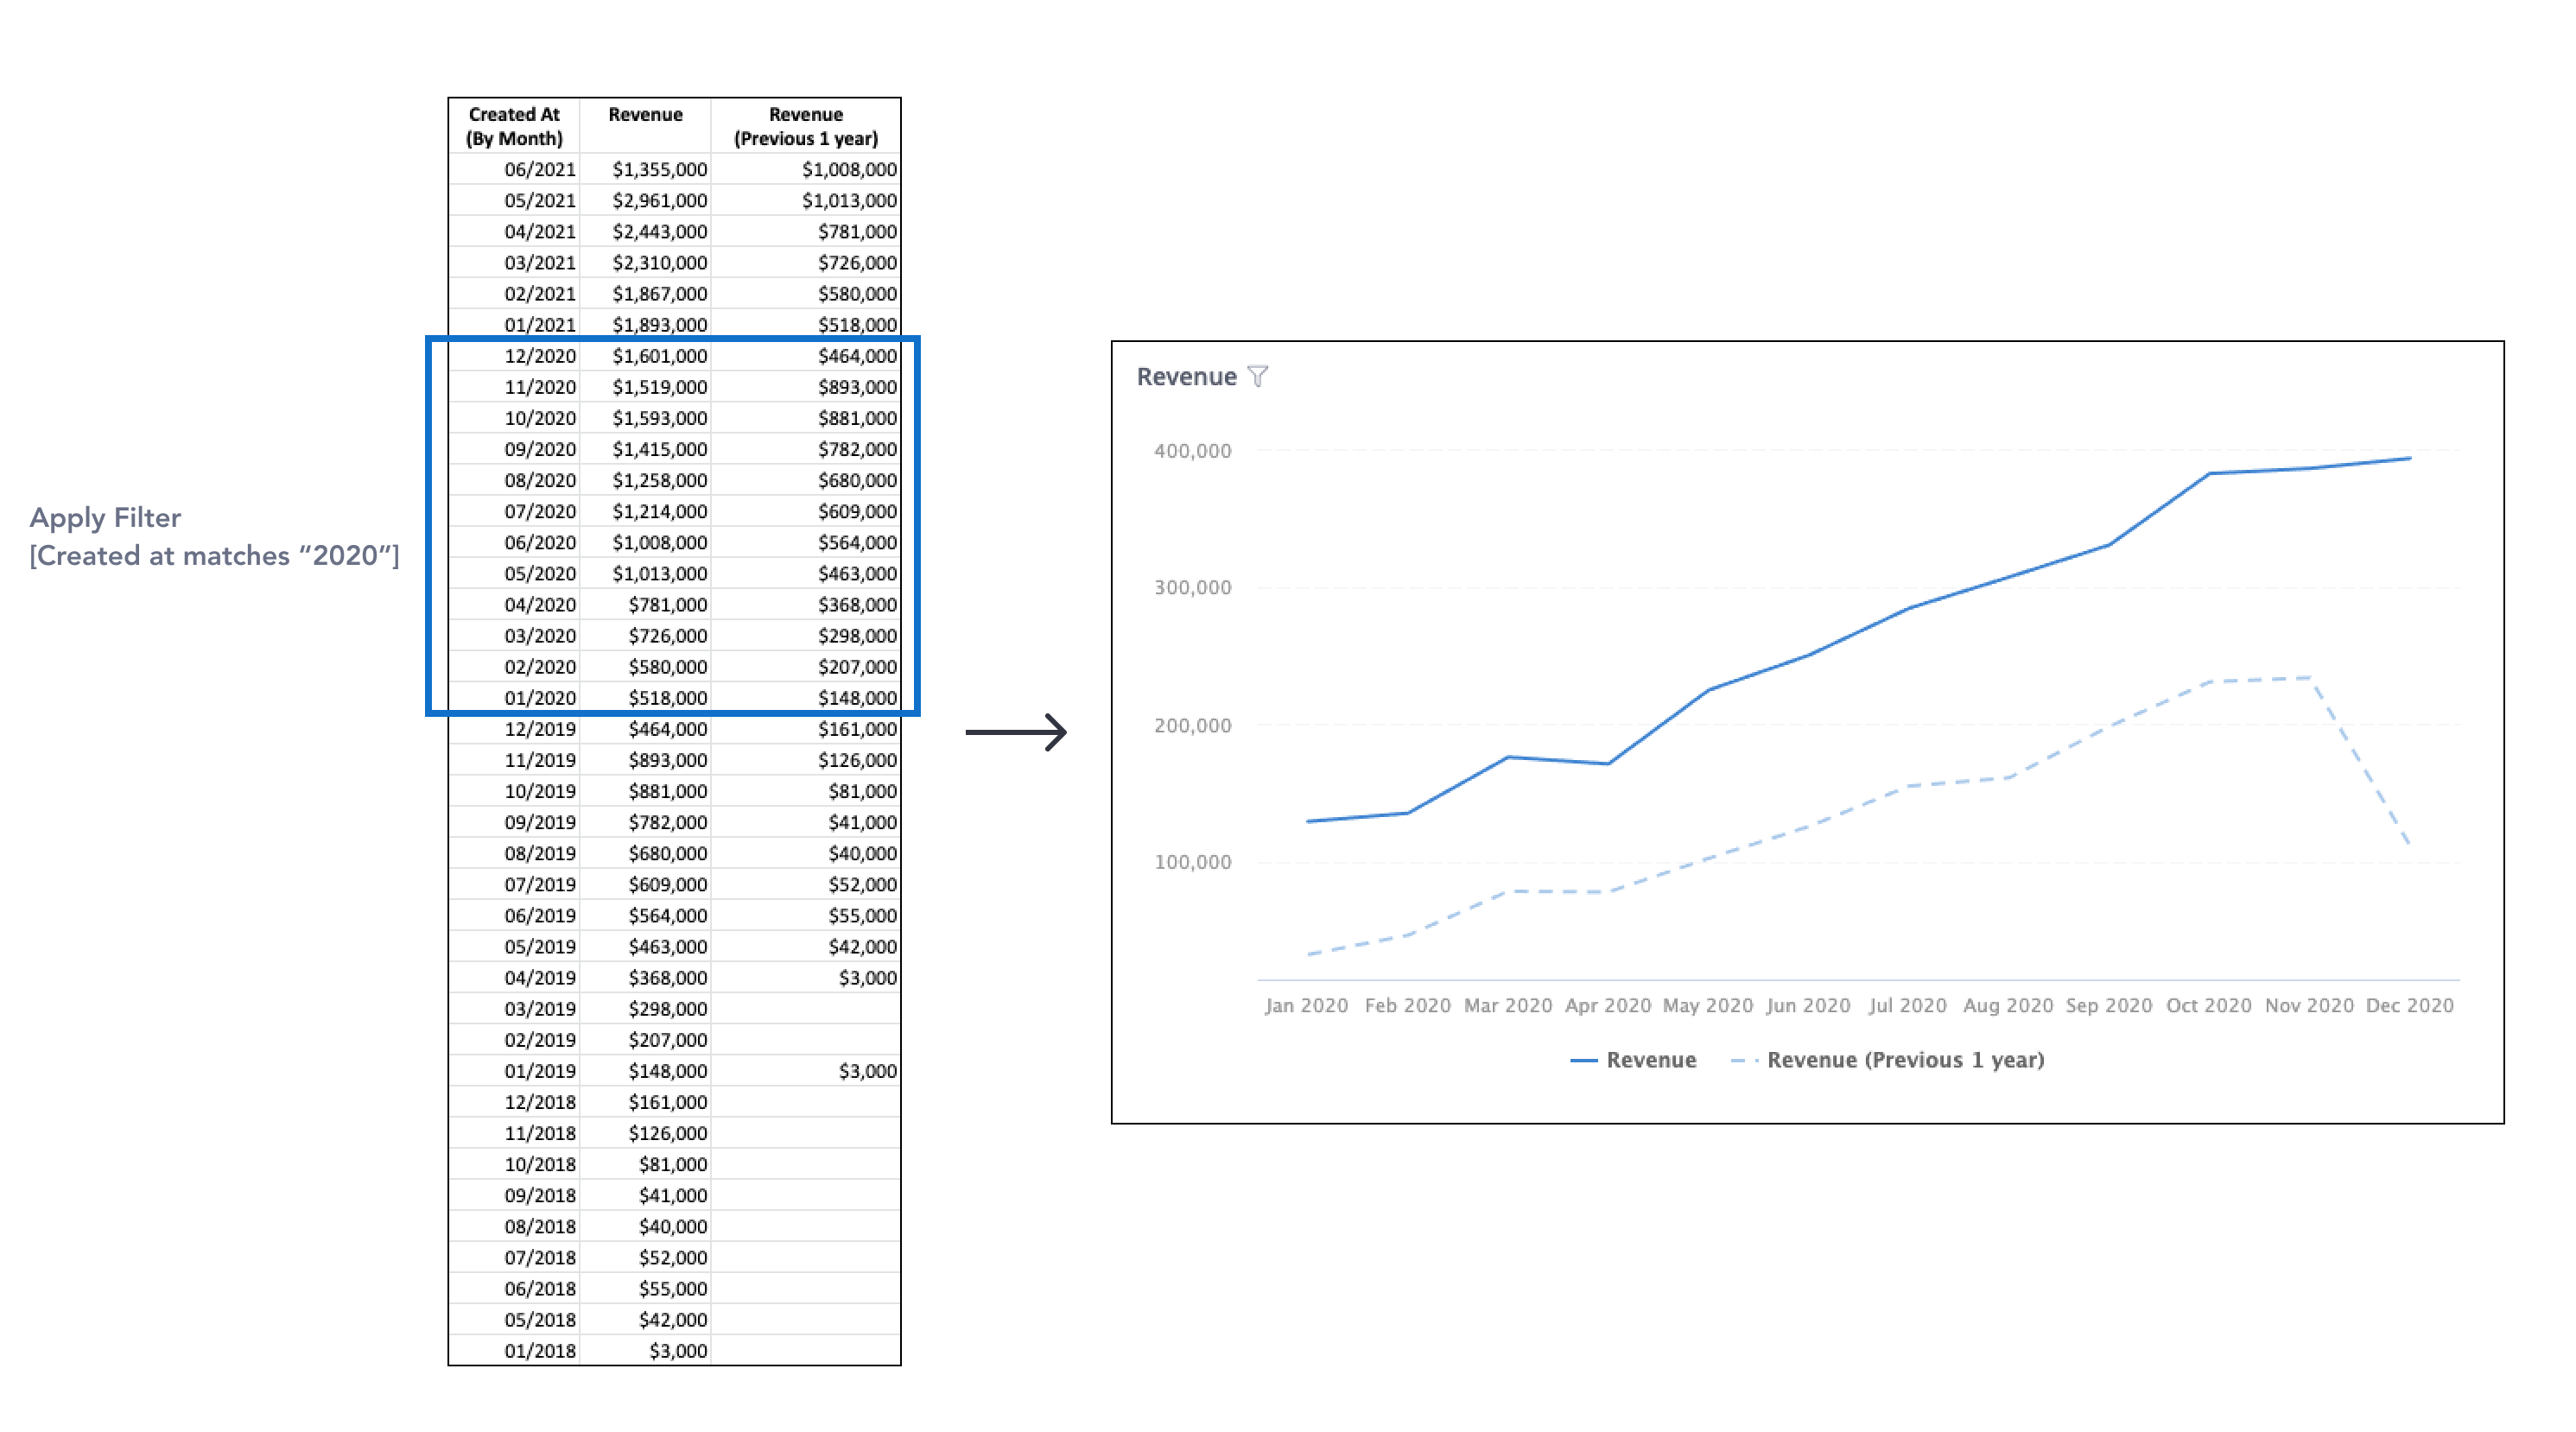
1. Previous period Comparison
As non-time-series chart visualizes a sequence of data points without timestamps, Period Comparison cannot determine a period for comparison. You will need to set a filter on the Period Comparison's Date Field to narrow down the range.
Without a filtering condition, two periods will return the same result.

2. Custom period Comparison (Beta)
You can perform Period Comparison Custom period on non-time-series charts, since Holistics already requests you to determine a comparison period beforehand.
FAQs
Which period does the date filter apply to?
Date Filter only applies to the original range.
If users want to limit the data from both ranges for privacy purposes, we suggest using Row-level Permission.
Why do two periods return the same result?
For non-time-series charts, you need to set a filter on the Period Comparison's Date Field to narrow down the range. Without a filtering condition, two periods will return the same result. The detail can be found in Mechanism section.
What if present month and previous month don't have the same number of days?
If present month has more days than previous month, then the end date of previous month will be extended to compare with exceeding dates of present month.
For example, when comparing March (have 31 days) with the previous month, February (have 28 days).

If the present month has fewer days than the previous month, then the exceeding dates of the previous month will be hidden.

The two cases above are only applied when the date field is aggregated by day. It won't affect data value when the date field is aggregated by week, month, quarter, or year.
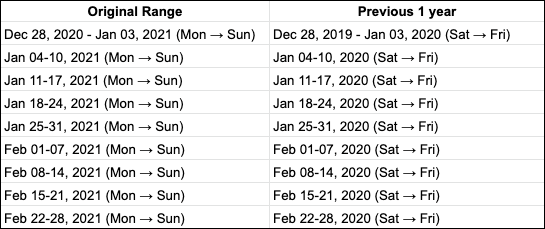
What happens if I compare weeks from this year to last year?
This type of comparison is highly dependent on your business, so the way we do it may not match your expectation.
We will first calculate the date range of weeks from the original range. The start date of the original range follows the rule of Week Start Day setting. Then we shift the start date and end date of the week to a length of time selected by users to create another period. Therefore,
- Week start day of the original range will follow the rule of Week Start Day setting.
- Week start day of the previous range might NOT follow that rule.
For example, when comparing weekly Revenue of January 2021 and February 2021 with their previous 1 year. The Week Start Day is Monday.
Important Notes
Visualization types that support Period Comparison
The following visualization types support Period Comparison:
- Table
- Pivot Table
- Line Chart family: Line/Bar/Column/Area/Combination chart
- Metric KPI
All other charts do not support Period Comparison.
Databases that support Period Comparison
The following databases support Period Comparison:
- PostgreSQL
- Google BigQuery
- Amazon Athena
- Snowflake
- Presto
- Amazon Redshift
- MySQL
- Microsoft SQL Server
- Clickhouse
On the Roadmap
Below is the list of features that are to be implemented in the future:
- Select preceding period
- Compare more than two periods
- Select Delta, Growth Rate, etc, between two values
The order above is not our prioritized order. Feel free to reach out to us at [email protected] if you have any suggestions for improvement.