Our new table improvements have made rendering speed 3x faster compared to the previous version. In addition, we've made scrolling smoother, reduced popover load times, and more.
Check out this video to see the new Table in action:
Please note that this speed upgrade is all about visualization rendering. It doesn't affect query speed. Though, please rest assured we are working constantly to cover that, too!
P.S. We are working on similar upgrades for our Pivot table visualization, also. So please stay tuned!
We’re excited to announce that our integration with Databricks is now available, allowing you to combine the robust, scalable data processing power of Databricks with Holistics’ governed self-service platform.
Freeform layout is the most exciting feature in our upcoming Dashboard As-Code: You can drag-and-drop charts around to create space for context, give explanations, structure a business-friendly narrative, answer audience questions before they ask them, and build dashboards that spark stories, not boredom.
Better yet, everything on the dashboard is customizable using either a GUI or a Code-based Editor. The possibilities are abundant. You can turn it into a landing page, a Notion page, or any type of consumption interface that’s friendly to your viewers, and make it explorable with PoP or Data Drill, both of which were recently added to our Dashboards As Code.
How do you see this feature being useful to your team? If you have any feedback or suggestions for us, please share them here. We’re all ears.
Timezone is annoying. You can create the best dashboard in the world, but it won’t be really useful when timezone conflicts hit. Luckily, you’ll soon have a simpler way to manage your dashboard timezone, ensuring accurate data delivery to your customers.
With this feature, you can:
Set a default option if your viewers are in the same timezone. OR
Allow viewers to change to the timezone they prefer.
You've sweated over every detail of your product, so we want to make sure Holistics reporting fits right in. You can now further customize your embedded dashboards by hiding filter and header panels.
They say “All roads lead to Rome”, we say “But some are faster than others”.
There are many ways to get on with Holistics 4.0, and we want to bring you on the quickest path. In October, we introduced an upgraded flow to help your onboarding experience with 4.0 as effortlessly as possible. You’ll be guided throughout the whole process - from your first data source connection to your first datasets, and to your first report.
You can just follow the flow, click, clack, sit back, and relax.
On Oct 12, we released Lazy-rendering Widgets, as part of our effort to further improve Holistics dashboard performance.
Lazy-rendering make sures that all widgets are executed when the dashboard is opened, but only those currently in the viewport are actually rendered. As a result, the initial loading of each dashboard becomes significantly faster and more responsive.
In contrast, without lazy-rendering, every widget would execute and render as soon as the dashboards are opened, resulting in an accumulation of widget renderings and causing the browser to become sluggish.
And because actions speak louder than words, let's go through a quick demo here. :)
In the below demo videos, we're using a dashboard with 20 Pivot Tables.
Before Lazy Rendering
It took nearly 10 seconds for the Dashboard to be responsive.
This gets worse as the total number of widgets in the Dashboard goes up.
After Lazy Rendering
It took 1-2 seconds for the Dashboard to be responsive!
More performance optimizations and features are on the way! If you have any questions or feedback for this functionality, feel free to share it here.
In October, we're making some great updates to our Dashboards As Code, making it easier to build reports using code and have fine-grained control over viz, layout, content, and reporting architecture.
We started testing this internally this month and can't wait to share with you a short demo - but before we get to it, here's a peek at how our data team has been using it:
Triet Le (Analytics Engineer): “I can code the entire dashboard into a narrative that people want to read and engage with.”
Huong Le (Data Analyst): “It becomes a lot easier to reuse a dashboard. I just need to clone it, change filters, change dimensions, and re-format it on the fly.”
With this feature, analysts will soon be able to adopt software best practices in your dashboard development. Through codification, you can have full control over the content and design of your dashboards, easily revert changes, make bulk updates, and have customized and reusable visualizations everywhere.
If you’re as excited as we are, stay tuned. We’re running as fast as we can to get this on your hands! :) Without further ado, here’s the new demo.
How do you see this feature being useful to your team? If you have any feedback or suggestions for us, please share them here. We’re all ears.
P/s: We had a lot of fun testing this feature. Our team was even able to whip up a Pokedex dashboard in just a few minutes.
“What is this dataset about? How should I use it? Who can I contact to learn more about using this dataset?”
Sounds familiar? Business users need to really understand a dataset to self-serve effectively. This is why how you present a dataset is as important as how you design it.
From now on, you can write markdowns to add Descriptions to your dataset, making it easier for business users to navigate and explore the data you’ve prepared.
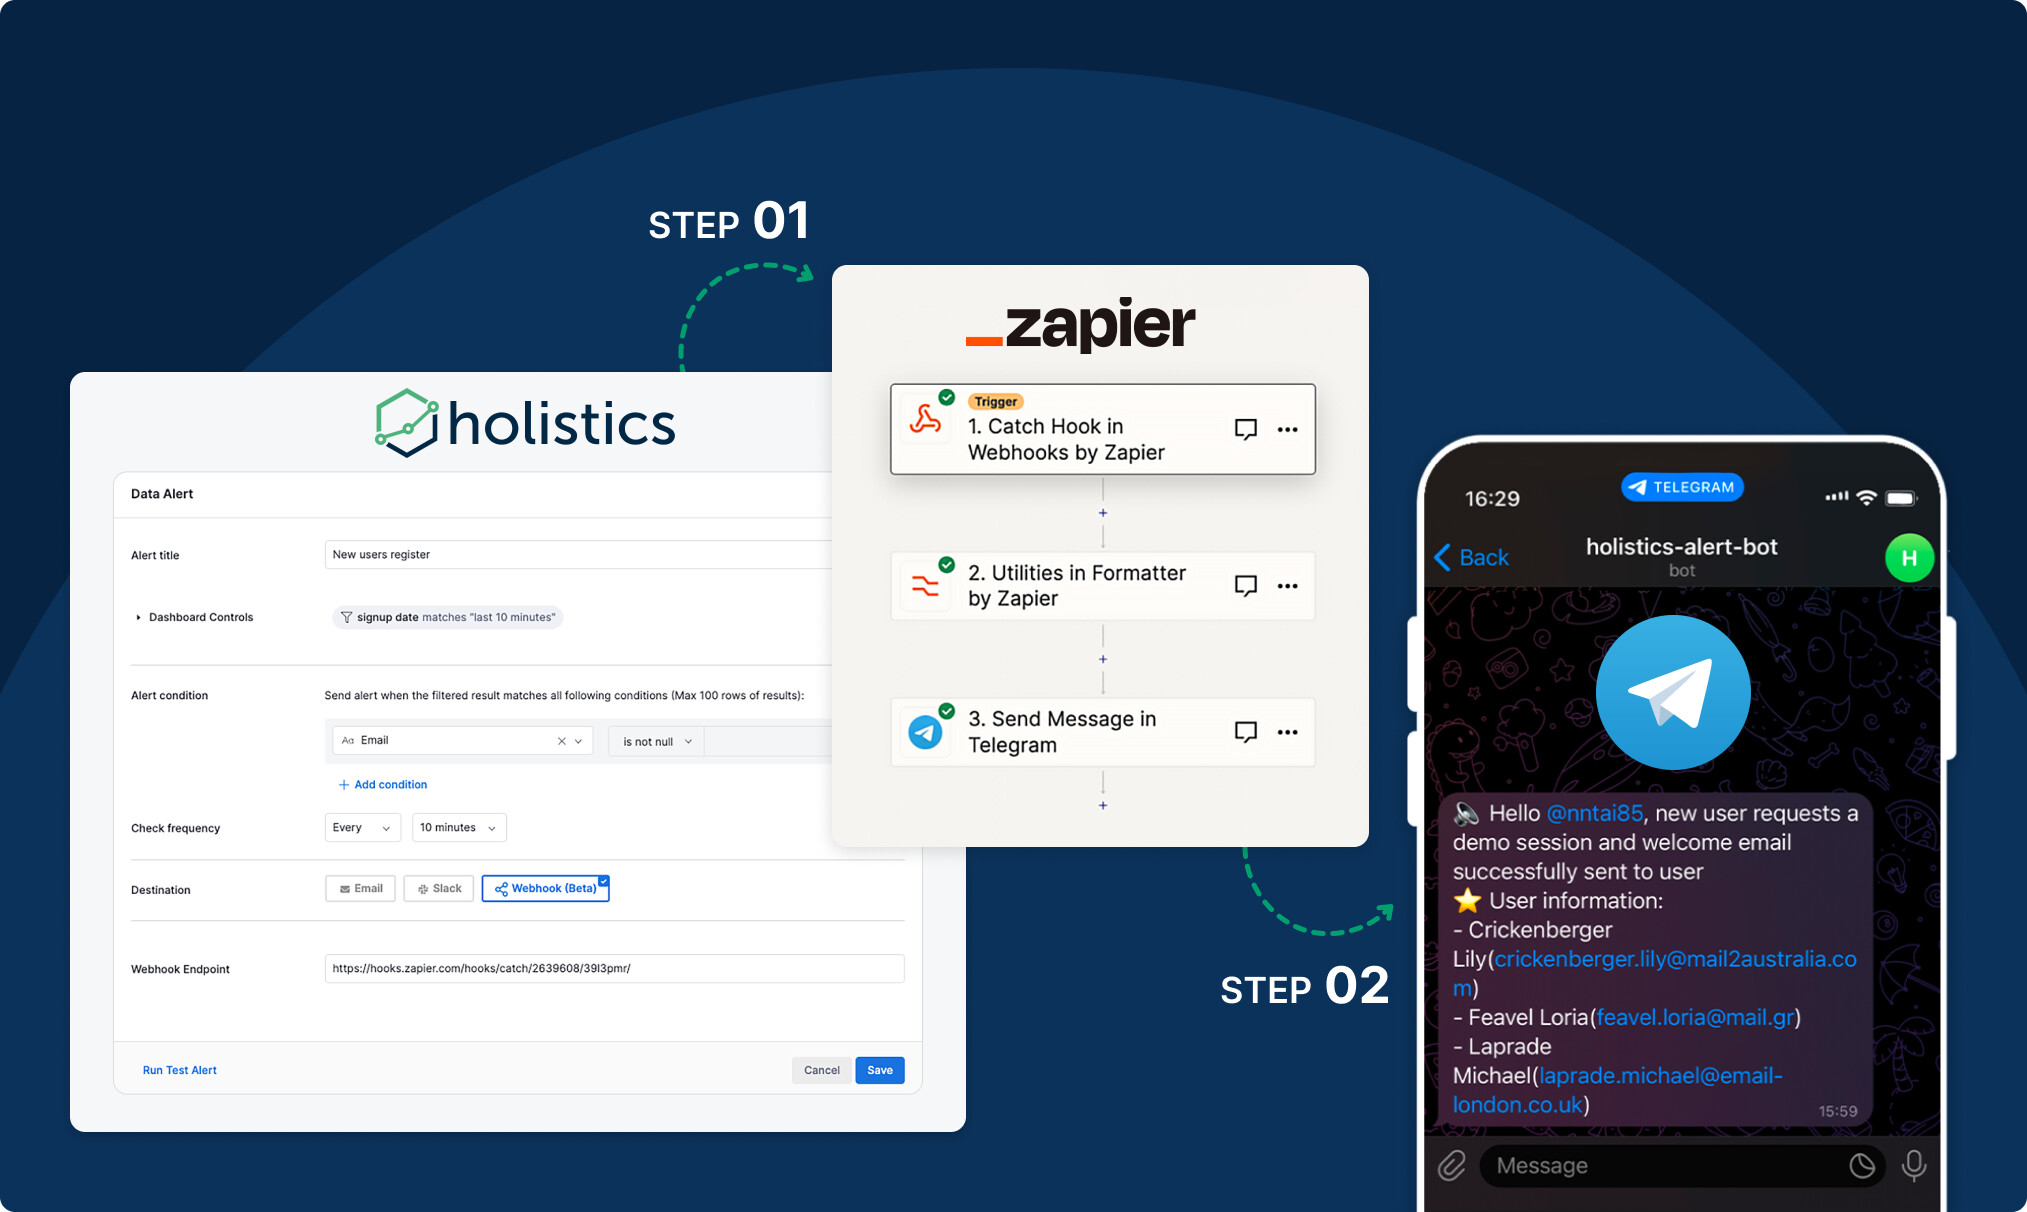
We believe that data should inform action and the faster you can act, the better. This is exactly why we are working on Webhook for Data Alert - a major upgrade to Holistics Delivery capability.
With this, you can quickly set up automated workflows for critical internal communication, like:
Sending alert messages to the Purchasing team’s Telegram when inventory runs low, or
Buzzing the marketing team on Slack when ad spending goes over the limit.


 After Lazy Rendering