📊 Chart styling in Reporting
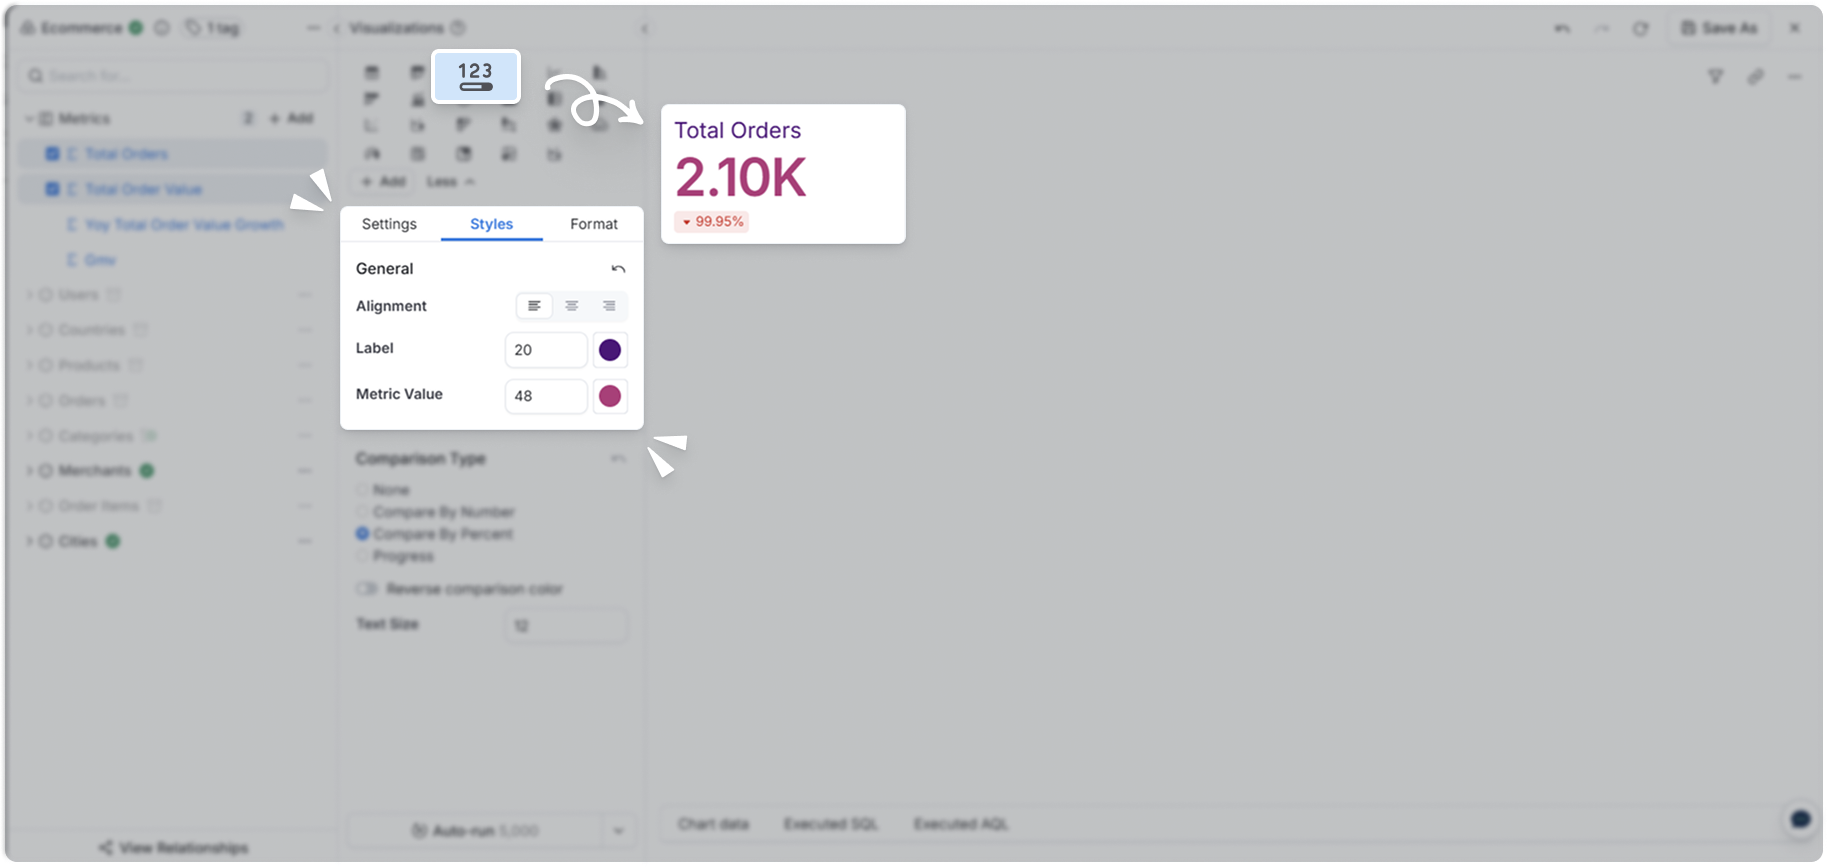
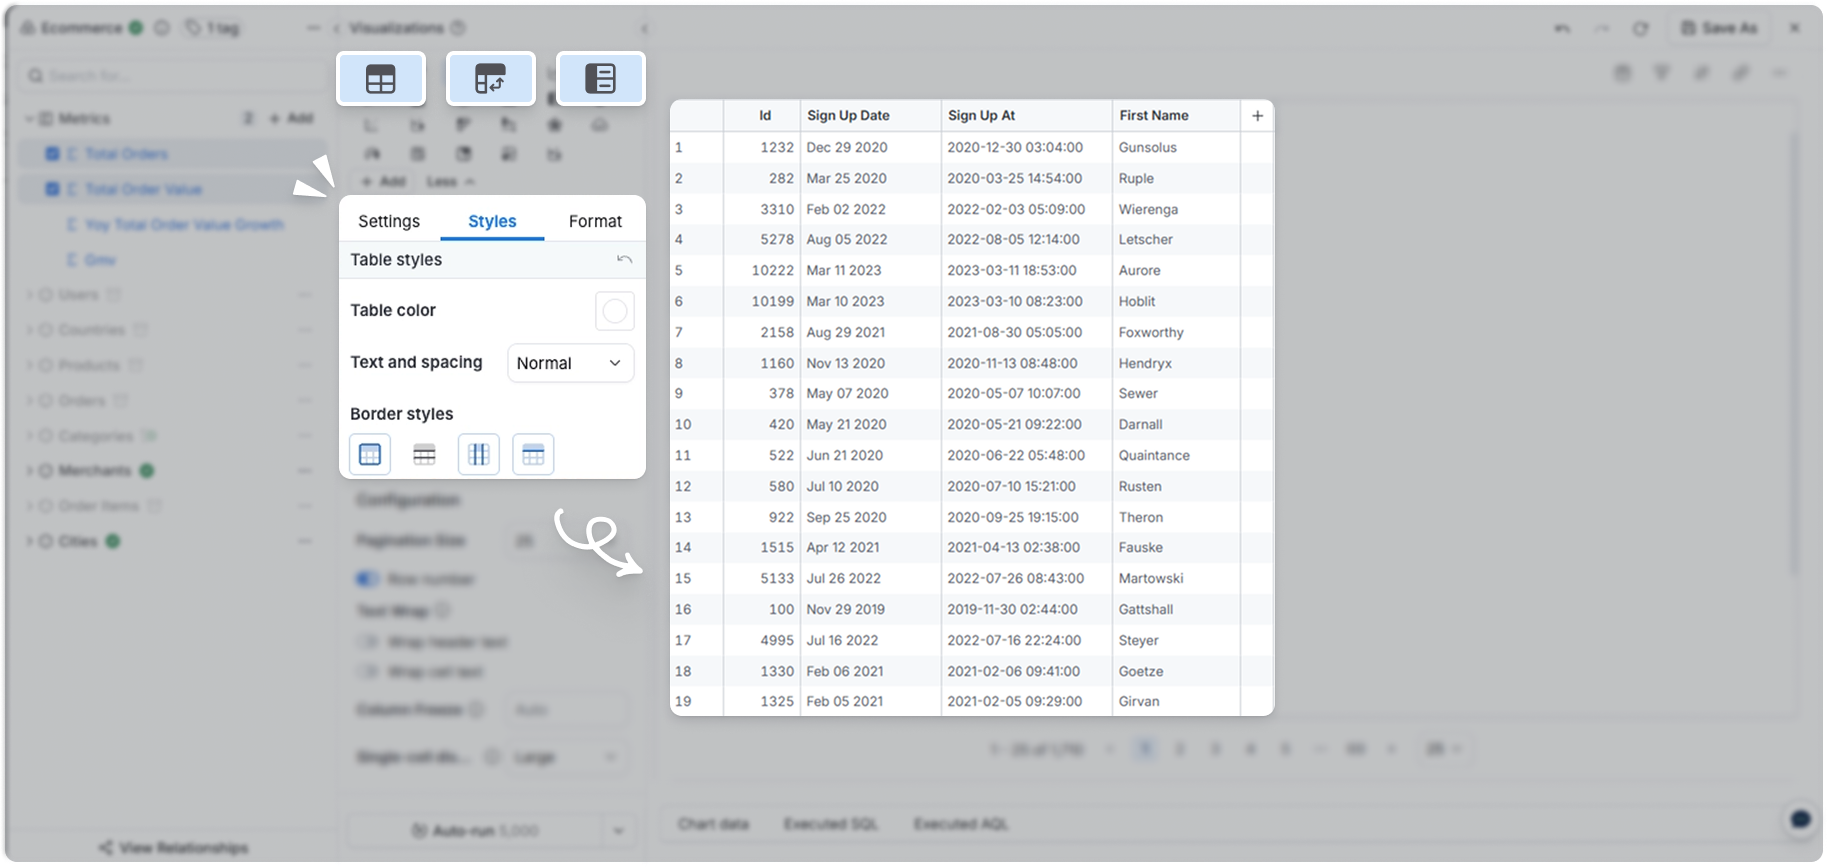
Chart styling is now available in Reporting — configure styles for KPI Metric, Data Table, Pivot Table, and Metric Sheet directly from Dataset Explore and the Report creation flow, no need to switch to Development.
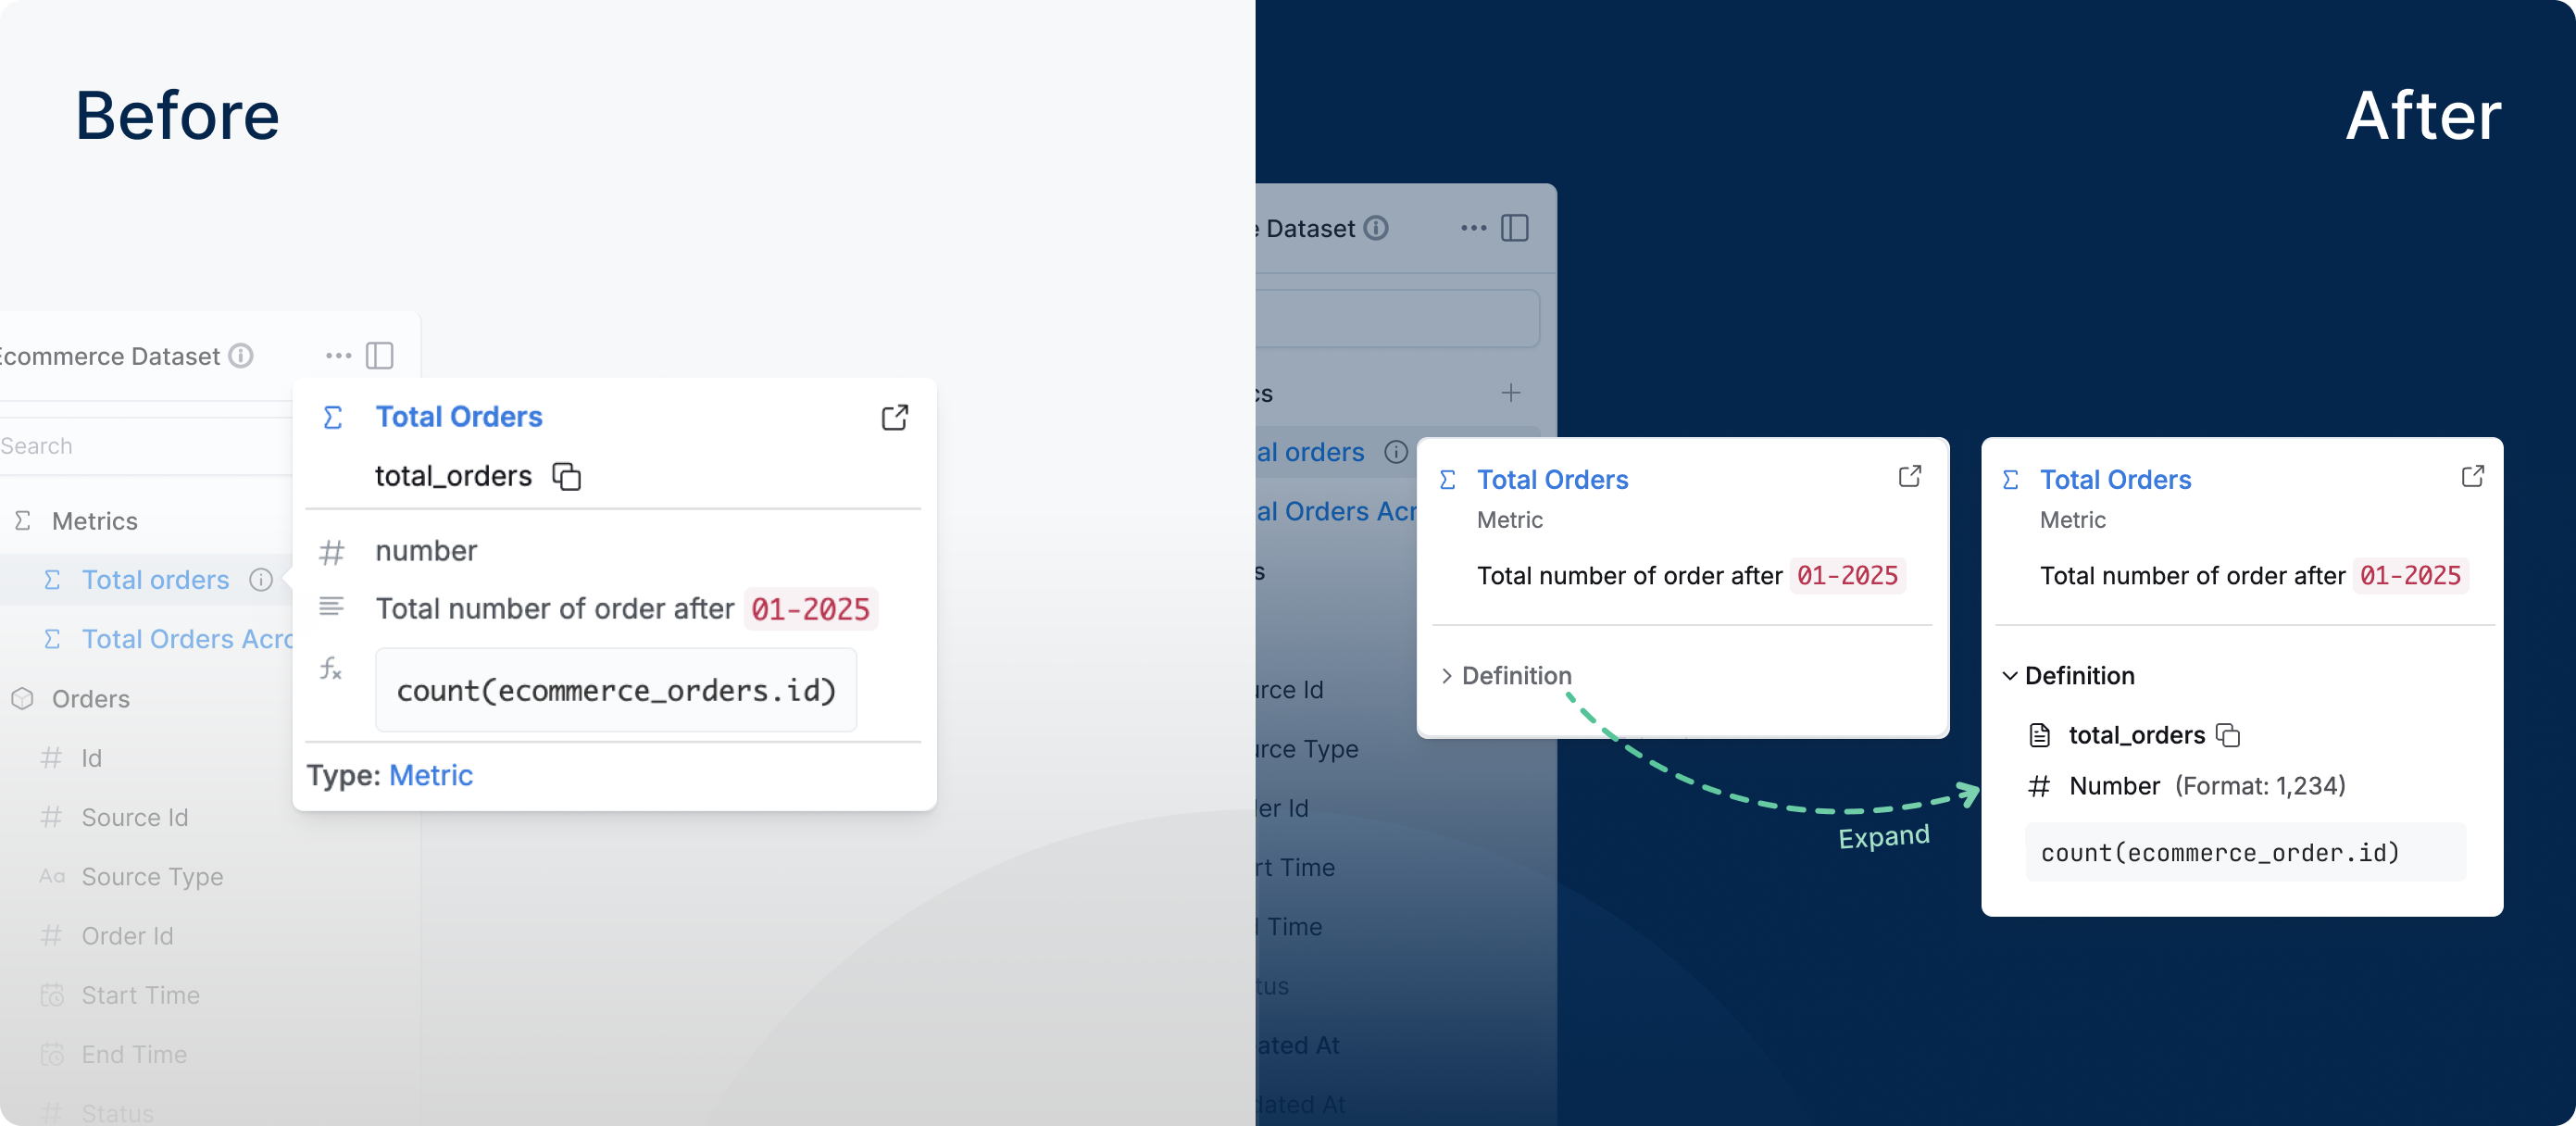
Previously, chart styling was only accessible in Development or the canvas dashboard editor. This added friction and blocked explorers entirely. Now you can do it right in Reporting.
Learn more: KPI Metric · Data Table · Pivot Table · Metric Sheet