Product Roadmap
What just got shipped, and what's shipping next.
📚 Metric Catalog
A central catalog for your organization's metrics — browse, discover, and reuse consistent definitions across dashboards.
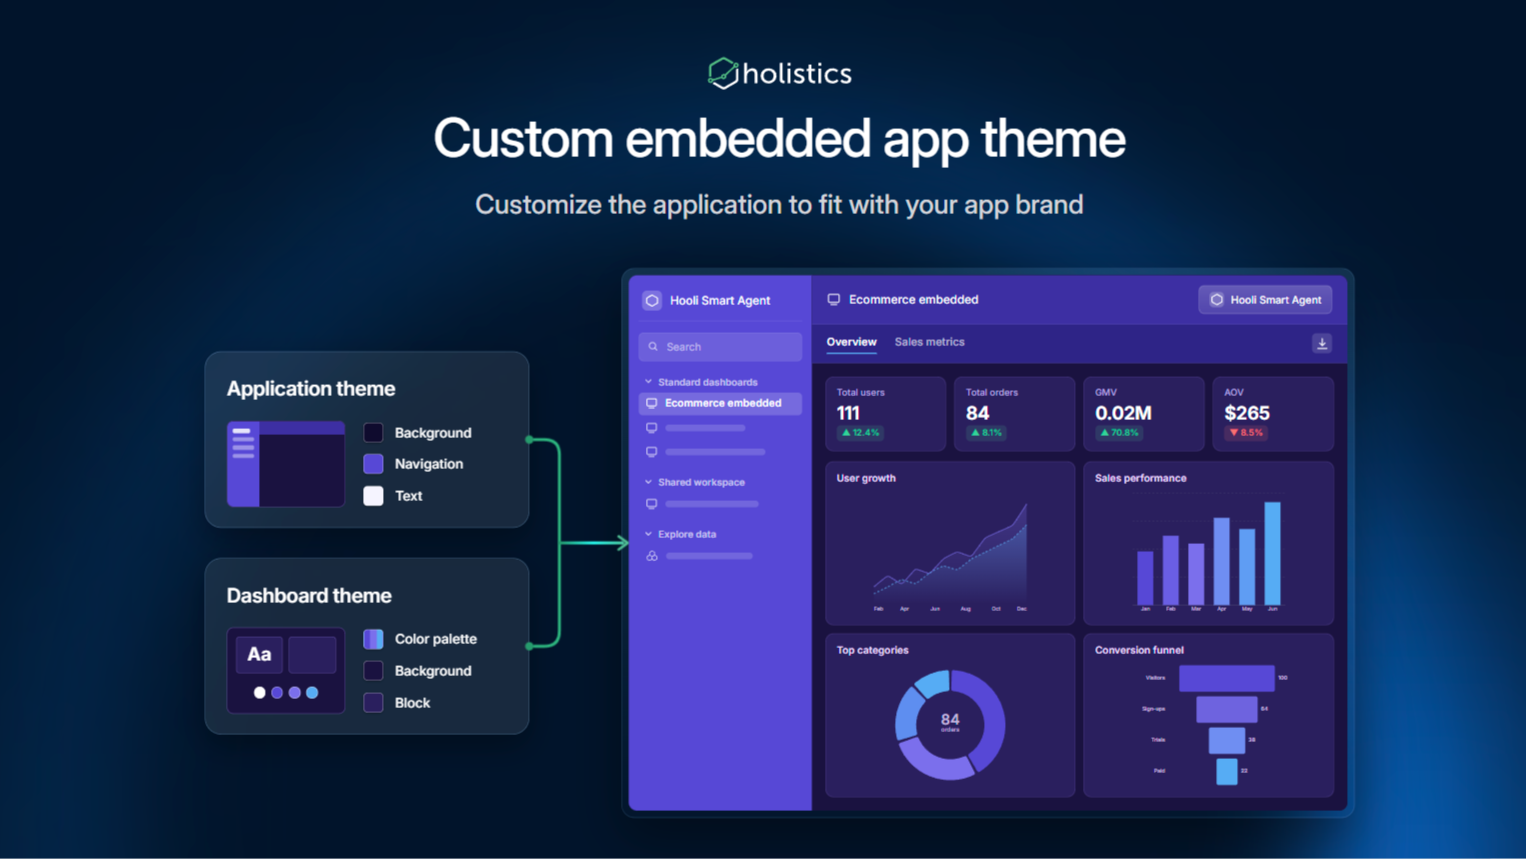
🧩 Custom embedded app theme
Customize the visual identity of your embedded Holistics app to match your host app's brand colors and theme.
🧭 Expand and collapse table columns and rows
Expand and collapse table columns and rows so users can quickly focus on specific data without losing the overall structure.
🧰 Revamp Query Model Builder
Refresh the create and edit experience for query models to make building and iterating on them noticeably faster.
🔔 AI chat notifications: Step away while AI works
Get notified when Holistics AI needs your input, finishes, or fails, so you can step away while long tasks run.
🧠 Organization-level AI Memory
Coming soon: promote individual AI memory insights to the organization level, surfacing suggestions to improve the semantic layer and dashboards.
📊 AI Usage Analytics
Coming soon: give admins visibility into AI adoption — who's using AI, what questions get asked, and how usage trends over time.
🛡️ Prevent invalid metric breakdowns in multi-fact schemas
Control which dimensions can be used with each metric using the relationship direction property, preventing silent data correctness issues in complex models.
🏠 Custom homepage: Put key dashboards where everyone lands
Admins can now show a dashboard in full view right on Home, pin others as buttons, and choose which Home sections everyone sees.
💬 Show field descriptions to dashboard viewers
A viewer-facing field description that shows as a tooltip on table and pivot table column headers, visible to everyone who can view the dashboard.
🔗 Data Lineage
See what a model, dataset, or dashboard is built from and what depends on it, below your code in the IDE.
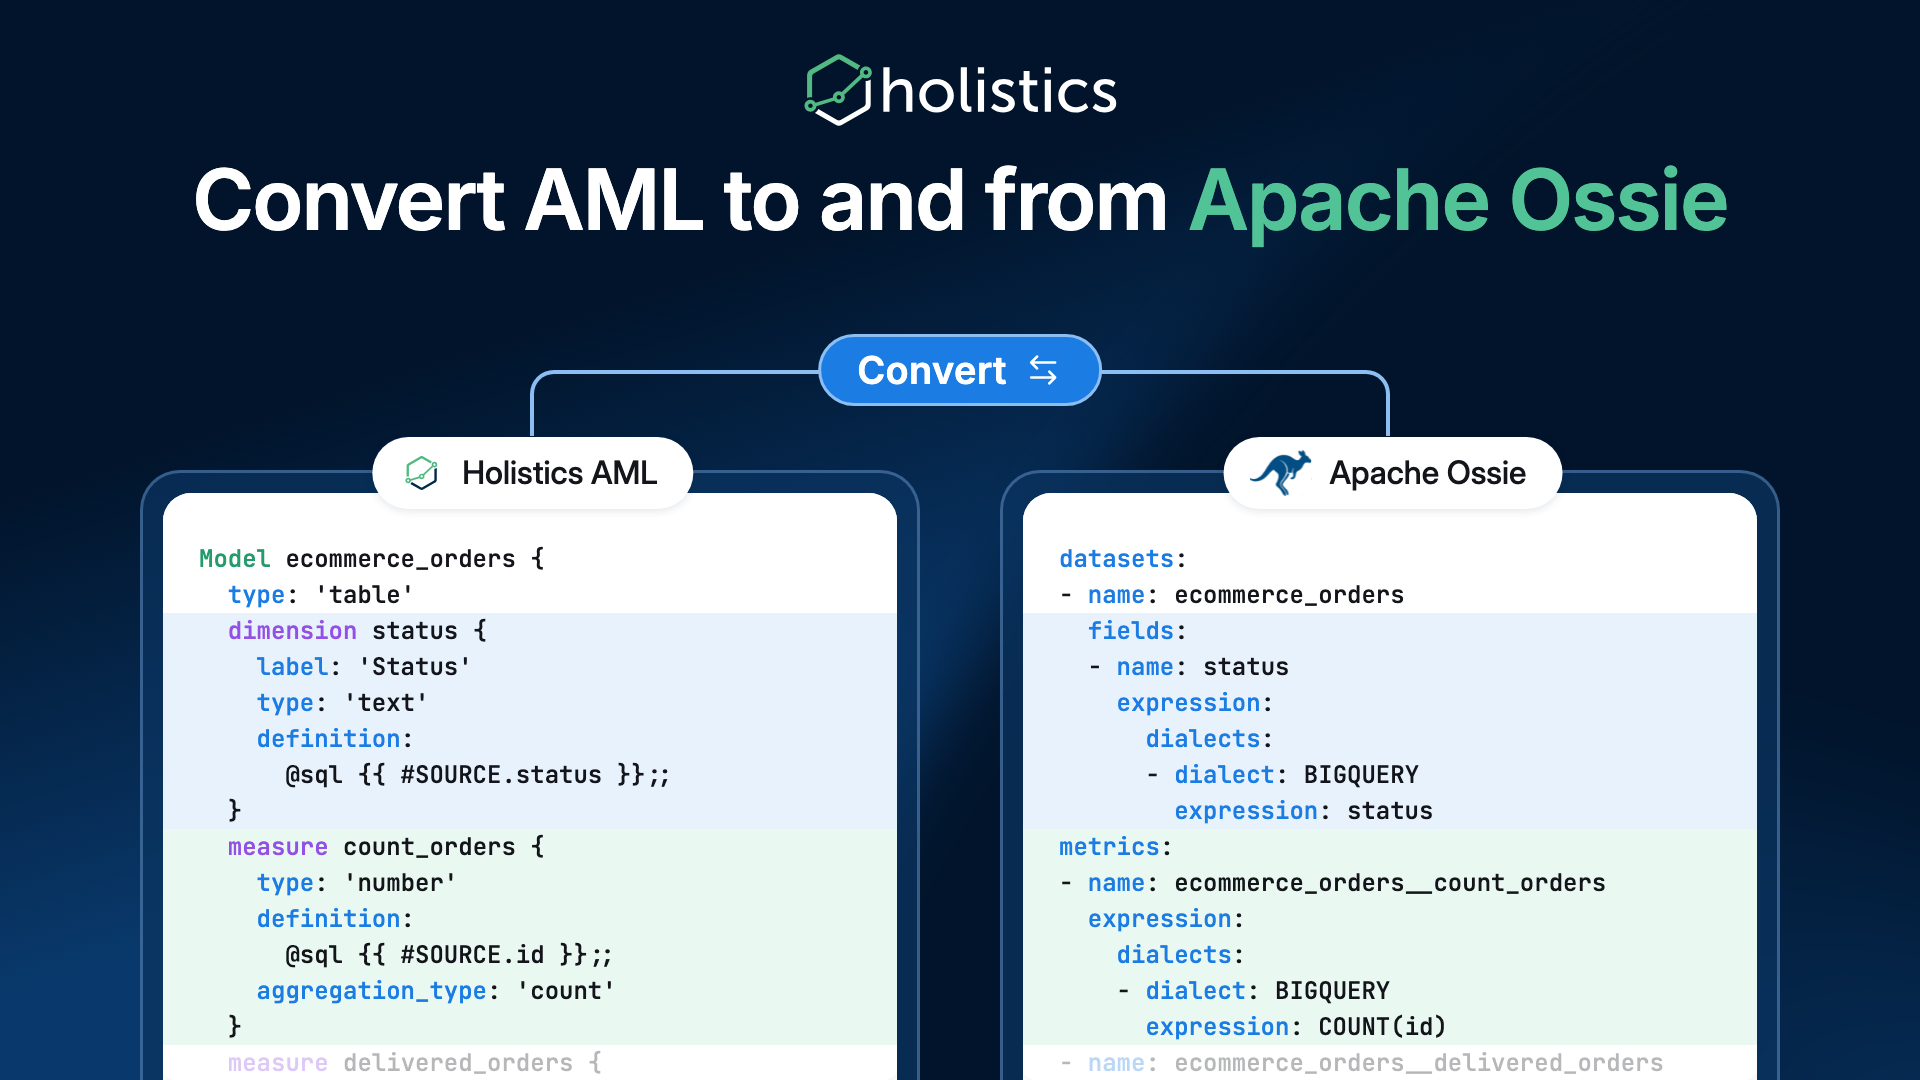
🔁 Convert AML to and from Apache Ossie
Export an AML dataset to an Apache Ossie semantic model, or import an Ossie model as AML files, with the open-source Holistics converter.
🌿 Branches replace the mode switch
master is Production and every other branch is development. Switch between them from one branch selector.
📏 Add reference lines to charts directly in dashboards
Compare dashboard charts against an average, a target, or other benchmarks without leaving the dashboard.
📈 Add trend lines to charts directly in dashboards
See whether a dashboard metric is going up or down without leaving the dashboard.
🧩 [Beta] HTML Layout for dashboards
Design dashboard pages with plain HTML and CSS instead of a fixed grid.
⚡️ AI dashboard building in Reporting, with a better build experience
AI dashboard building gets specialized build skills, a plan-before-build step, attachment-based input, fewer timeouts, and support in Reporting.
📝 Turn your dashboard into a narrative with AI Block
Add a prompt-driven AI block to your dashboard that generates a written summary, staying in sync with your live data.
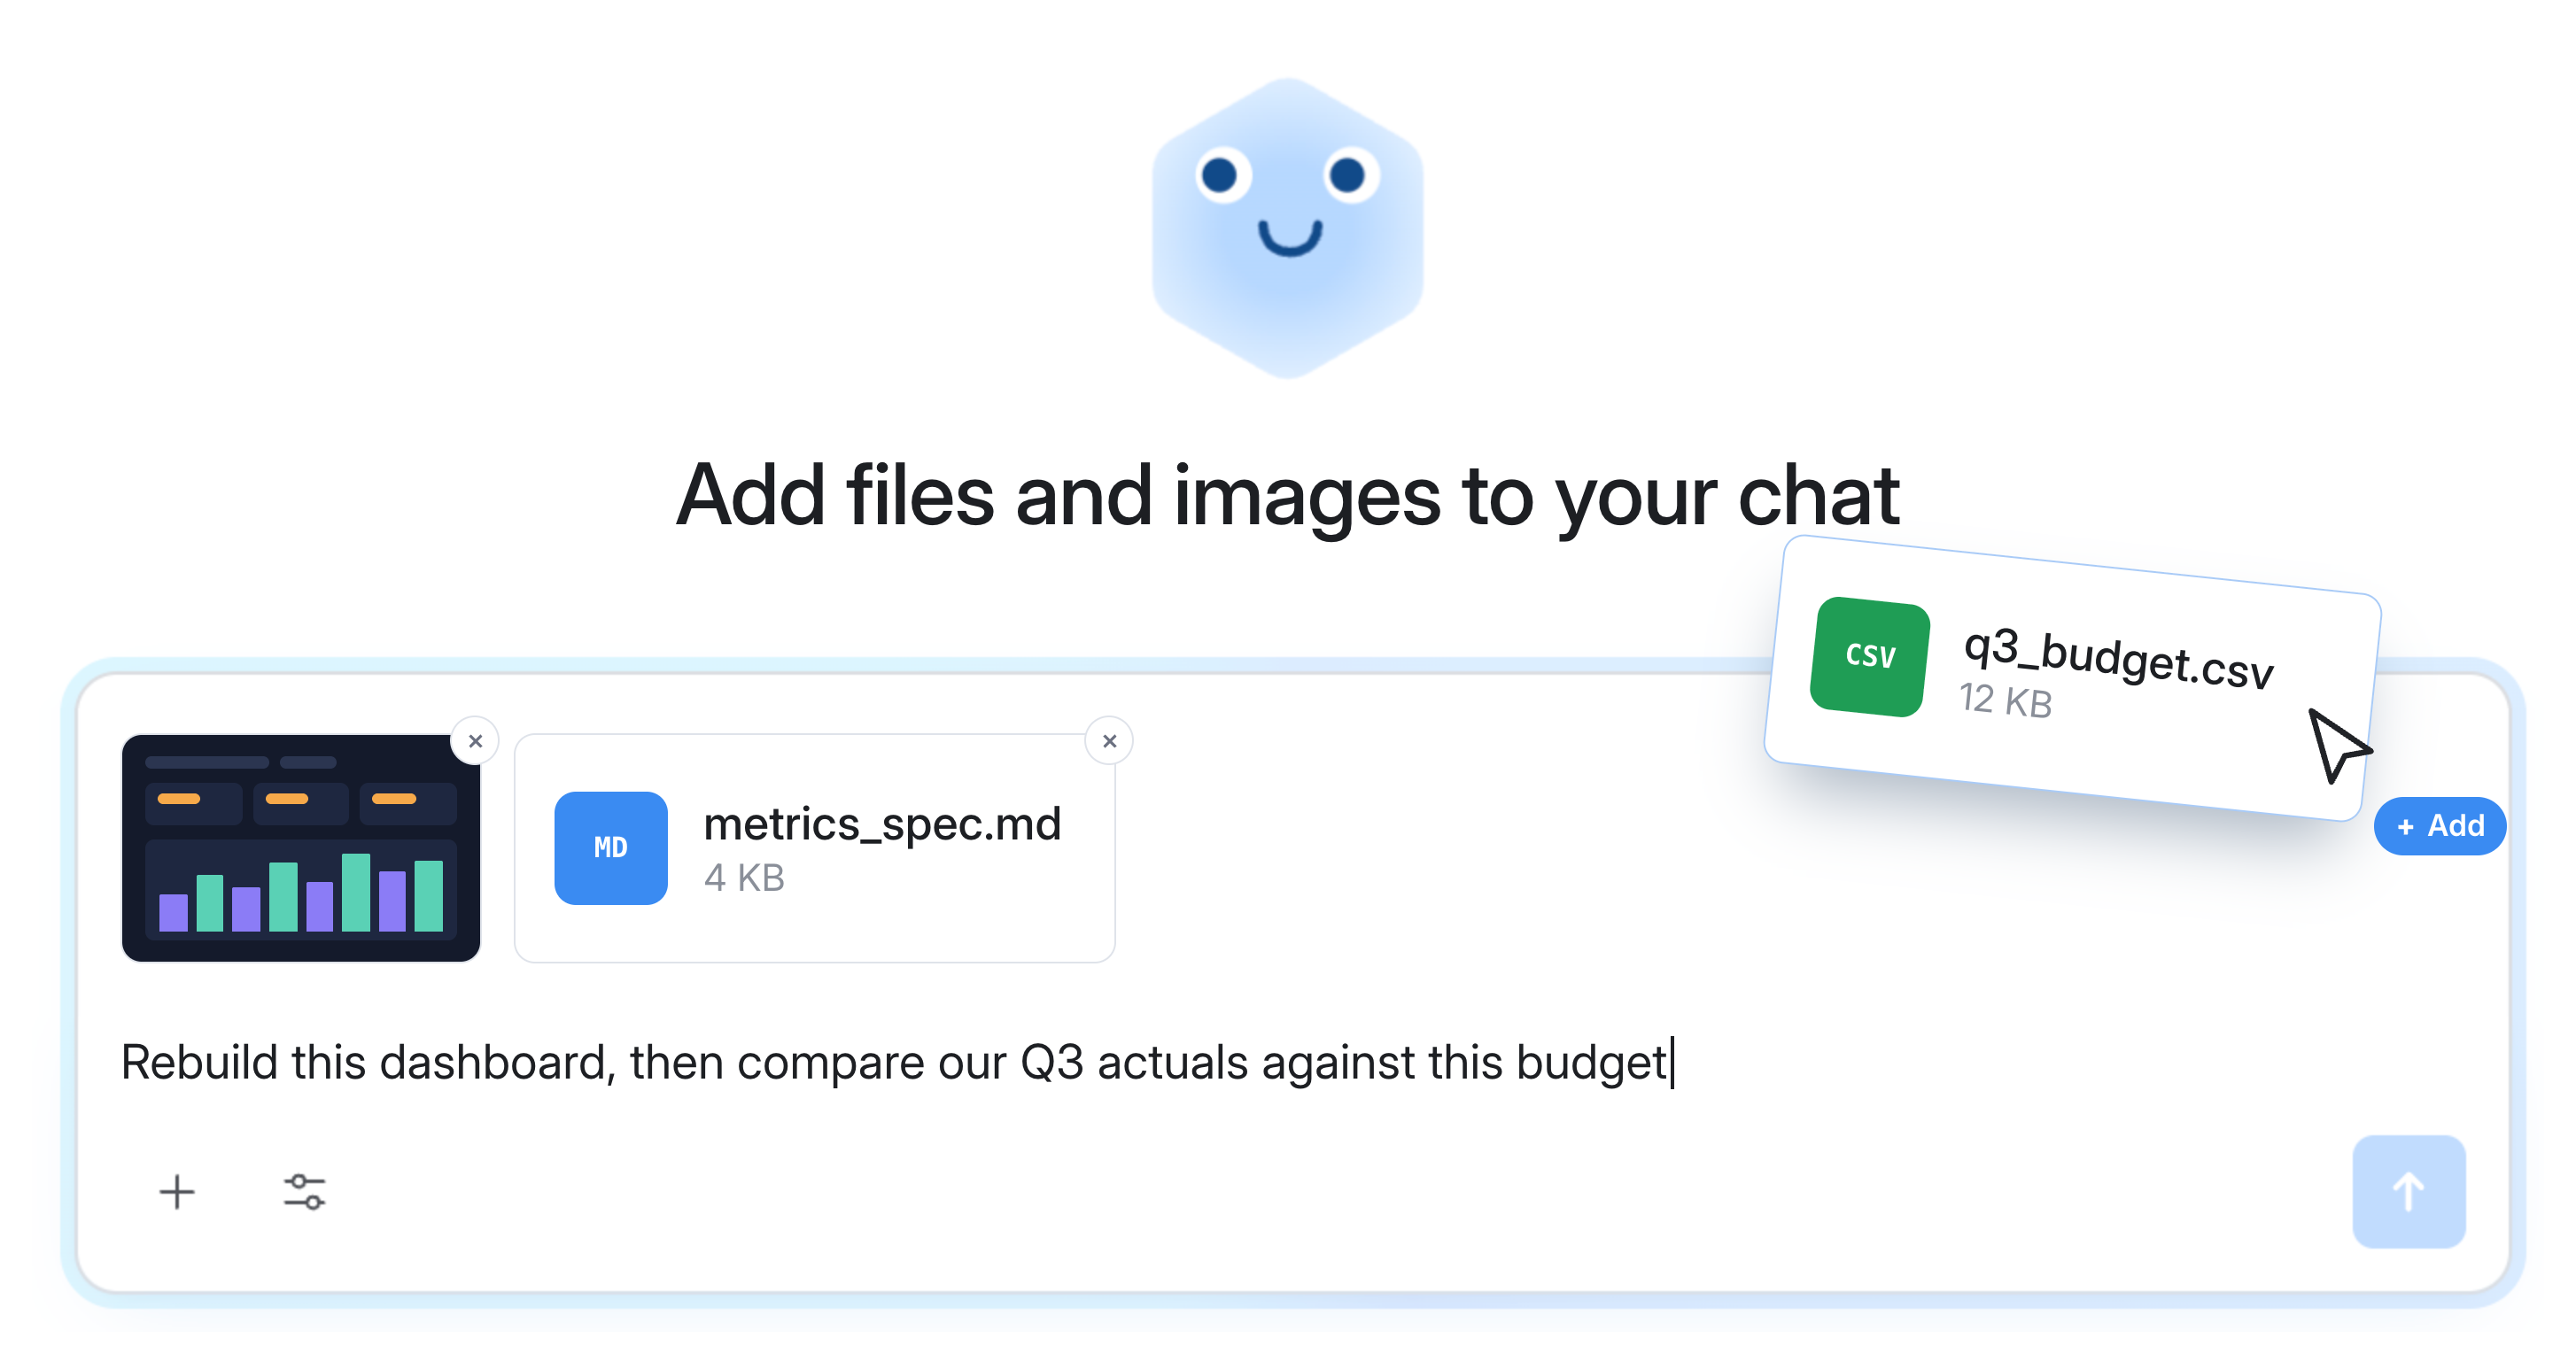
🖼️ Add images and files to your AI conversations
Attach images and plain text or code files to AI chat for extra context, without needing to model that data first.
⚙️ Automate repetitive AI work with AI Tasks
Define AI work once with explicit acceptance criteria, then run it on demand or on a schedule - every run is automatically verified, not just generated.