Canvas Dashboard
Holistics offers two dashboard types: Canvas Dashboards and Quick Dashboards. We highly recommend using Canvas Dashboards. It’s our latest and most innovative version, offering the best experience while Quick Dashboards is an older, legacy version.
For more details on the differences between these two dashboard types, please refer to this section.
Introduction
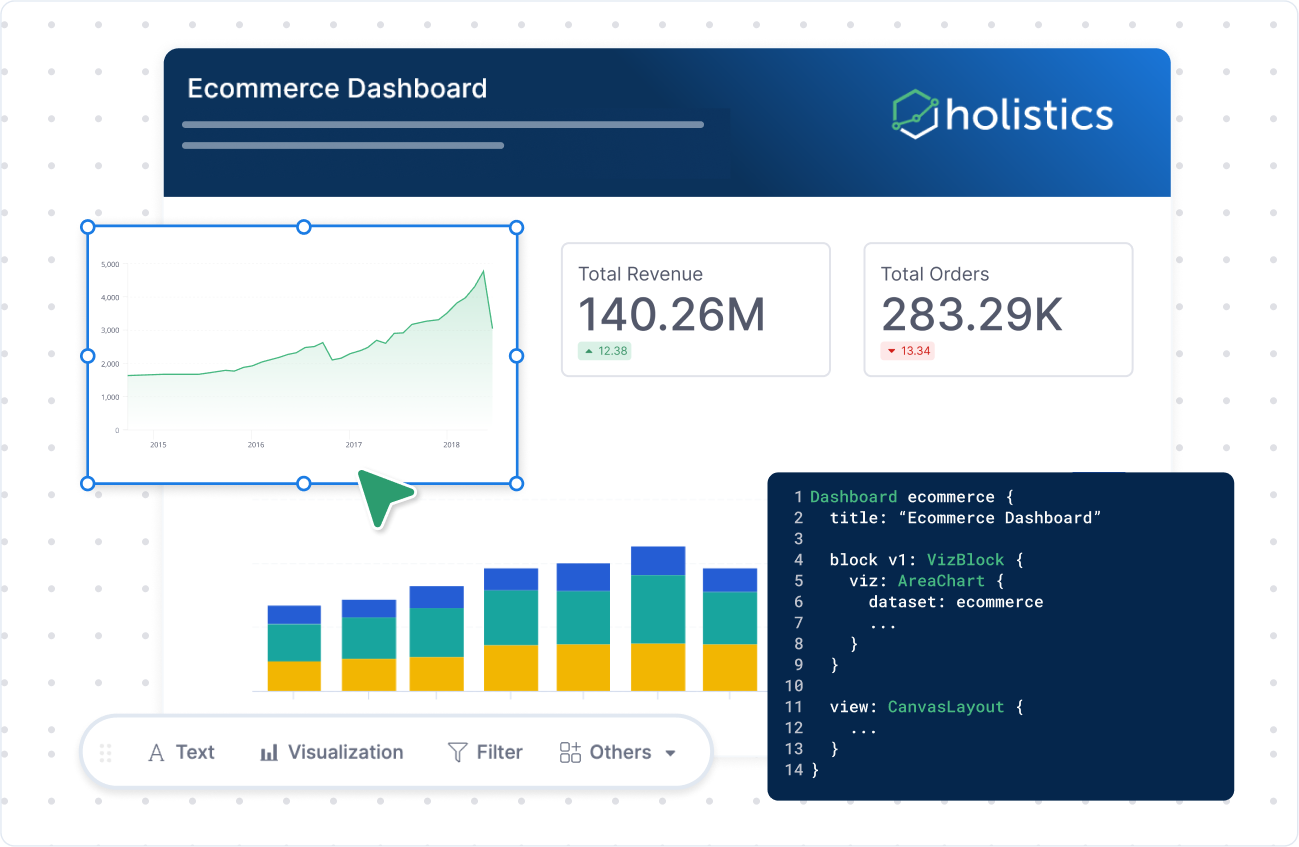
Canvas Dashboard helps you create versatile and interactive data presentations. You can combine and customize visualizations, interactive control, and text elements for various purposes, including executive dashboards, narrative reports, and operational monitoring.
Here are the key features of Holistics Canvas Dashboards:
- Canvas layout: Build dashboards that match your narrative with visualizations, filters, and texts as your building blocks. Add, remove, and rearrange blocks on a blank canvas with pixel-perfect precision.
- Definition as code: Define your dashboard as code in AMQL for version control with Git integration, reusable components, and bulk editing at scale.
- Dedicated development space: Build dashboards in the Development workspace and deploy your dashboards to production, while preventing in-progress changes disrupt the end-user's experience.

Dashboard components
Canvas Dashboards are built from modular units called analytics blocks. Think of it like constructing a LEGO castle from individual bricks. This approach provides the flexibility to create powerful dashboards tailored to your specific needs.
Holistics provides a wide range of analytics blocks: Text, Visualization, Control, and Reused blocks.
Text Block
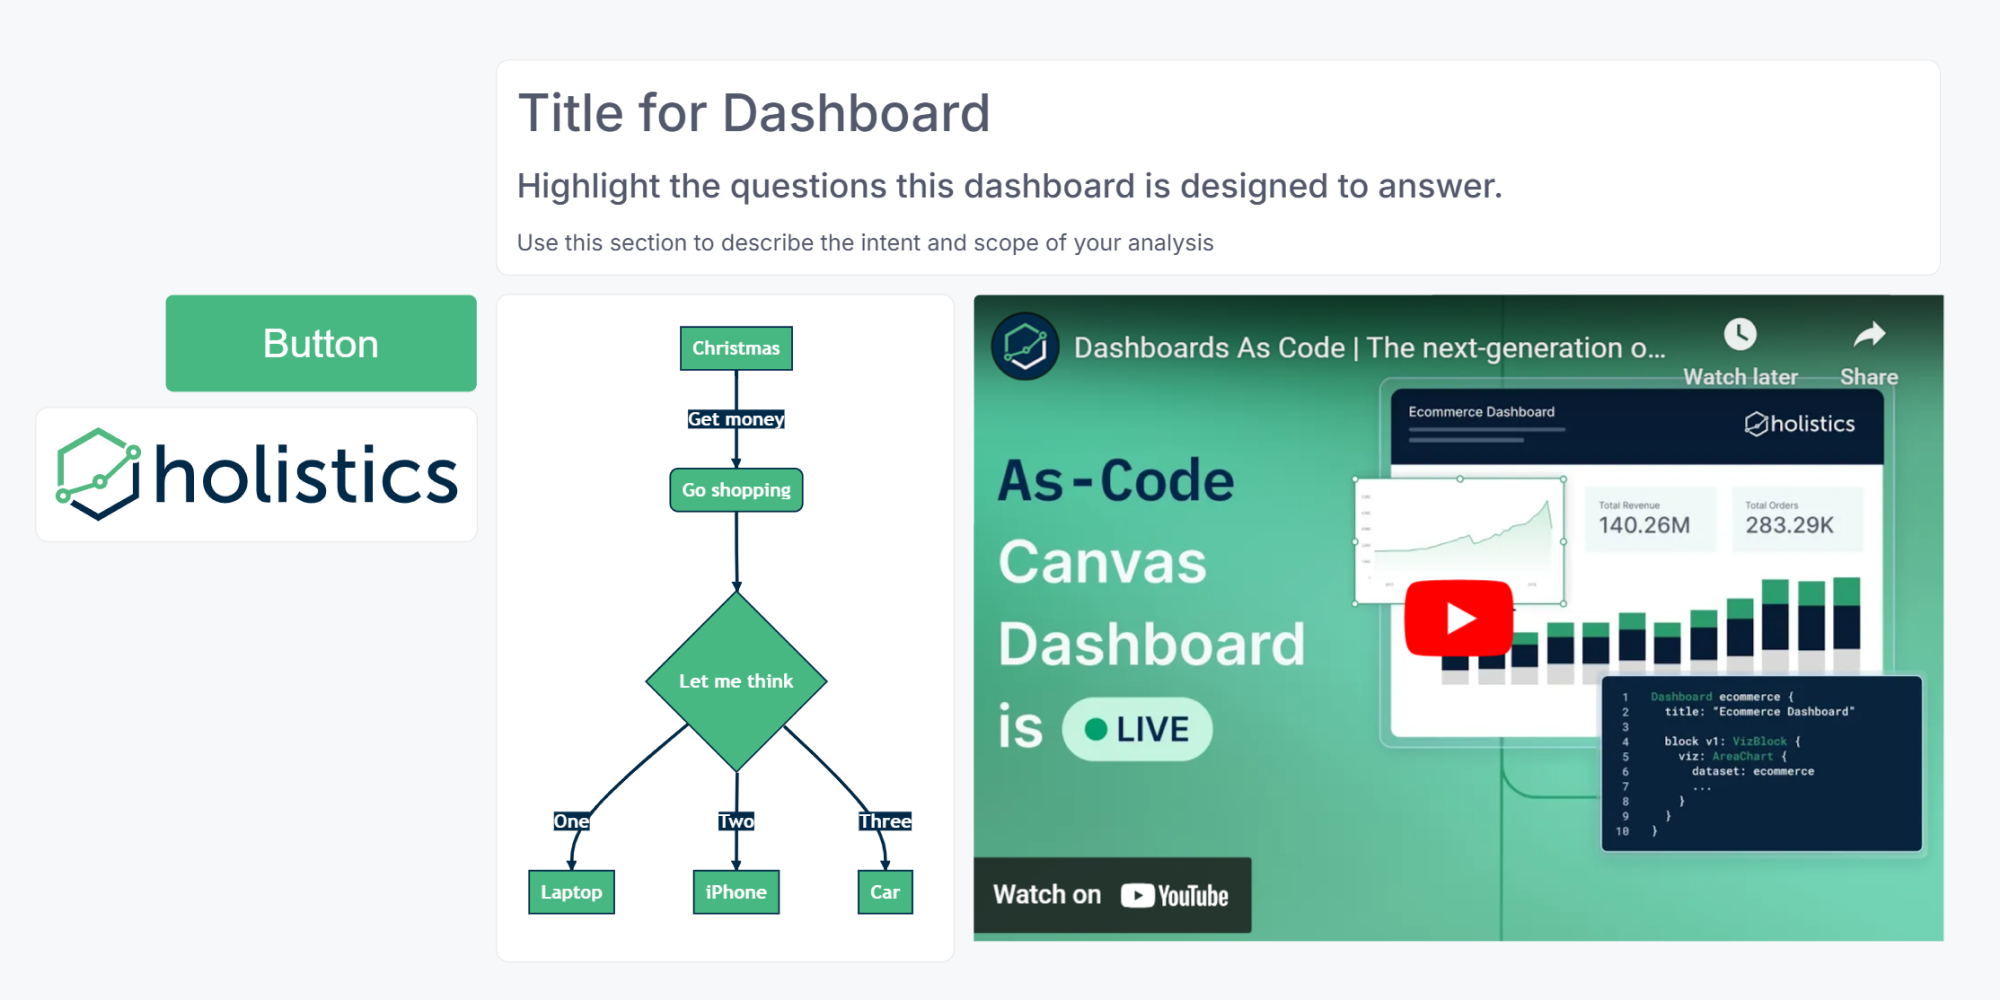
Text blocks allow you to incorporate context and information into your dashboard. They are Markdown-supported, which should serve your most common formatting requirements. You can use this to add text, images, or embed videos, etc.
For more information, you can refer to Text Block.

Visualization Block
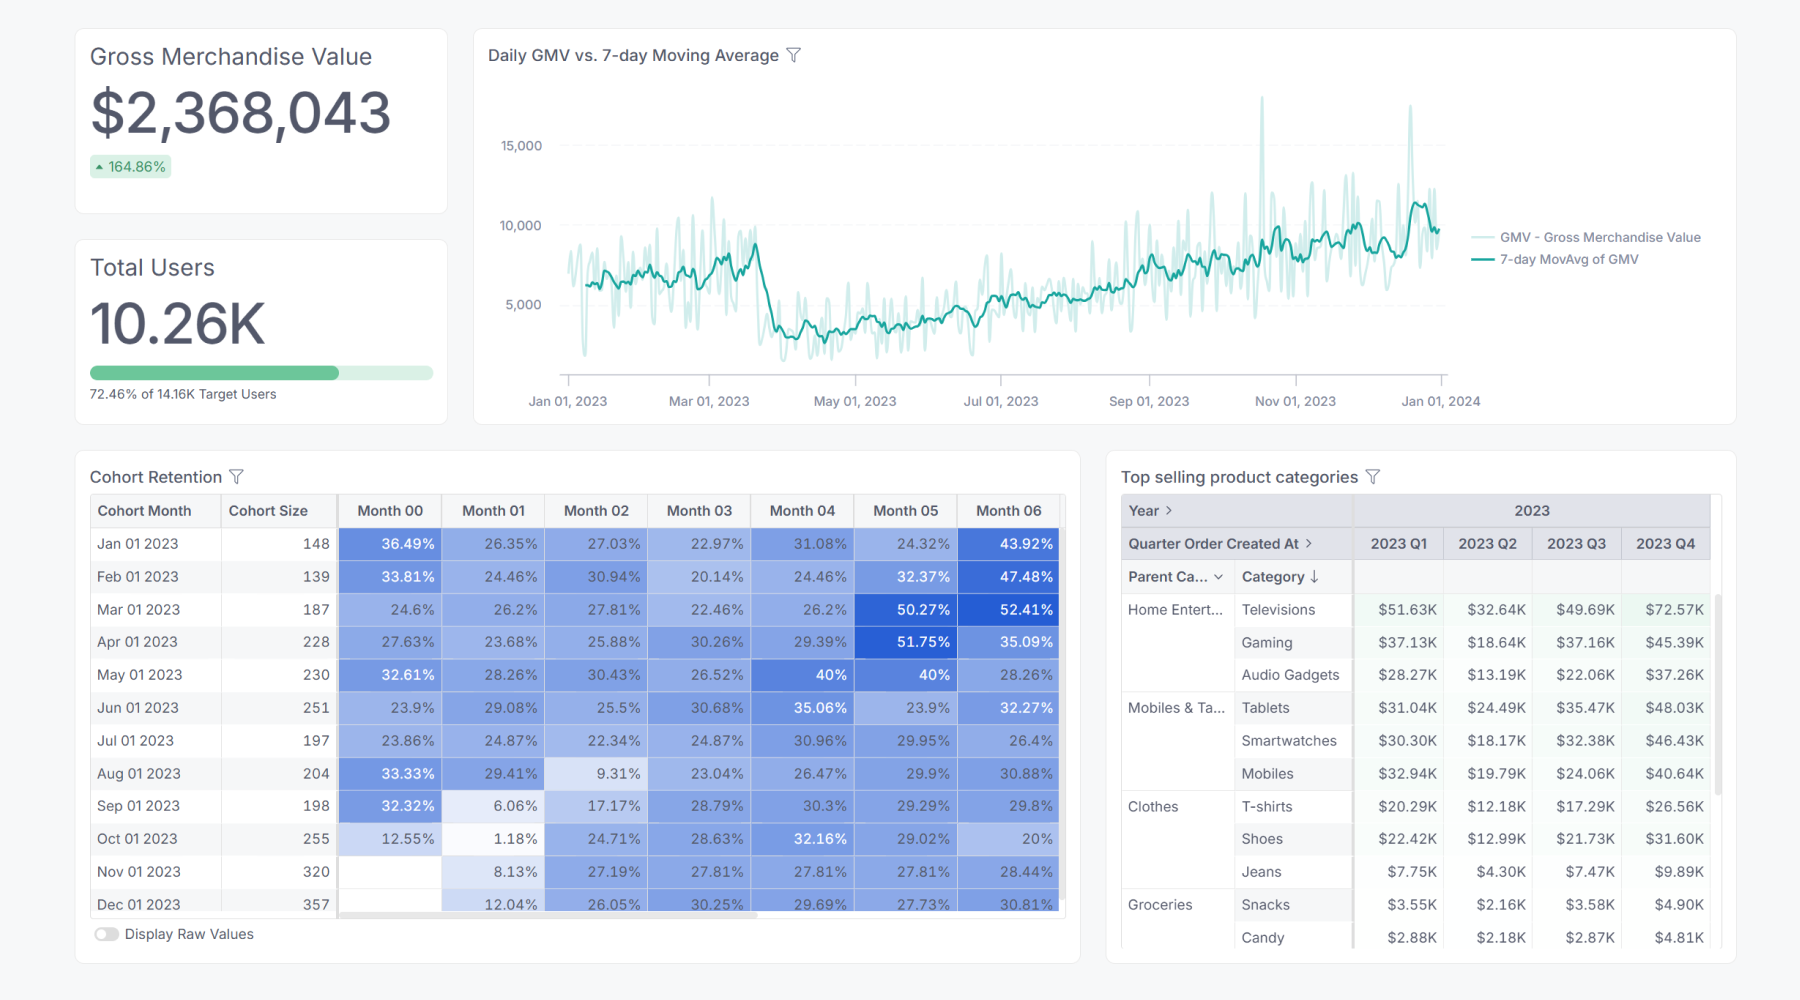
Visualization blocks allow you to add a variety of visualizations, including custom charts.
Each block contains a single visualization. You can easily combine multiple visualization blocks from various datasets on one dashboard, and even explore the underlying data directly within each block for deeper insights.
For more information, you can refer to Visualizations.

Interactive Control Block
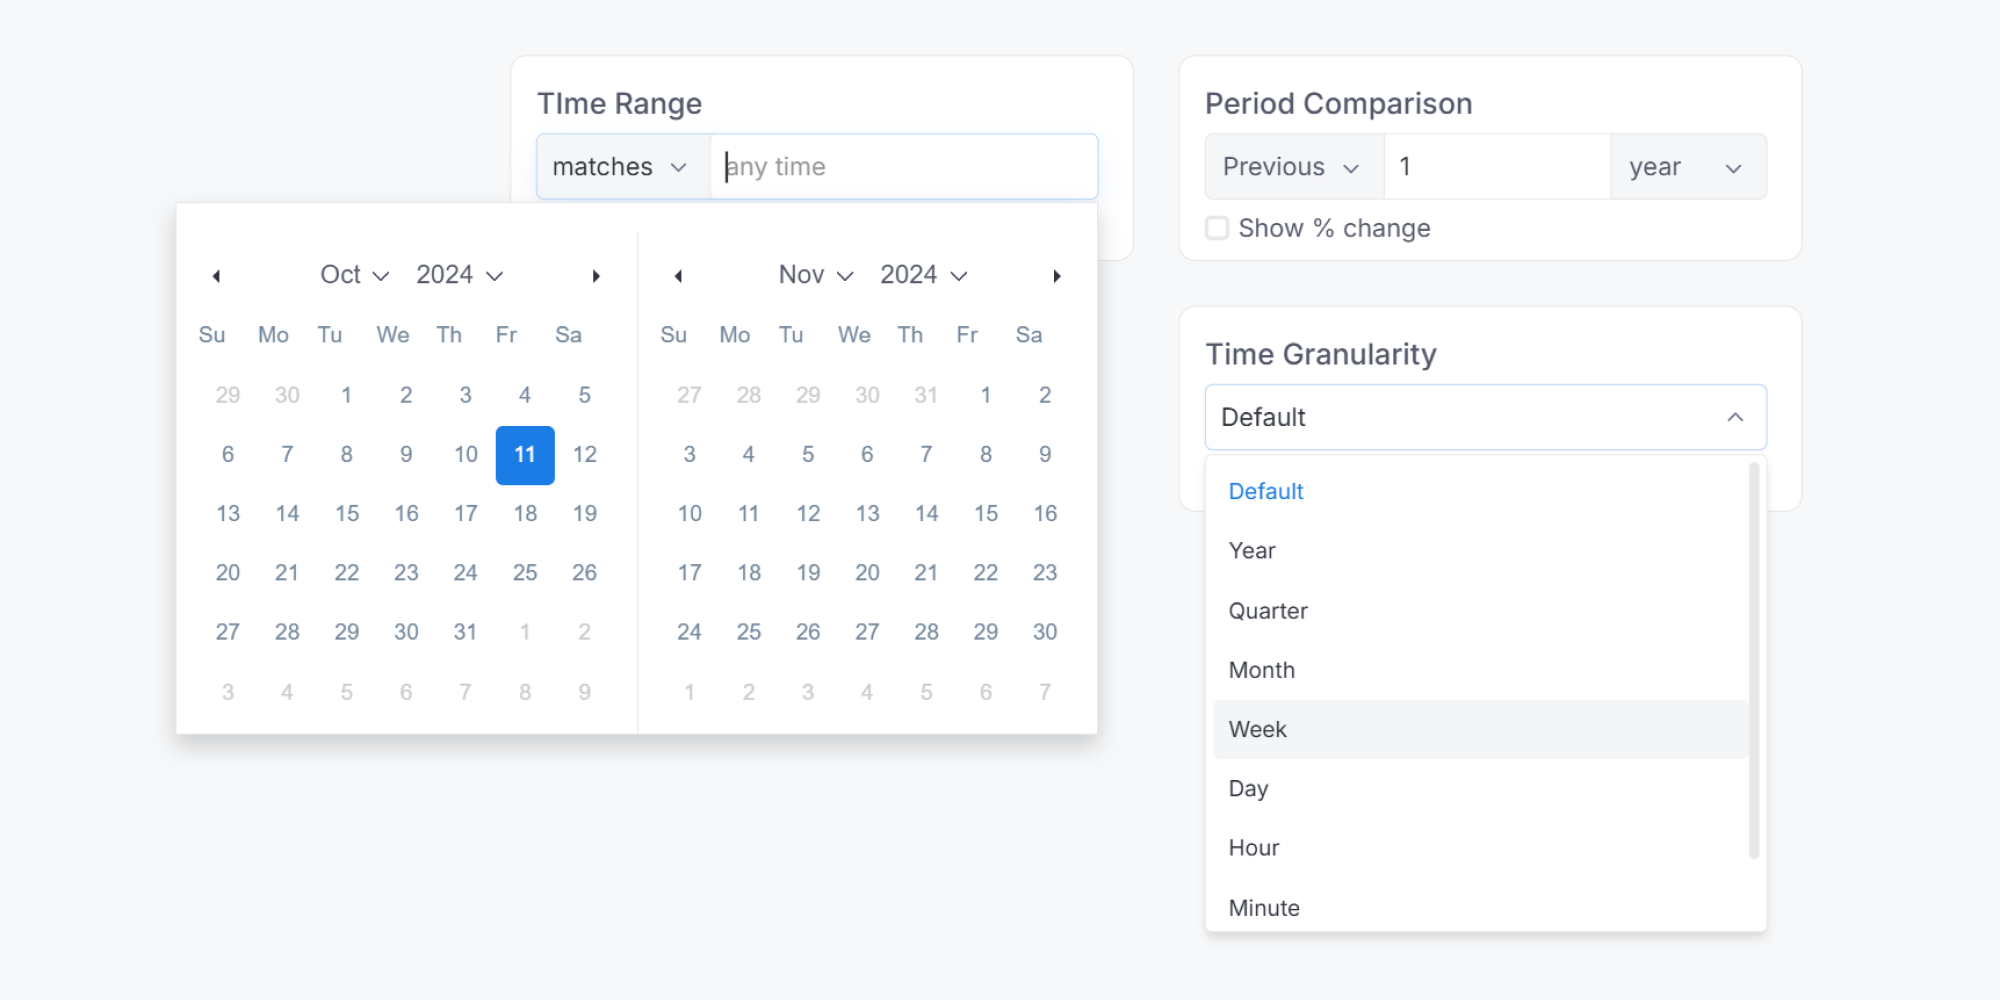
Interactive Control blocks — such as Filters, Period Comparisons, and Date Drills — allow you to manipulate data and add interactivity to your dashboard. Unlike traditional sticky filters, you can place these blocks anywhere on your Canvas, offering complete flexibility to optimize user experience.
For more information, you can refer to Filter, Period Comparison, Date Drill.

Reused Block
Reused blocks let you define a single “main block” and reference it in many dashboards. That way, you can build it once and reuse it multiple times, while having the flexibility to customize where needed.
For more information, you can refer to Reused blocks.
Dashboard as code
When you build a Canvas Dashboard, Holistics automatically generates its underlying code. This approach allows you to apply engineering best practices to your dashboard development.
This means you can:
- Govern your dashboards with Git version control
- Refactor your dashboards at scale
- Define reusable functions
- Perform code reviews
And much more.
How to create a Canvas Dashboard
Create a dashboard from scratch
You can create a new dashboard in both Development and Reporting environments:
Development (for Admins / Analysts): This environment is designed for creating, modifying, and reviewing dashboard changes with full version control. In addition, you’ll get access to both a Code editor and a Visual editor, allowing you to work directly with our Analytics Modeling Language (AML) or use a drag-and-drop interface. Learn more in Developing in Development.
Reporting (for all authorized users, except for Viewers): This environment is ideal for exploring data and making minor changes if you have the necessary permissions. It offers only the Visual editor, which means you'll have limited access to the more powerful “as-code” functionalities. Learn more in Developing in Reporting.
Save explore result to a dashboard
When you find something meaningful when exploring a dataset, you can save your results. Holistics allows you to save exploration results directly to an existing dashboard or to a new one.
- Development (for Analyst / Admin): Build, edit, and manage your data workflow with software engineering best practices. Only Canvas Dashboard is available.
- Reporting (for Anyone, with permission): Explore and consume data with a self-service and no-code interface. Both Quick Dashboard and Canvas Dashboard are available.
FAQs
1. How can we get access to the Canvas Dashboard?
Canvas Dashboard is available exclusively on Holistics version 4.0. Please ensure you are using this version. If not, you can migrate your Holistics instance to version 4.0.
2. What happens to my existing dashboards if I migrate from Holistics version 3.0 to 4.0?
There will be no changes to your existing dashboards. Version 4.0 supports both Canvas Dashboard and Quick Dashboard (the version of your dashboards). Your existing dashboards will continue to work as expected.
However, we strongly recommend converting them to Canvas Dashboards, because this would unlock full “as-code” editing capabilities, greater flexibility, and advanced customization options.
3. I'm using both Canvas Dashboards and Quick Dashboards. Is the older version going to be deprecated, and when?
While there is currently no finalized plan, we are considering the end of 2025 as the earliest potential timeframe for deprecating the Quick Dashboard.
However, we will provide customers with at least six-month advance notice before any deprecation occurs, once the timeline is confirmed.
4. How to generate a Canvas Dashboard from a Quick Dashboard?
Prerequisites:
To convert a Quick Dashboard to a Canvas Dashboard, ensure the following:
- You are on Holistics version 4.0.
- You have an Admin or Analyst role.
How to generate: Click “Generate Canvas Dashboard” button on your Quick Dashboard, and confirm.
- This process doesn't affect your original Quick Dashboard. You'll have two separate dashboards: the original Quick Dashboard and the newly created Canvas Dashboard.
- The new Canvas Dashboard might not perfectly match the visual style of your old dashboard due to design differences. We recommend reviewing the preview version first.