Quickstart
Introduction
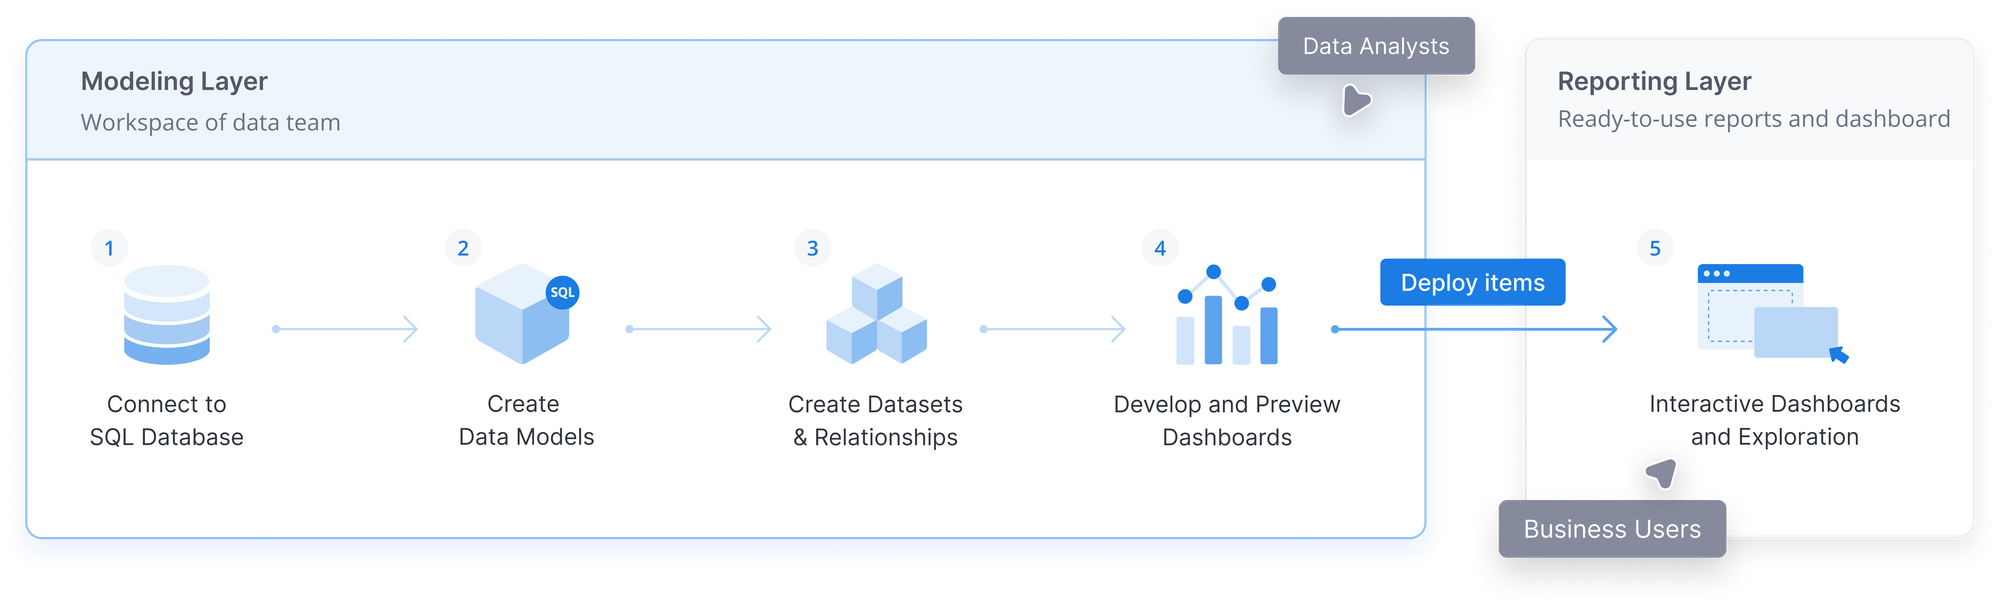
Building analytics in Holistics follows a structured workflow that turns raw database tables into dashboards and reports. The workflow cleanly separates development from production, so you can iterate safely without affecting your end users.
The journey progresses through three layers:
| Layer | What You Build | Purpose |
|---|---|---|
| Data Sources | Database connections | Connect to your data warehouses |
| Modeling | Data models, datasets | Define business logic and relationships |
| Reporting | Explorations, ad-hoc reports, dashboards | Visualize and share insights |
This guide walks you through each step of the development workflow:
- Connect to a database
- Enable development mode
- Develop data models
- Develop datasets
- Develop dashboards
- Commit changes and publish
- Explore data and build reports
1. Connect to a database
Your database connection is the foundation of everything in Holistics. All data models, datasets, and reports build on top of the tables in your connected data warehouse.
For detailed setup instructions, see Connect to a Database.
Before you can start modeling, make sure you have connected to at least one database. Holistics supports a wide range of databases including PostgreSQL, MySQL, BigQuery, Snowflake, and more.
2. Enable development mode
The Development/Production separation is what makes it safe to iterate on your analytics. In Development Mode, you can freely modify models, datasets, and dashboards without affecting the reports your end users are viewing in Production.
For more details on the two modes, see Mode & Deployment.
To enable Development Mode, navigate to the Development workspace and click the toggle to switch from Production Mode to Development Mode.
3. Develop data models
Data models are abstract representations of your database tables. They let you define business logic, add calculated fields, and enrich raw data with metadata, all without modifying the underlying database.
For detailed instructions, see Data Models and AML Model syntax.
Holistics supports two types of data models:
| Model Type | Description | Use Case |
|---|---|---|
| Table Model | Maps directly to an existing database table | When you want to expose a table as-is with added metadata |
| Query Model | Defined by custom SQL that selects from tables or other models | When you need to clean up data, perform calculations, or define reusable business logic in SQL |
You can create models using either the visual GUI or by writing AML code directly in the Development workspace.
Creating a Table Model:
Creating a Query Model:
4. Develop datasets
Datasets connect your data models together with relationships, making them available for exploration. Think of a dataset as a curated collection of related models that business users can query without writing SQL.
For detailed instructions, see Datasets and AML Dataset syntax.
A dataset includes:
- Models: The data models included in the dataset
- Relationships: How models connect to each other (e.g.,
orders.user_id > users.id)
In Holistics, you can design your dataset following proven modeling patterns like star schema, galaxy schema, or snowflake schema depending on your analytical needs.
Once published, datasets appear in the Reporting tab where users can explore them with a drag-and-drop interface.
5. Develop dashboards
Dashboards combine visualizations, filters, and interactive controls into a single view for end users. In Holistics, dashboards are defined in AML code, which gives you full control over layout, interactions, and styling with the benefits of version control and reusability.
For detailed instructions, see Canvas Dashboard and AML Dashboard syntax.
A dashboard consists of:
- Blocks: Visual components like charts (VizBlock), text (TextBlock), filters (FilterBlock), and date drills (DateDrillBlock)
- Interactions: Define how blocks interact with each other (e.g., filters affecting charts)
- Views: Control the layout and positioning of blocks on the canvas
- Settings: Configure timezone, caching, and other dashboard-level options
To create a dashboard, add a new file with the extension .page.aml (e.g., my_dashboard.page.aml) in the Development workspace.
6. Commit changes and publish
This is where your work moves from development to production. Publishing makes your models, datasets, and dashboards available to end users in the Reporting tab.
Commit changes
This step is necessary only if you're using Holistics Git Flow. Otherwise, skip directly to Publish.
If you've connected an external Git repository, commit your changes before publishing. Click Commit changes & Push, update the commit message if needed, and then Commit and push.
Publish
Click Publish to deploy your changes to production. Your datasets and dashboards will now be available in the Reporting tab.
7. Explore data and build reports
Your data is now ready for exploration. After publishing, your datasets appear in the Reporting tab where you and your team can start discovering insights.
With published datasets, users can:
- Explore with drag-and-drop: Select dimensions and measures, apply filters, and visualize data without writing SQL
- Ask Holistics AI: Use natural-language questions to query your governed semantic layer through Holistics AI
- Create visualizations: Build charts, tables, and other visualizations from your curated datasets
- Save to dashboards: Capture meaningful explorations and add them to dashboards for ongoing monitoring
To learn more about what you can do with your data, see:
- Data Exploration: Learn the drag-and-drop exploration interface
- Holistics AI: Ask questions in natural language against your governed semantic layer
- Visualizations: Explore available chart types and formatting options
8. Share data
Insights are useful when they reach the people who need them. Holistics gives you several ways to distribute the dashboards and reports you build:
- Dashboards: Share with your team inside the Reporting workspace.
- Scheduled deliveries: Send dashboards or data extracts on a schedule via email, Slack, Google Sheets, or SFTP. See Sharing data.
- Embedded analytics: Embed dashboards and AI in your own product through the Embedded Analytics suite. The same governed semantic layer powers internal and customer-facing surfaces, so one definition serves both.
FAQs
What happens if my modeling changes break existing dashboards and reports?
When you modify models or datasets, downstream dashboards and reports may be affected:
- Dashboards in Public workspace: You'll need to fix errors before publishing. This ensures shared content remains functional for all users.
- Dashboards in Personal workspace: You can still publish, but you'll receive a notification about which personal dashboards are broken.
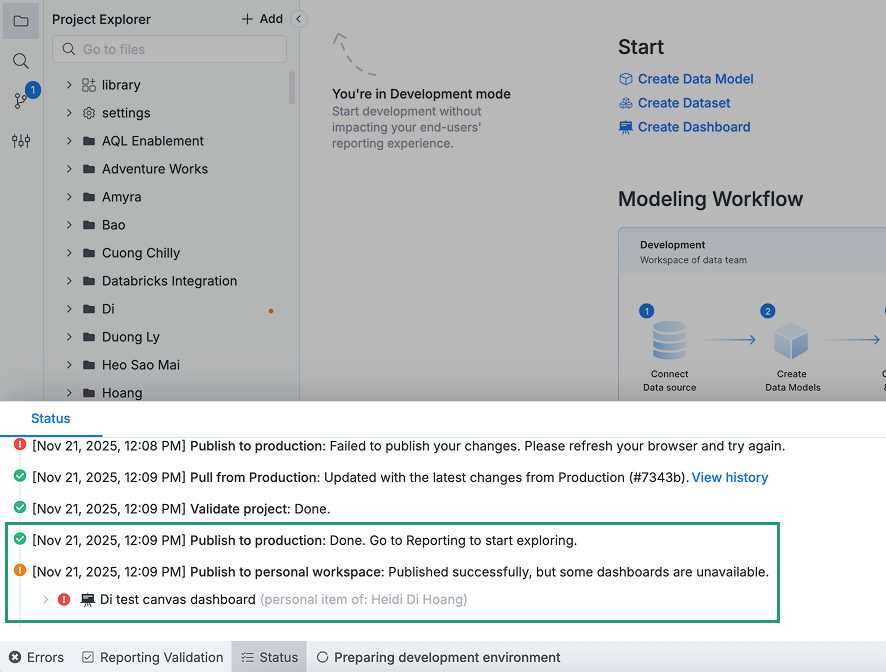
The broken dashboard in Personal workspace will look like this in Reporting:
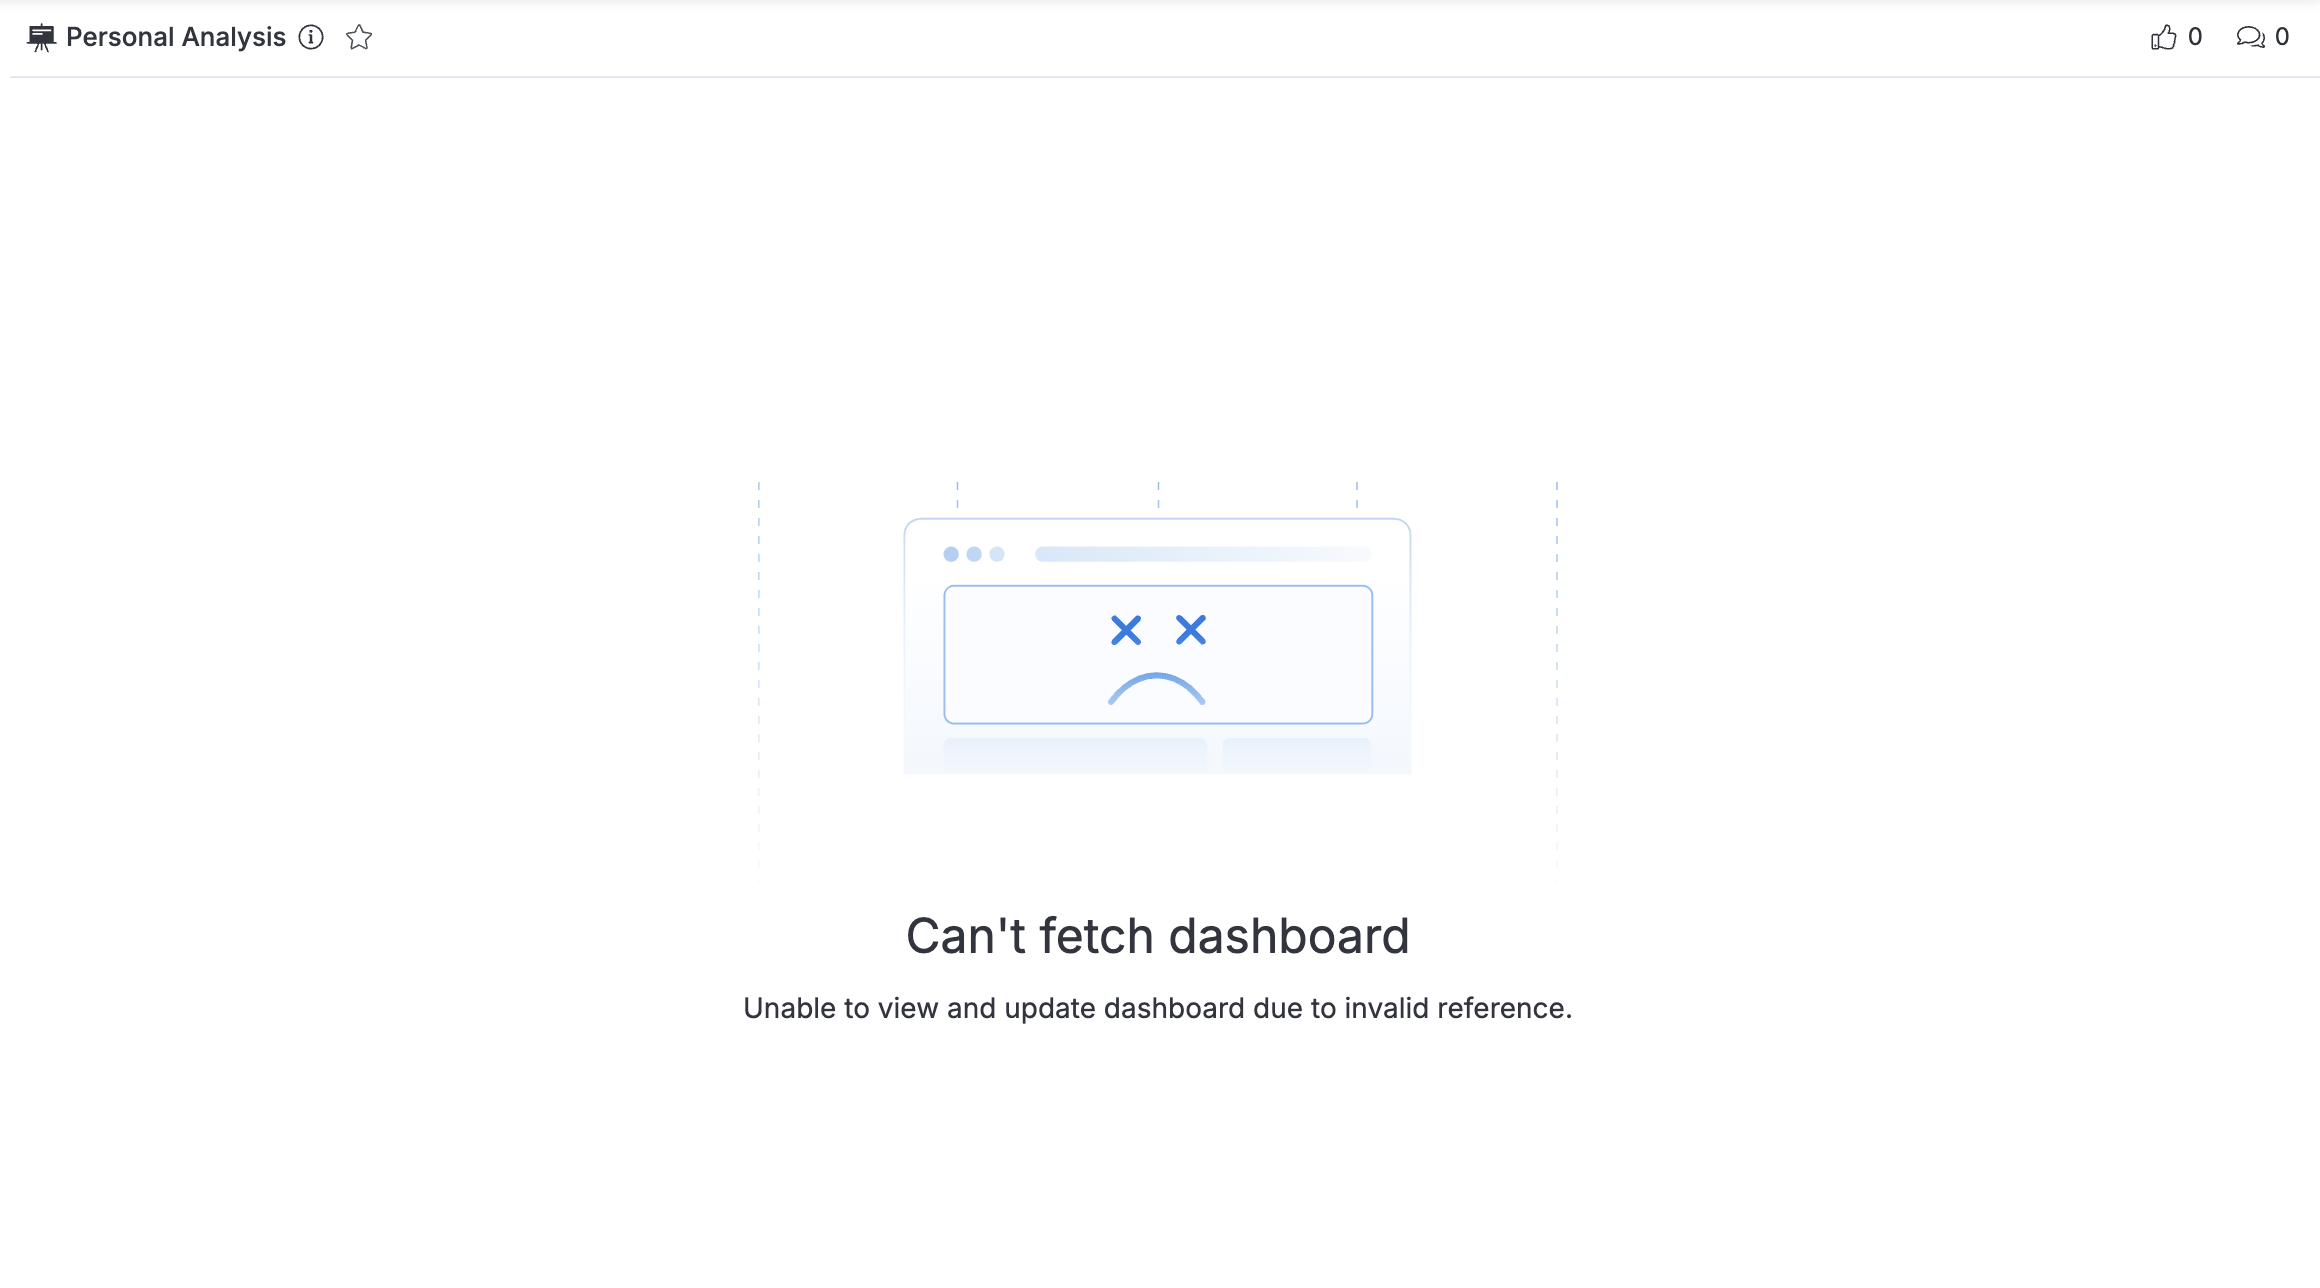
Personal Canvas dashboards can only be viewed and edited in Reporting, not in Development. If you need to fix a broken personal dashboard, contact [email protected].
We're considering adding support for personal Canvas dashboards in Development in the future.