Embedded Analytics
Put dashboards and self-service analytics right inside your own product.
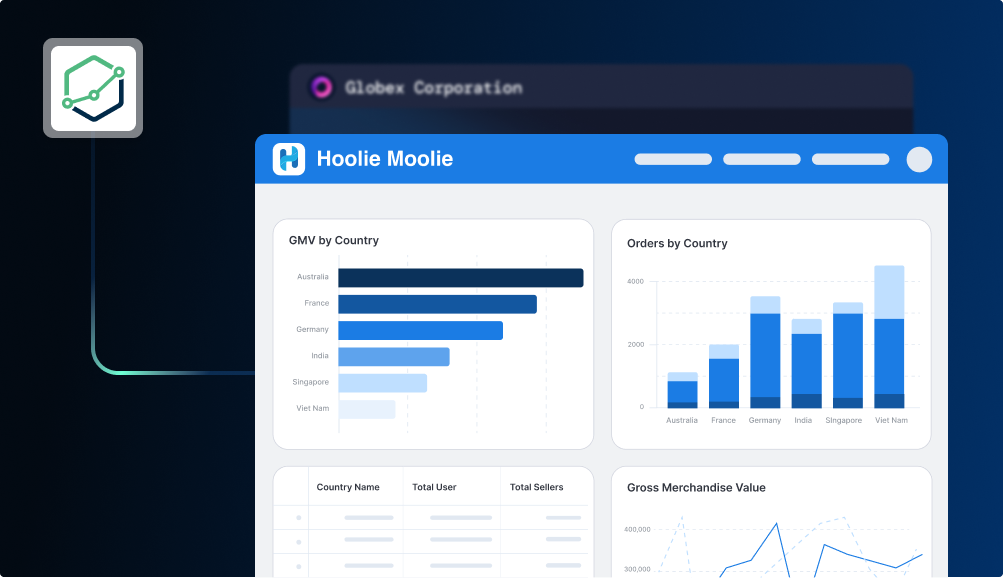
With Embedded Analytics, you can embed specific dashboards (or a full analytics portal) directly into your own application. Your users get analytics that look and feel like a native part of your product, without ever leaving your app.
Under the hood, it works by generating a signed URL that you load in an iframe. The URL identifies the content, the viewer, and their permissions. Each user only sees the data they're allowed to.
Think: customer usage dashboards in your SaaS app, per-client reports filtered to each organization's data, or internal operational dashboards for your team. Here's what you get out of the box:
- No build from scratch: embed pre-built dashboards instead of writing custom analytics code
- Your app, your brand: white-label the look, domain, and experience to match your product
- Secure multi-tenancy: row-level permissions filter each report to the viewer's own data, mapped to your existing user system
- Self-service exploration: let users build their own dashboards and explore data
- Developer friendly: define portals as code, with Git integration, sandbox testing, and preview environments
Get started
Pick the entry point that matches where you are. If you're new, start with the Quickstart.
Two approaches to embedding
Holistics offers two ways to embed analytics: Single Dashboard and Embed Portal.
| Single Dashboard | Embed Portal | |
|---|---|---|
| What it is | Embed a single dashboard | Embed a mini BI app with multiple dashboards. |
| Setup time | ~5 minutes | ~15-20 minutes |
| User can | View, filter, export static dashboards | Basic (single dashboards) + Explore, create, collaborate with others |
| Best for | Static reporting, quick wins | Self-service analytics, more advanced functionalities |
| Navigation | Handled by your dev team, more flexible | Provided by embed portal |
Do your users need to create their own dashboards or explore data freely?
- Yes → Use Embed Portal
- No → Use Single Dashboard
Start with Single Dashboard. It takes about 5 minutes to set up. You can upgrade to Embed Portal later without losing any work.
Go further
Once you have a basic embed working, these guides cover production concerns.