Report running mechanism
What happens when you open a report?
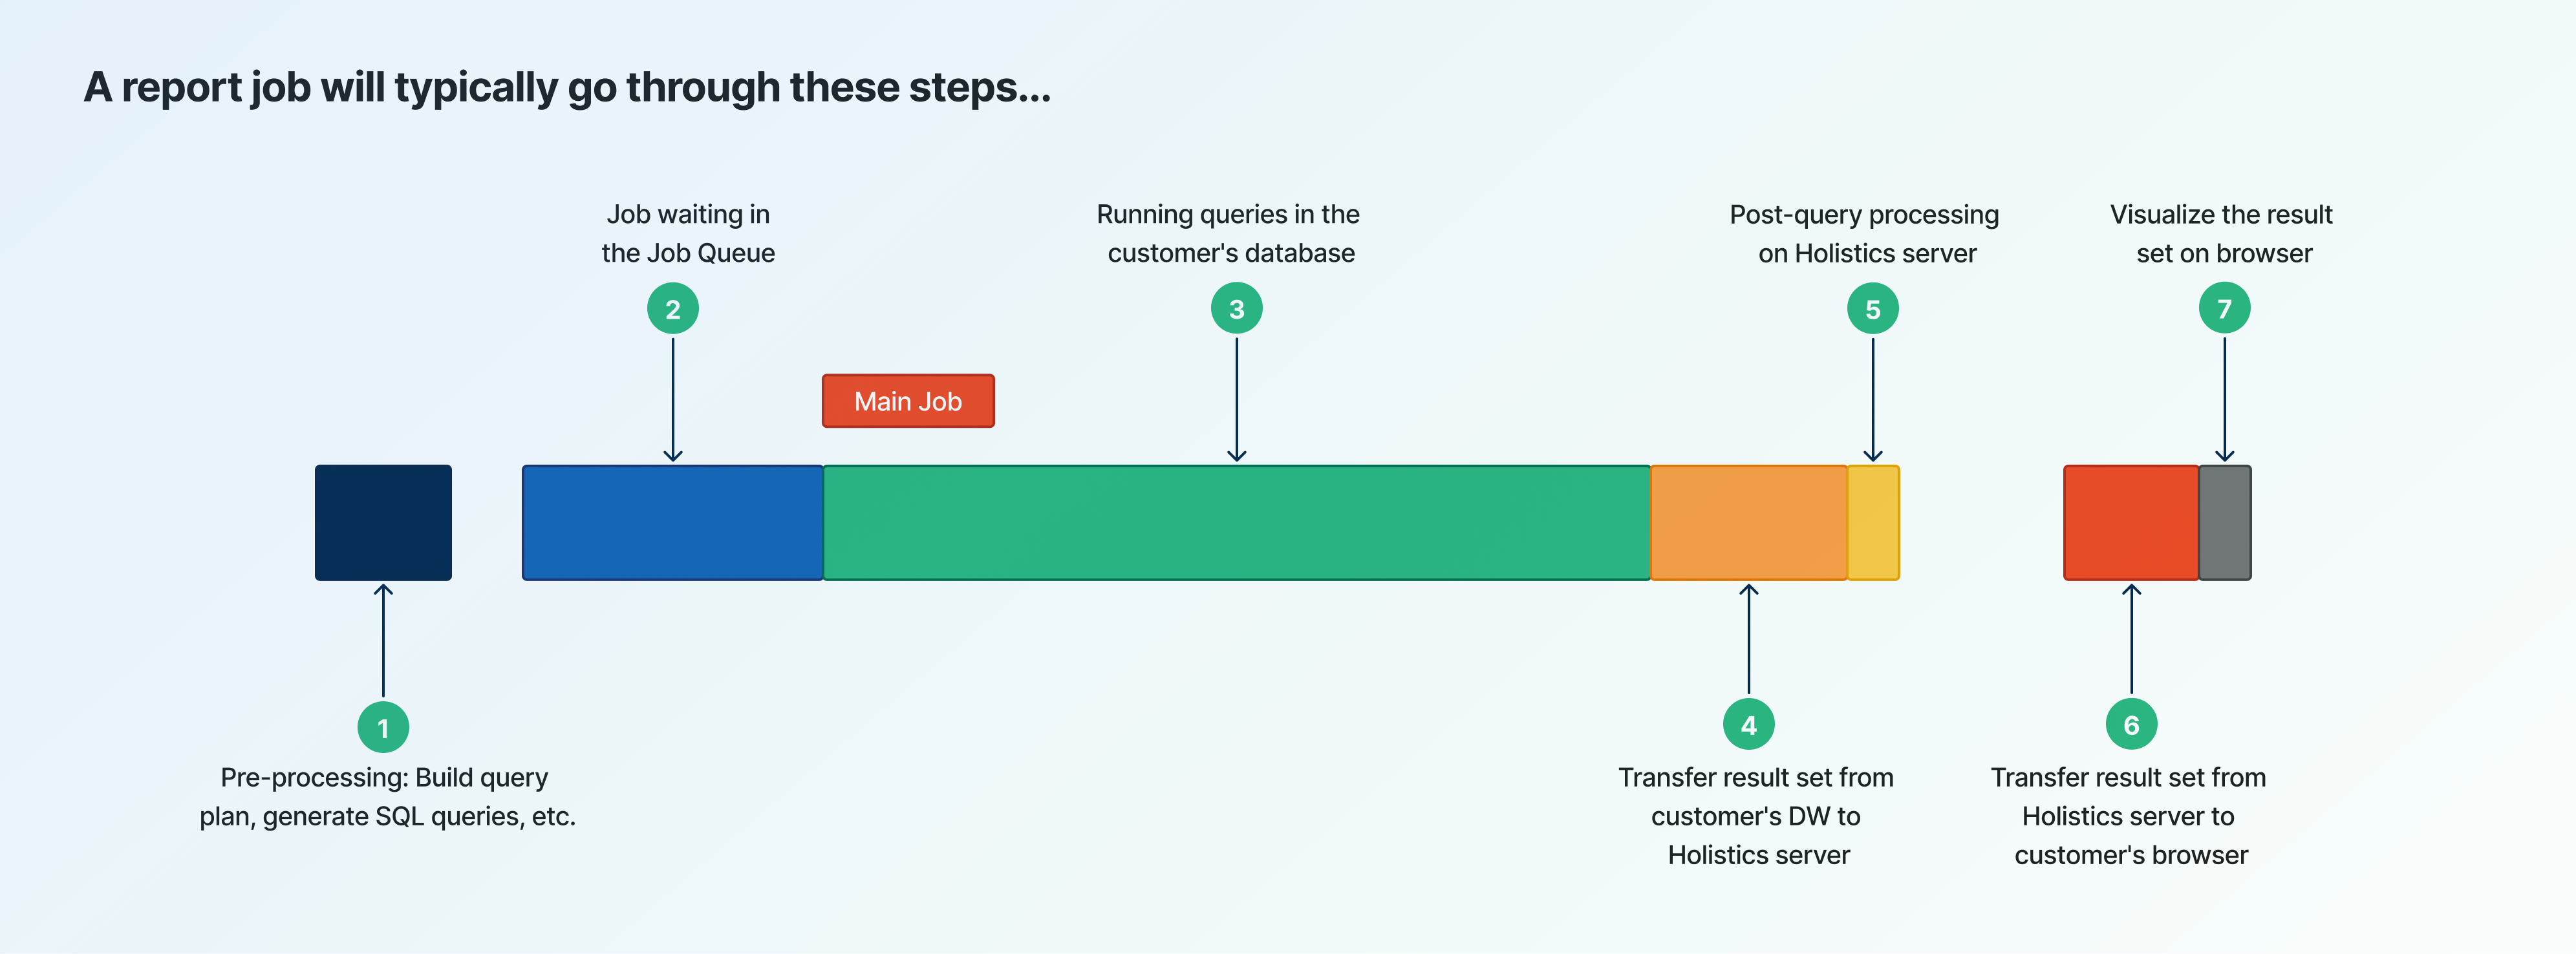
When a user opens a report (a chart) in Holistics, it will typically go through these steps:
- Pre-Query Processing: Pre-query processing tasks like parsing the modeling layer, applying permission rules, building the query plan, etc.
- Job Queuing: A new job is pushed into the Job Queue, waiting for the next available worker.
- Query Execution: SQL query is executed against the customer’s Data Warehouse.
- Transfer the result set to Holistics server: Once the query finishes, the result set is transferred to Holistics servers.
- Post-Query Processing: Once the query is finished, the result set then goes through additional processing, mainly consisting of caching operations.
- Transfer the result set to user’s browser: The result set (or a part of it) is transferred to the user’s browser.
- Visualize the result set on user's browser: The visualizations are rendered from the result set on the user's browser.
Note
If the query result is cached, step 2 to 5 of this flow would not be executed.
Understanding the above process will help us pinpoint the bottlenecks and factors that cause performance problems with your reports. It is important to determine which steps are causing the problem, then troubleshoot the underlying issues.
Can Holistics work with large volumes of data?
To answer this question, let's look at this simplified flow of a single Report execution:
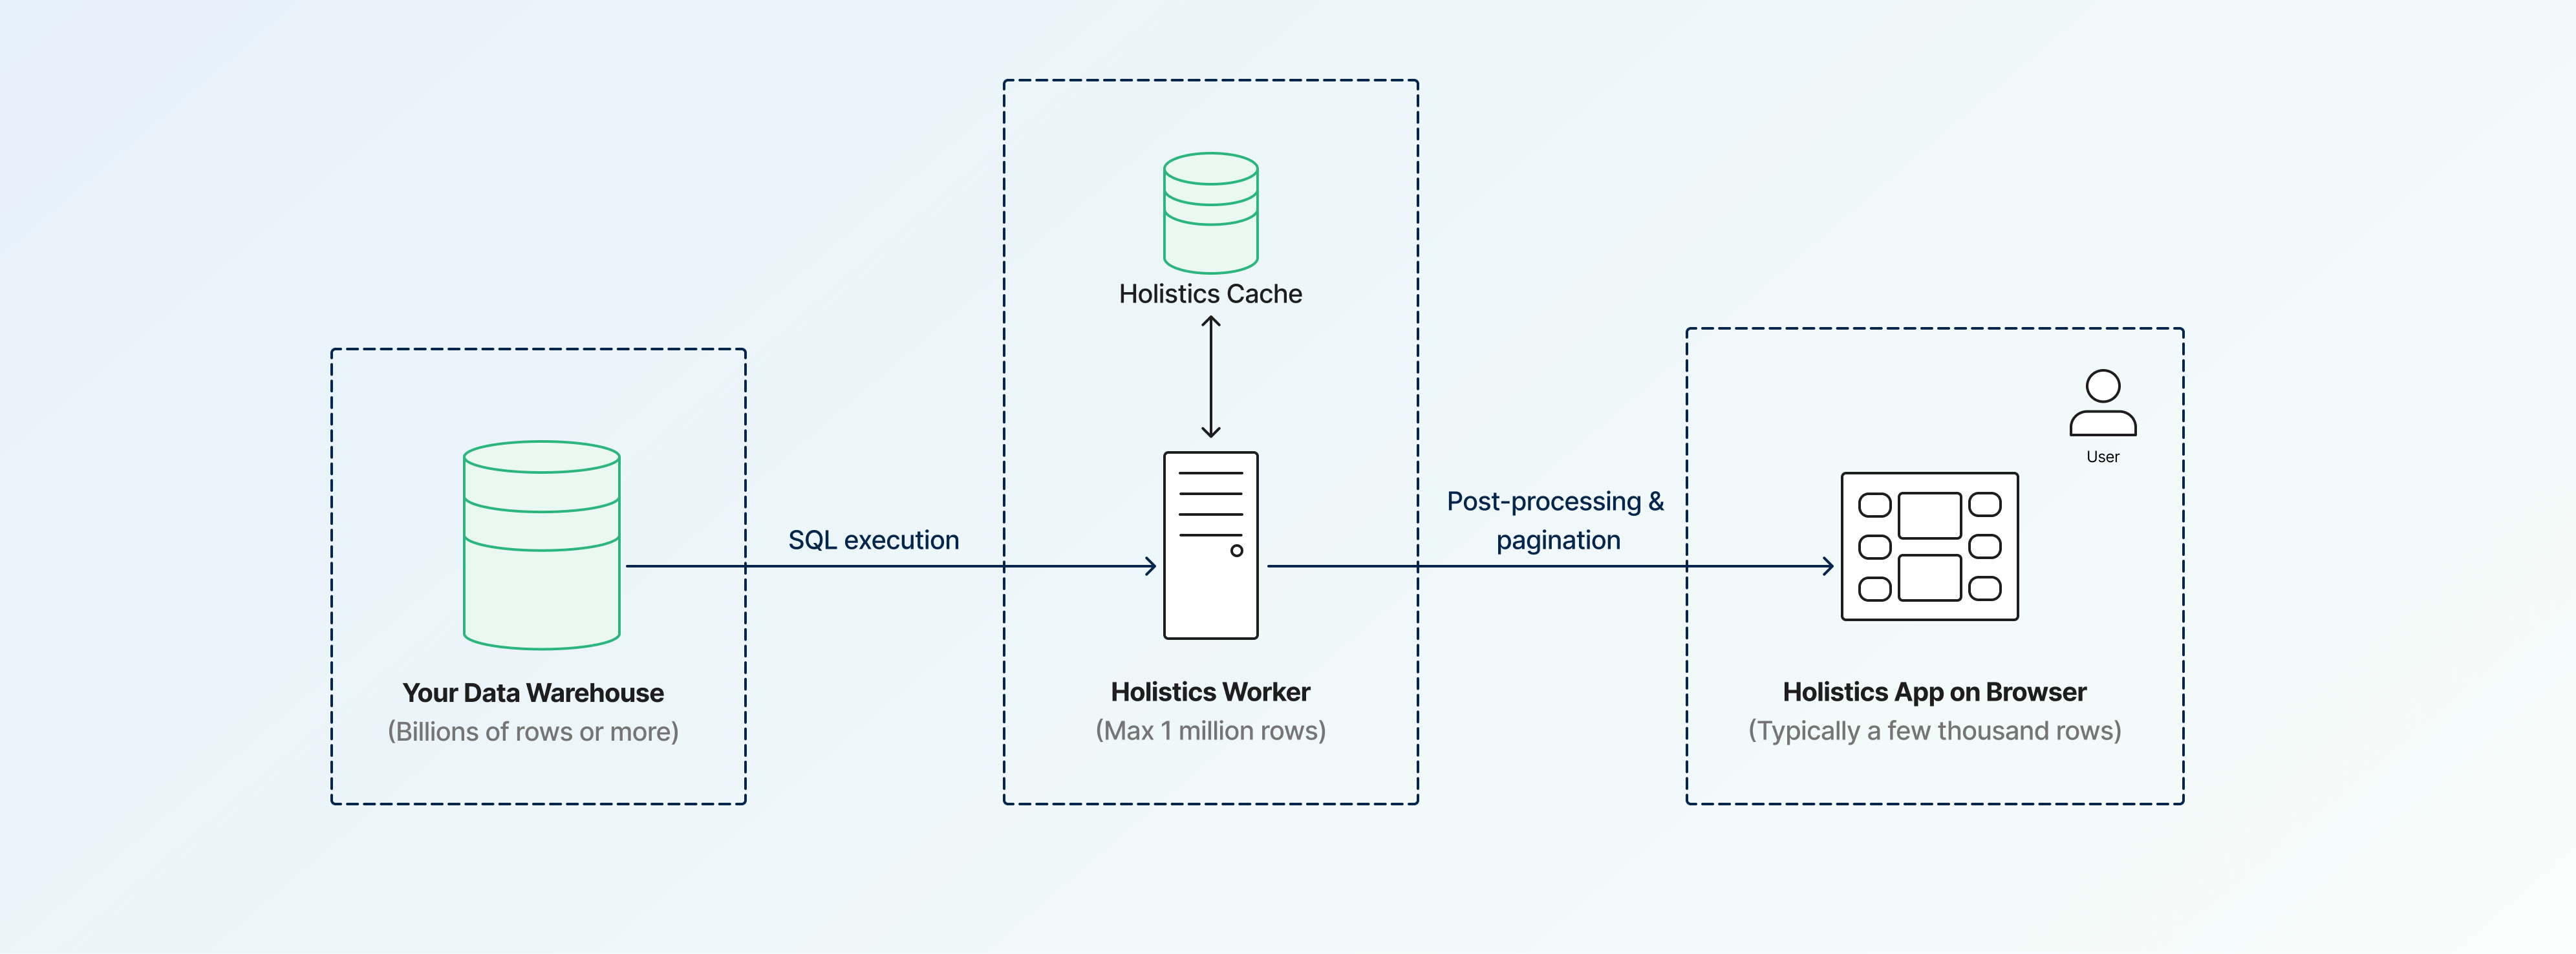
- Holistics does not have any constraint on the amount of data on your Data Warehouse.
- Your Data Warehouse can have billions of rows or more, per its own capacity and capabilities.
- Thus, Holistics can technically work with any amount of data on the Data Warehouse.
- In the SQL execution step:
- Holistics only fetches 1 million rows (at maximum) from the SQL result.
- To learn more about this limit, see Row limits.
- To reduce the default limit to better control report performance, go to Admin Settings -> Visualization -> Default Records Limit
- The speed of this step depends mostly on the speed of your Data Warehouse.
- Holistics only fetches 1 million rows (at maximum) from the SQL result.
- When fetching data from Holistics Worker to the browser:
- For table-like visualizations (e.g. Data Table, Pivot Table):
- Holistics automatically apply pagination where applicable, so that it efficiently fetches and renders necessary data only.
- For non-table visualizations (e.g. Column Chart, Pie Chart):
- It can get slower when there are more data points to visualize (e.g. > 10K rows/data points), as it negatively affects the browser performance.
- In general, having fewer data points in charts will make them faster and more usable/readable to end-users.
- For table-like visualizations (e.g. Data Table, Pivot Table):