Aggregate Awareness
Aggregate Awareness is now in open beta. You can read the announcement blog post.
Introduction
As data volumes grow, large raw tables with millions to billions of rows can slow down query runtime. To optimize performance, data analysts often build pre-aggregated tables. These tables store condensed versions of the data and are used frequently to reduce query time.
However, manually maintaining these tables requires significant effort. Depending on what fields each query needs, users need to manually pick the correct table for accuracy and maximum performance.
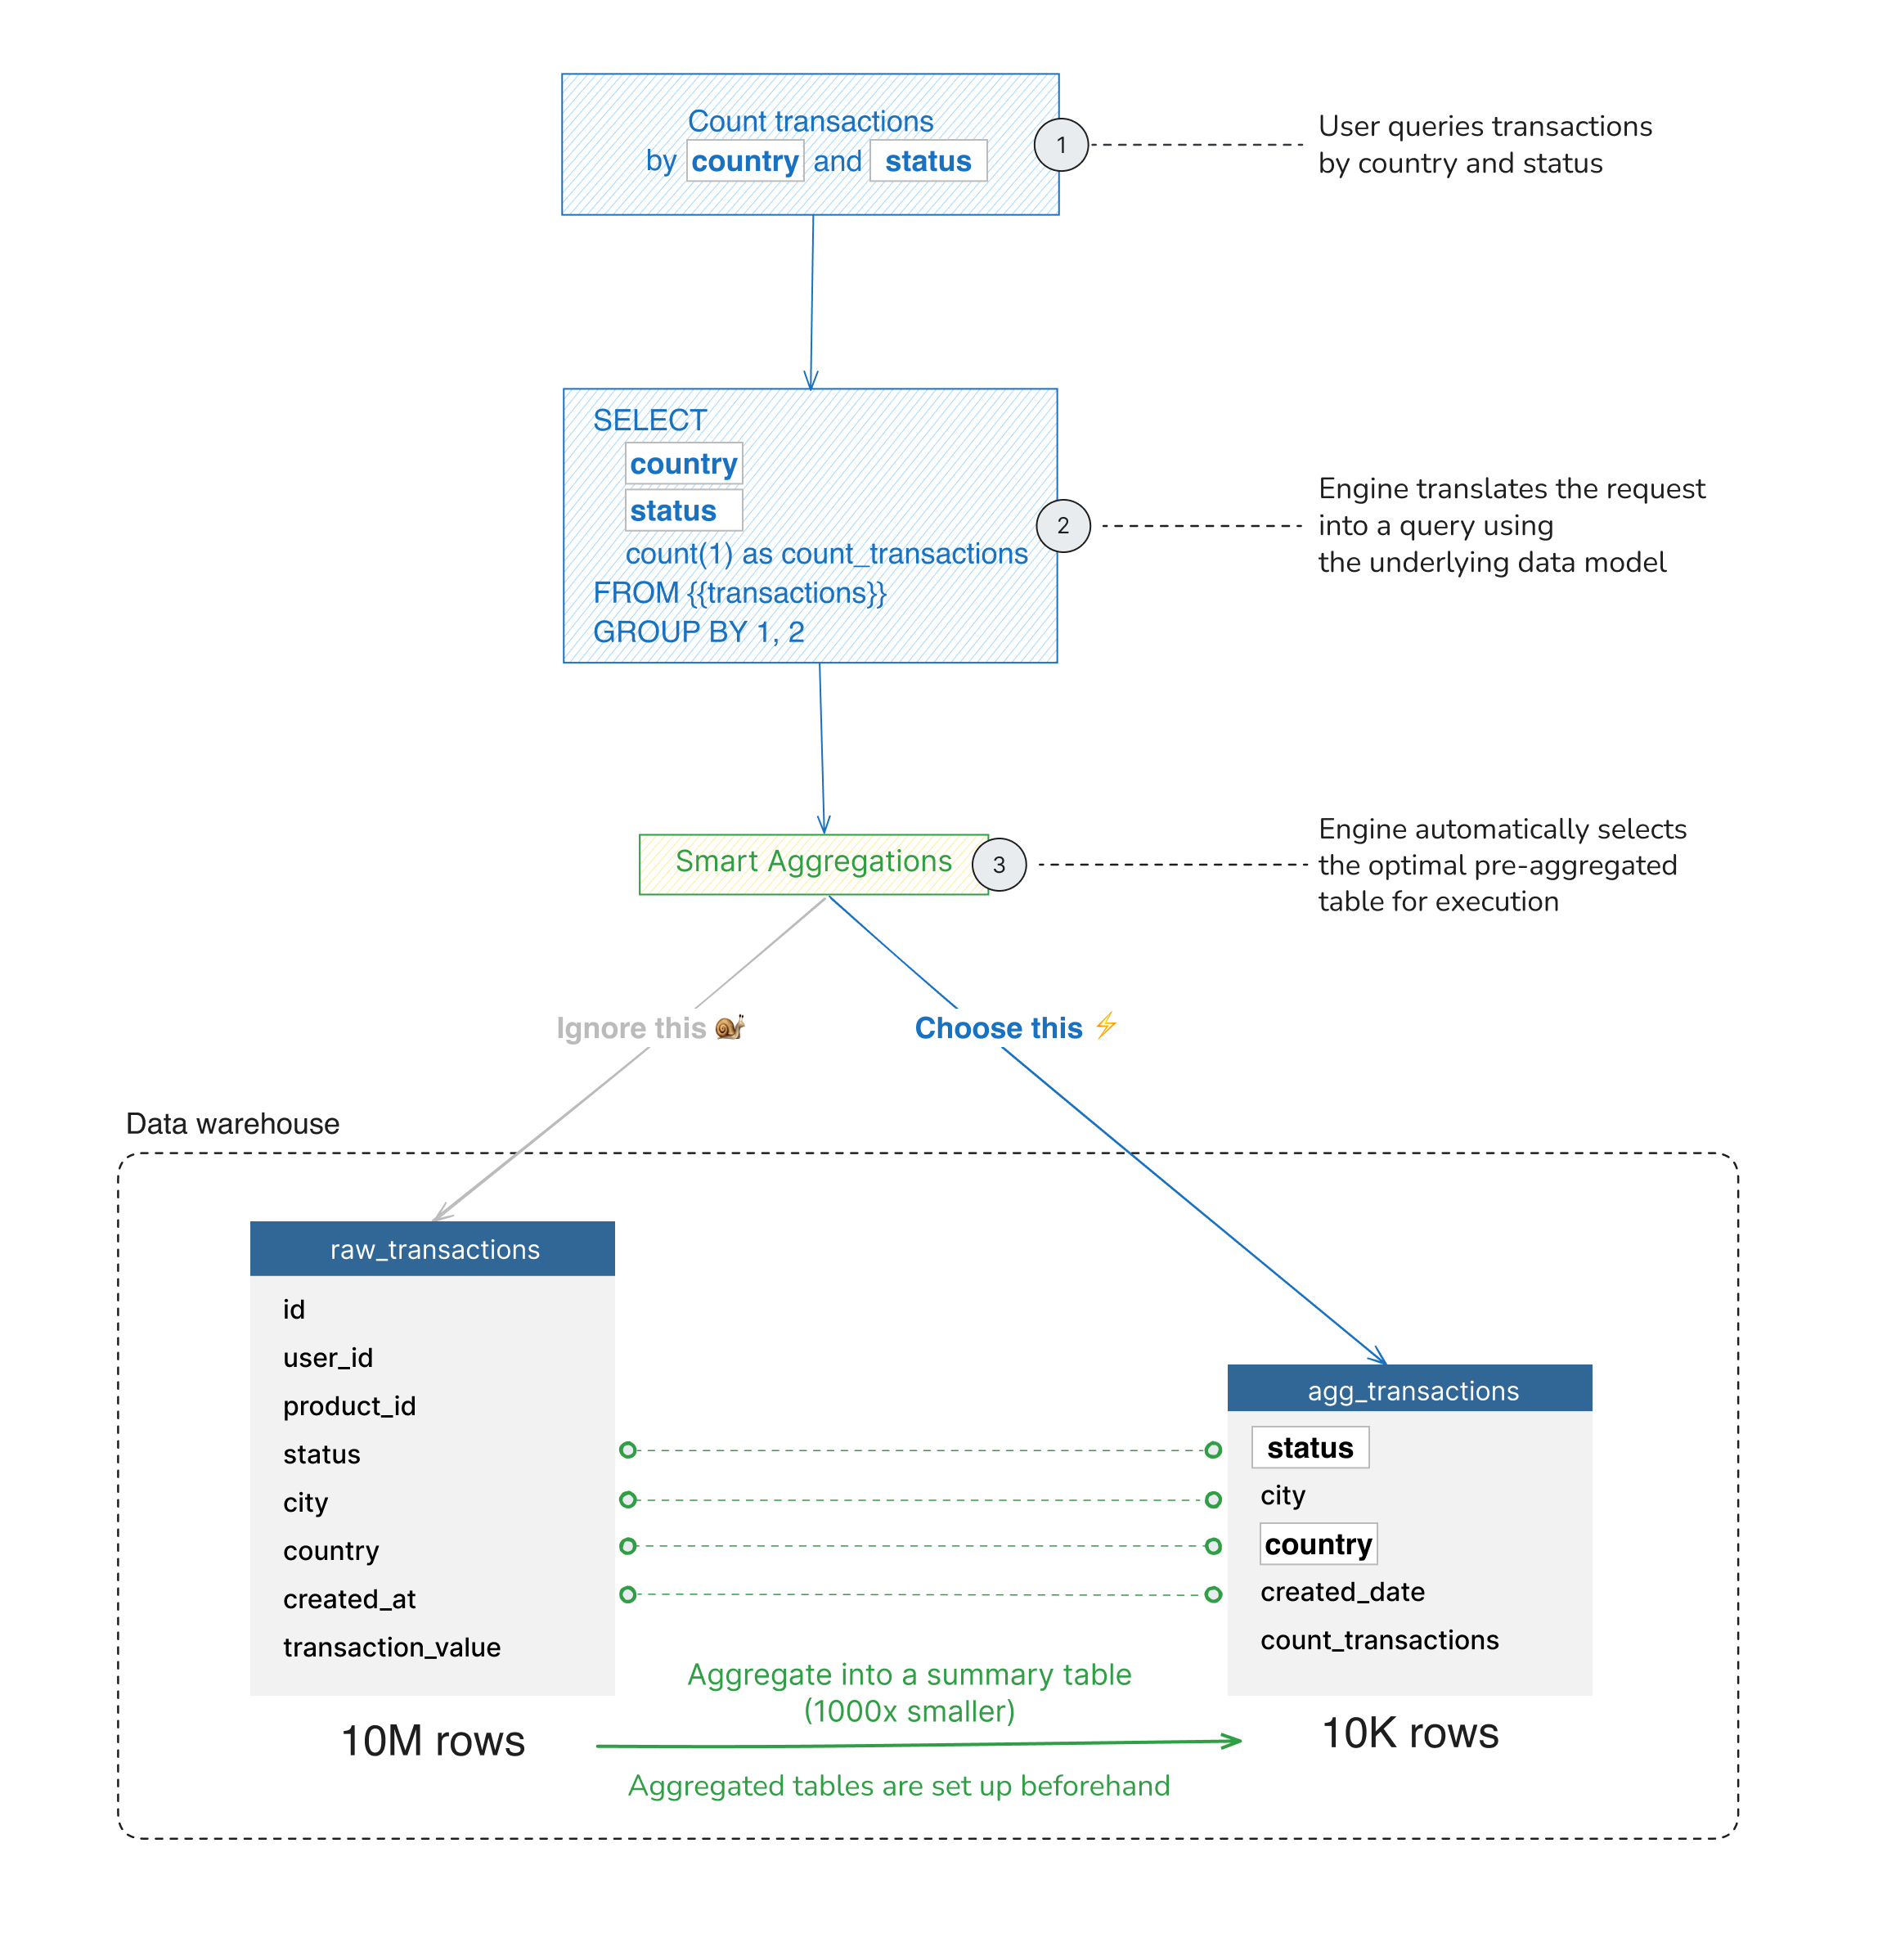
Aggregate Awareness is designed to address this problem. With Aggregate Awareness, the query engine automatically selects the appropriate table based on the query dimensions. It inspects the query sent from Holistics BI and intelligently rewrites the query to use the smaller, pre-aggregated tables instead of the raw tables. This results in fewer rows scanned, hence improving both performance & cost while maintaining query accuracy.
Glossary
Before we dive deeper into aggregate awareness, let’s build the foundation and align on the same page with some basic terms
- Pre-aggregate is the aggregation performed and prepared prior to the query time, producing a condensed version of source data with just enough information that needs to be used frequently. This helps reduce the size of the data and improves the query performance.
- Pre-aggregated table is the output of the pre-aggregate process.
- Aggregate Awareness is the capability of automatically identifying eligible pre-aggregates and substituting them into queries, making the queries use smaller pre-aggregated tables while still producing accurate results.
- Granularity is a term that describes the level of detail or complexity of a set of data.
- Coarse-grained (or low) granularity includes the data set having less detail with a grasp overview frequently used for quick analysis.
- Fine-grained (or high) granularity, in contrast, includes the data set having more detail frequently used for in-depth analysis or at the execution level.
- For example:
month
has coarser-grained (lower) granularity thanday
- (
country
,city
) has finer-grained (higher) granularity than (country
)
How It Works
You should know the concepts of Data Model and Dataset.
Aggregate Awareness can be set up in just two simple steps:
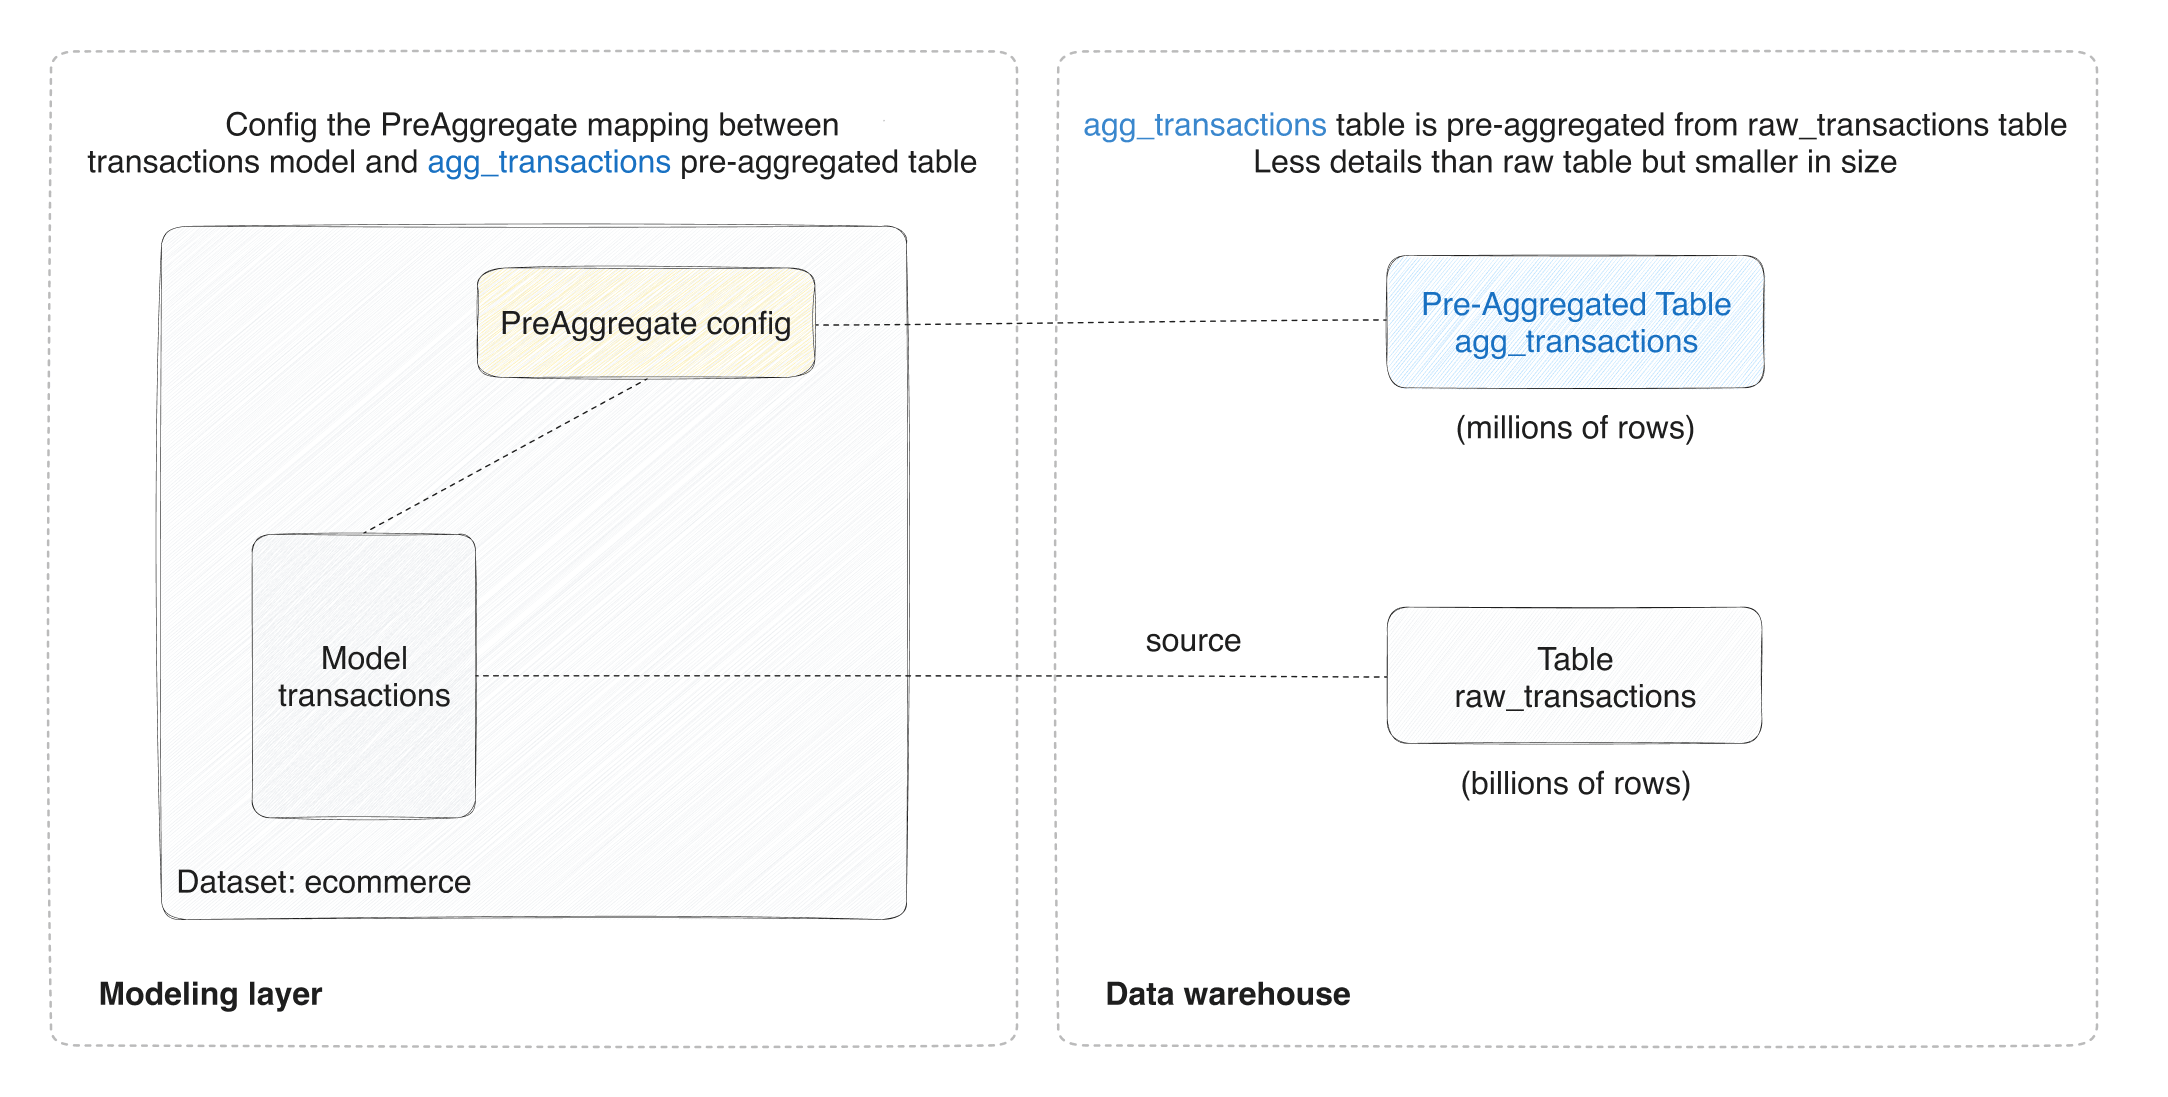
- Define the Pre-Aggregate in the dataset to map between the raw tables/models and the pre-aggregated tables.
- Create the pre-aggregated table by using either the external tools (like dbt, Airflow, etc.) or the built-in persistence option in Holistics
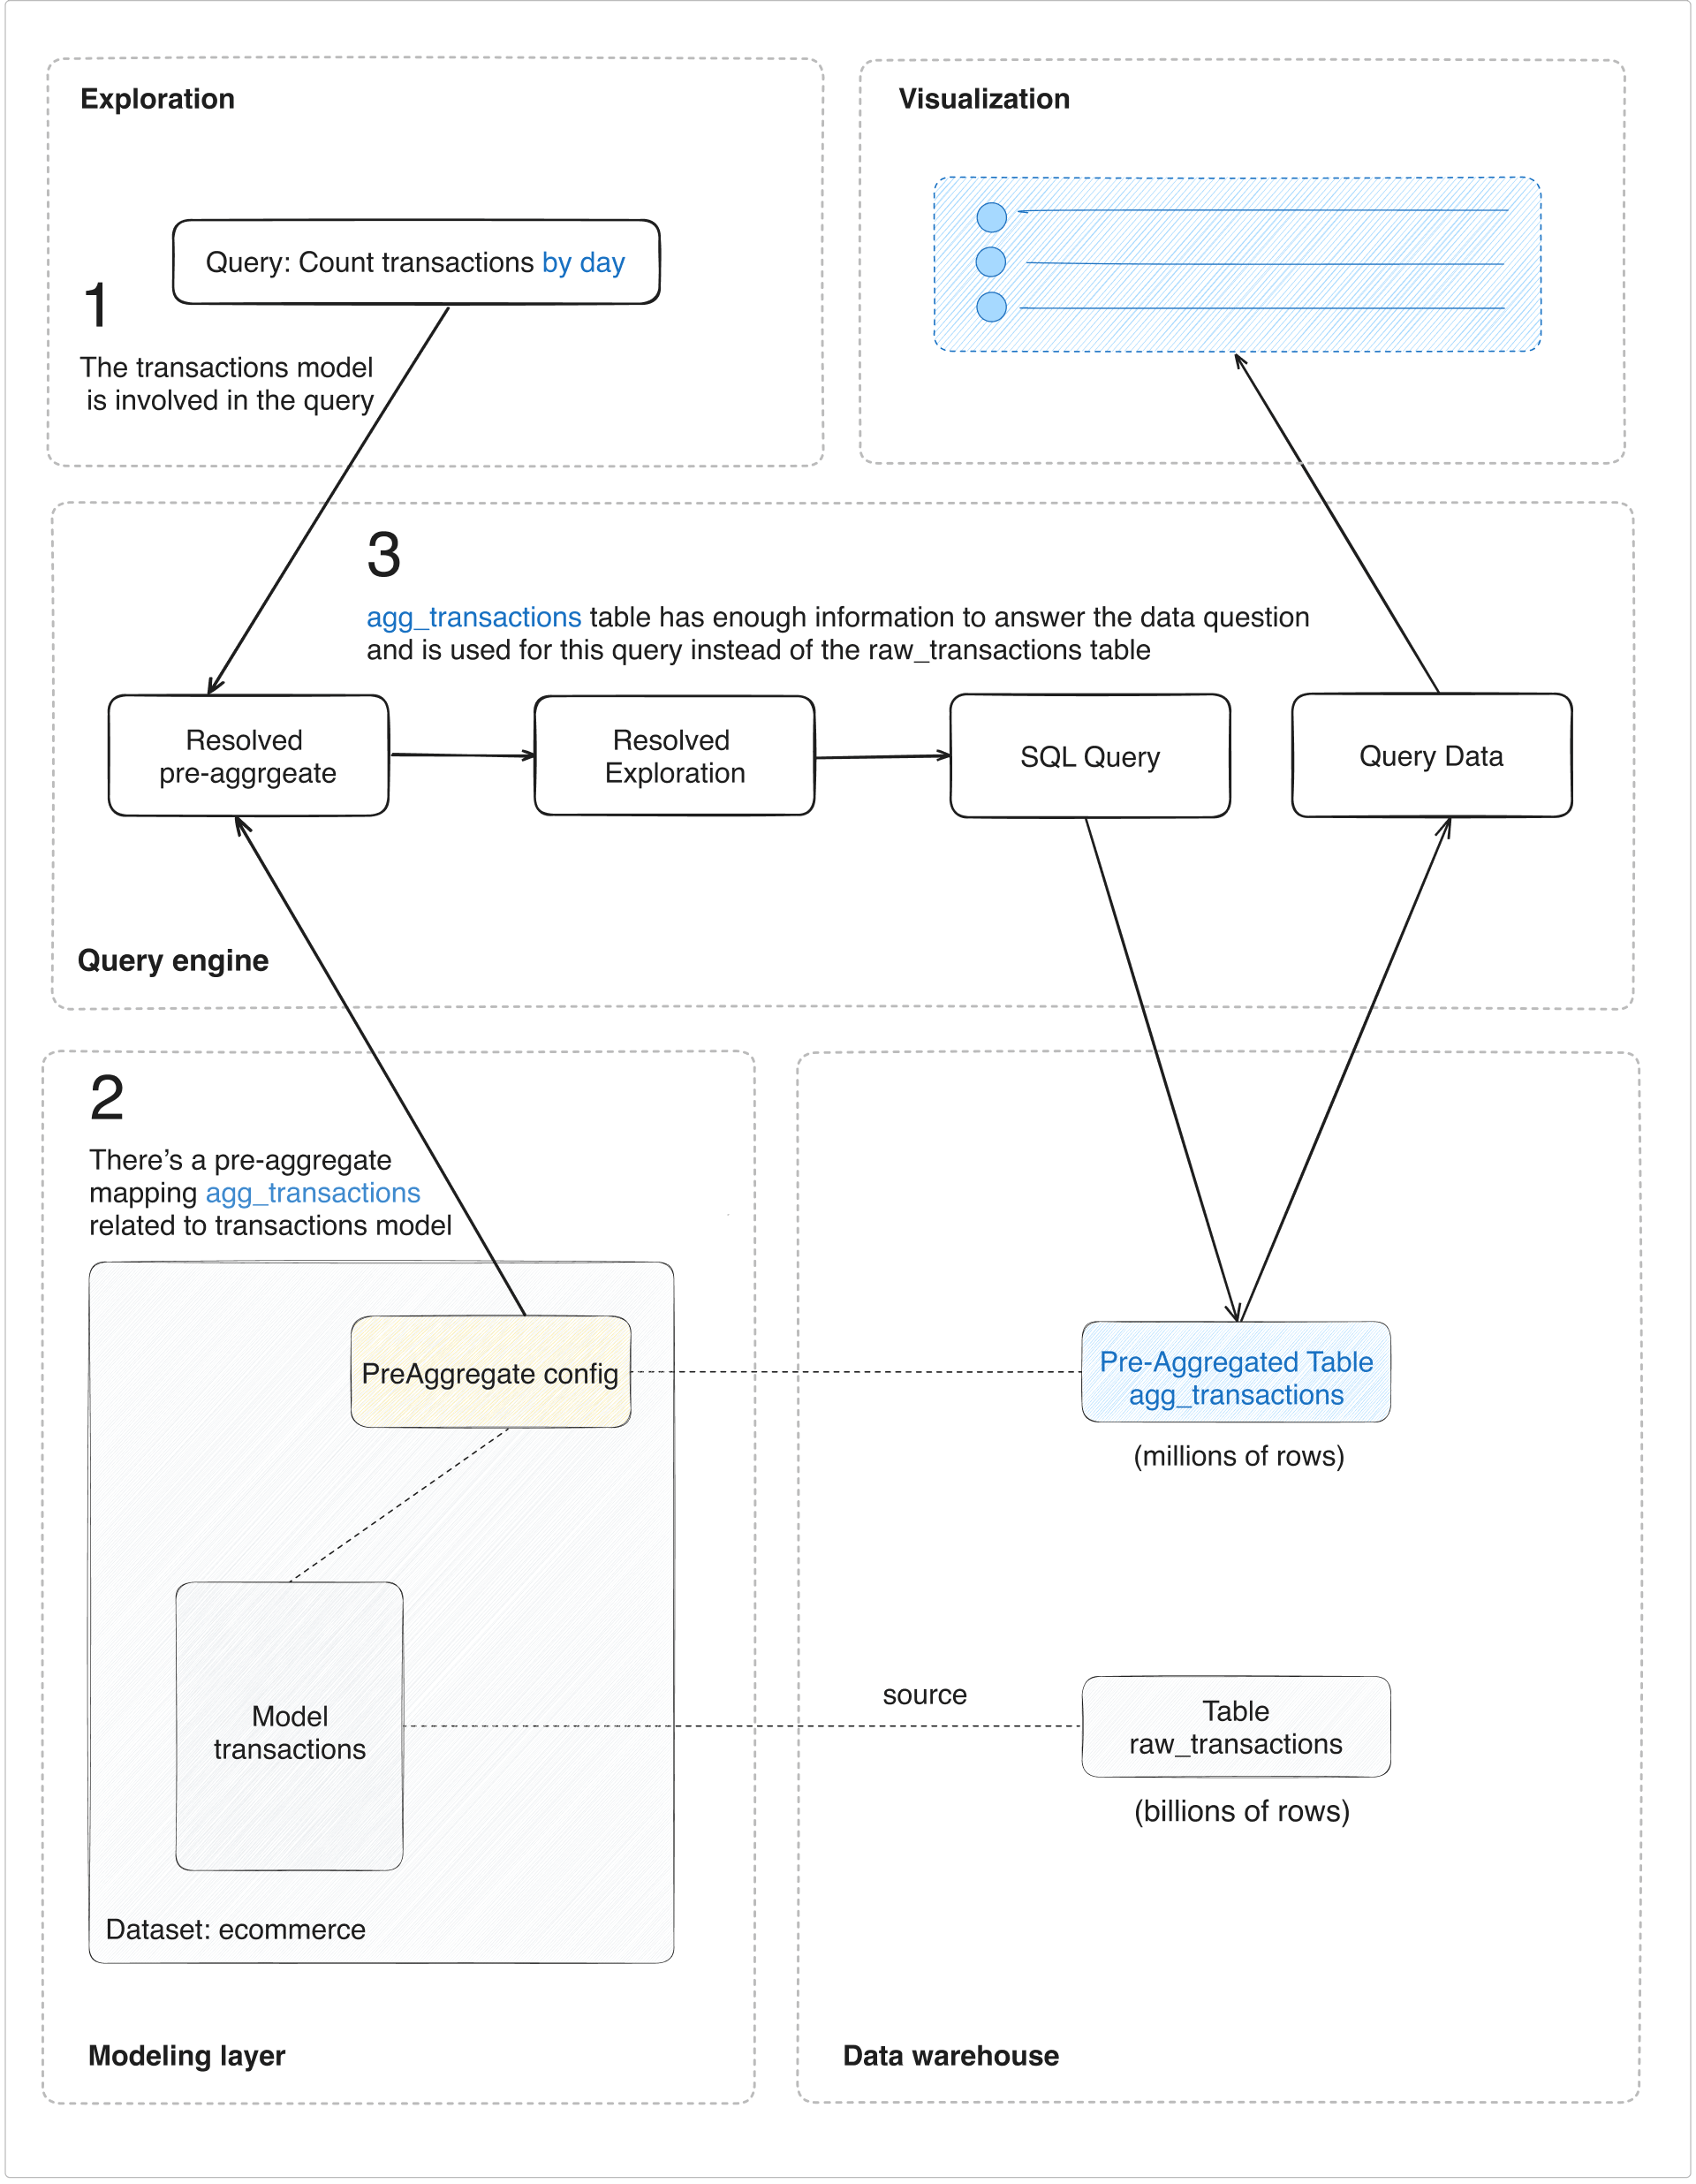
When you run a query, Holistics will automatically pick the right pre-aggregated tables with just enough information to answer the data question. Therefore, instead of processing millions or billions of raw records, the query only needs to process fewer aggregated rows, leading to faster results.
When your query is intended to use the original tables, Holistics will automatically pick the right pre-aggregated tables having enough information to answer the data question.
Therefore, instead of processing millions of millions of records, it only needs fewer than that, leading to faster results.
Quick Example
Background
Assume we’re working with the following raw_transactions
table and a model on top of it residing in an ecommerce
dataset
// ---------- Modeling Layer ----------
Dataset ecommerce {
//... other dataset settings
models: [transactions]
}
Model transactions {
dimension id
measure count_transactions { // a custom measure definition
label: 'Count Transactions'
type: 'number'
definition: @aql count(transactions.id)
}
//... other fields' definitions
table_name: 'raw_transactions'
}
// ---------- Database ----------
Table raw_transactions {
id integer [PK]
user_id integer [ref: > users.id]
product_id integer [ref: > products.id]
merchant_id integer [ref: > merchants.id]
status varchar
city varchar
country varchar
order_value double
created_at timestamp
}
Given that, we know the common queries with this table are:
- Count transactions by day, week, month
- Count transactions by status, country, city
This table is relatively big (billions of records). So, we know these analytical queries would take time.
Create Pre-aggregated Table
A good approach is to build a pre-aggregated table on the frequently used dimensions and measures to reduce the number of records
// Create pre-aggregated table agg_transactions
SELECT
created_at::date as created_at_day,
status,
country,
city,
COUNT(1) as count_transactions
FROM raw_transactions
GROUP BY 1, 2, 3, 4
// ---------- Database - Schema: `persisted` ----------
Table agg_transactions {
created_at_day date
status varchar
country varchar
city varchar
count_transactions integer
}
Map Pre-aggregated Table with Model
After that, we use pre-aggregate to define which model dimensions & measures are equivalent to the respective pre-aggregated table fields
Dataset ecommerce {
//... other dataset settings
models: [transactions]
// ----- BEGIN NEW CODE - Add pre-aggregate
pre_aggregates: {
agg_transactions: PreAggregate {
// This dimension is in the pre-aggregated table `agg_transactions`
dimension created_at_day {
// This reference is in the `transactions` model
for: ref('transactions', 'created_at'),
time_granularity: "day"
}
dimension status {
for: ref('transactions', 'status')
}
dimension country {
for: ref('transactions', 'country')
}
dimension city {
for: ref('transactions', 'city')
}
measure count_transactions {
for: ref('transactions', 'id')
aggregation_type: 'count'
}
persistence: FullPersistence {
schema: 'persisted'
}
},
}
// ----- END NEW CODE
}
The Results
When querying and exploring data, analysts and explorers only work with a single transactions
model. They shouldn’t need to have knowledge about the underlying aggregation optimizations.
With Aggregate Awareness, Holistics can automatically choose the right underlying table to query based on the dimensions of the query. The mechanism in Holistics’s Query Engine might be conceptually like the following: