Explore Data
A grasp of these concepts will help you understand this documentation better:
Explore with datasets
Exploring data from a dataset is the starting point toward building a dashboard. Using datasets, users can slice and dice your data with a familiar drag-and-drop interface.
Behind the scenes, Holistics generates queries from user's interactions, and then runs them against the database. When the result set is returned from the database, Holistics combines it with the visualization settings to render the result to your browser.
- [HTML node]
- Dimensions
- Measures
- [HTML node]
- [HTML node]
- Database
- node-10
- node-11
- node-13
- node-14
- Created at
- Delivered orders
- node-1 → node-5 (Drag and drop)
- node-5 → node-6
- node-8 → node-6 (Return data)
- node-5 → node-10 (Generate AQL)
- node-10 → node-11 (Generate SQL)
- node-11 → node-8 (Query)
In the following sections, we will walk through some basic concepts to get started with data exploration.
How it works
You select data from the Dataset fields Panel and use the Visualization settings Panel to configure your final visualization.
Dataset fields Panel
When opening a dataset, user is presented with a list of fields:
- Dimensions are non-aggregated data fields displayed in black. Dimensions can be of any data type.
- Measures are aggregated data fields (counting, summing, averaging, etc.). Measures are displayed in blue along with a sigma icon.
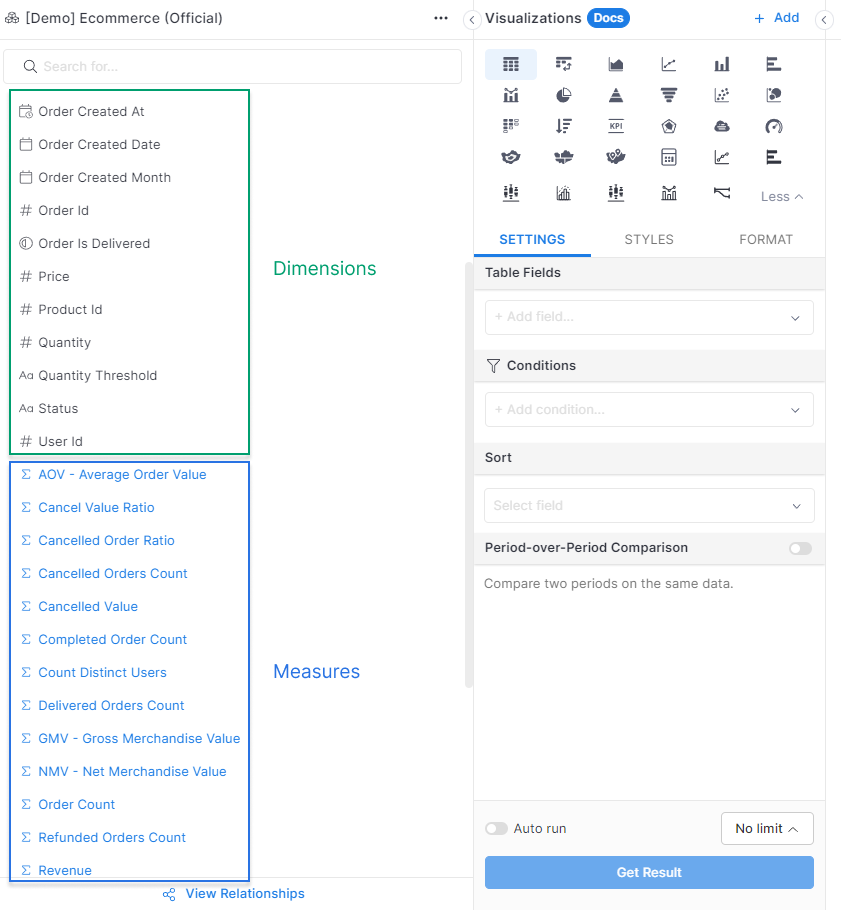
Visualization settings Panel
Chart Types and Styles
Choose from a wide range of chart types to best represent your data, including tables, line charts, bar charts, pie charts, and more specialized visualizations.
See the Visualizations section for detailed documentation on each chart type.
Data Fields
Configure which dataset fields are used in the visualization. The required fields change depending on the selected visualization type. For example, a column chart may need X and Y axes plus an optional Breakdown, while a pie chart uses Values and Labels, and a pivot table requires Rows, Columns, and Values. The panel will guide you on which slots need to be filled for the current visualization.
Format Data
Control how your data values are displayed. Learn more about Data Formatting.
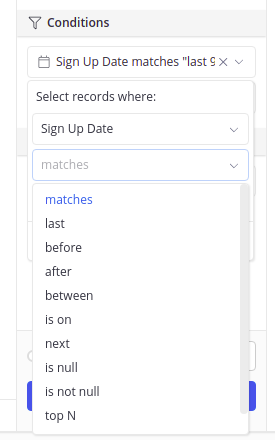
Filtering Data
To filter your data while exploring, drag a field into the Conditions area, select a comparison operator, and specify the value to apply.
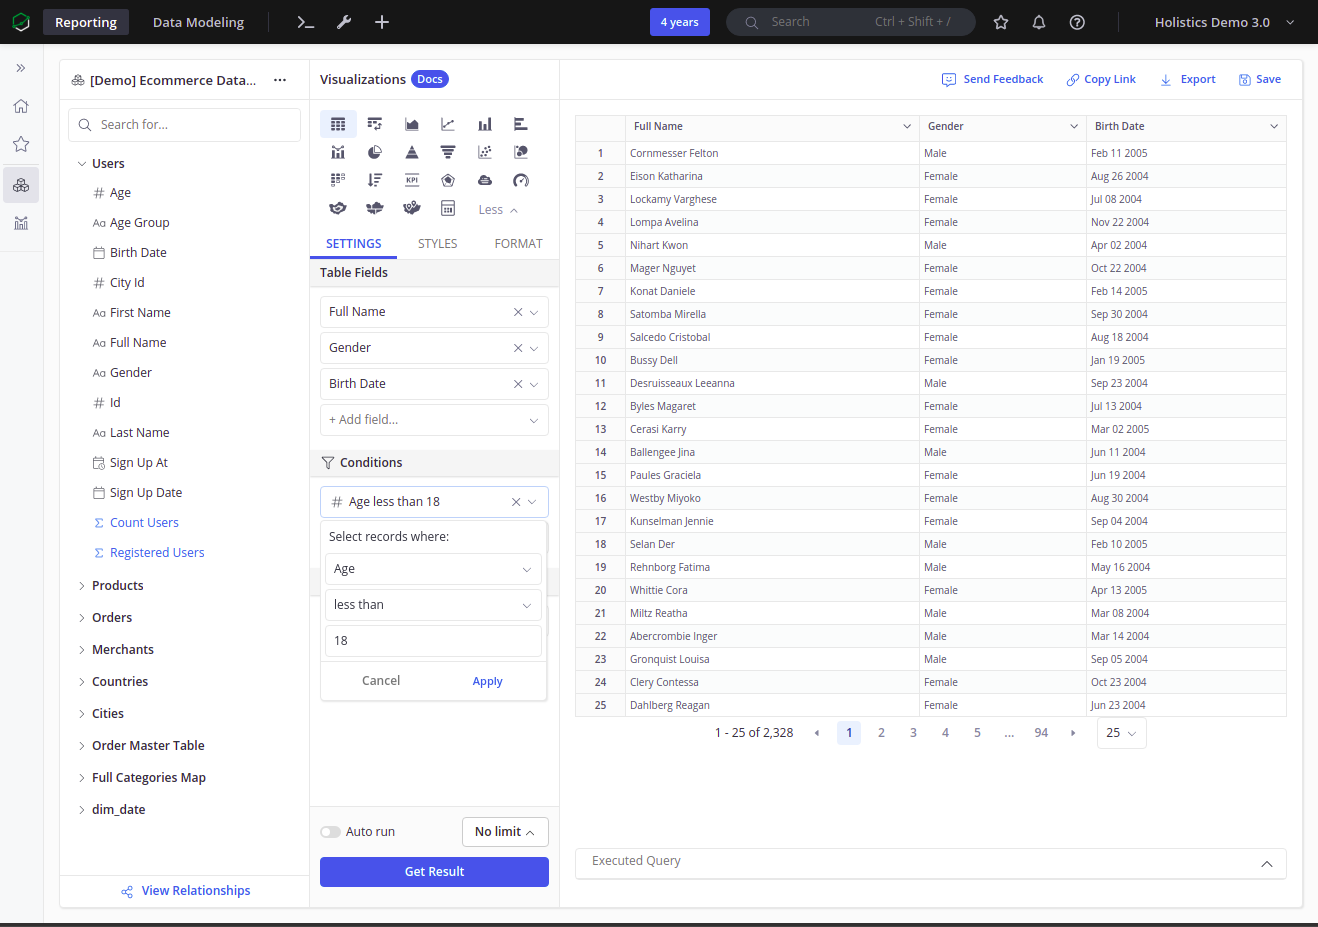
Different field types will have different sets of operators, for example, conditions using a Date field will have operators that are specific for date comparison:
For more on basic filtering operations in Holistics, visit the Filters documentation page
You can also check out the following for more advanced filter features:
Limiting data
Sometimes, to speed up the process of exploring data, you only want to see a subset of your complete results from your query. You can do this in Holistics by using our Row Limit feature:
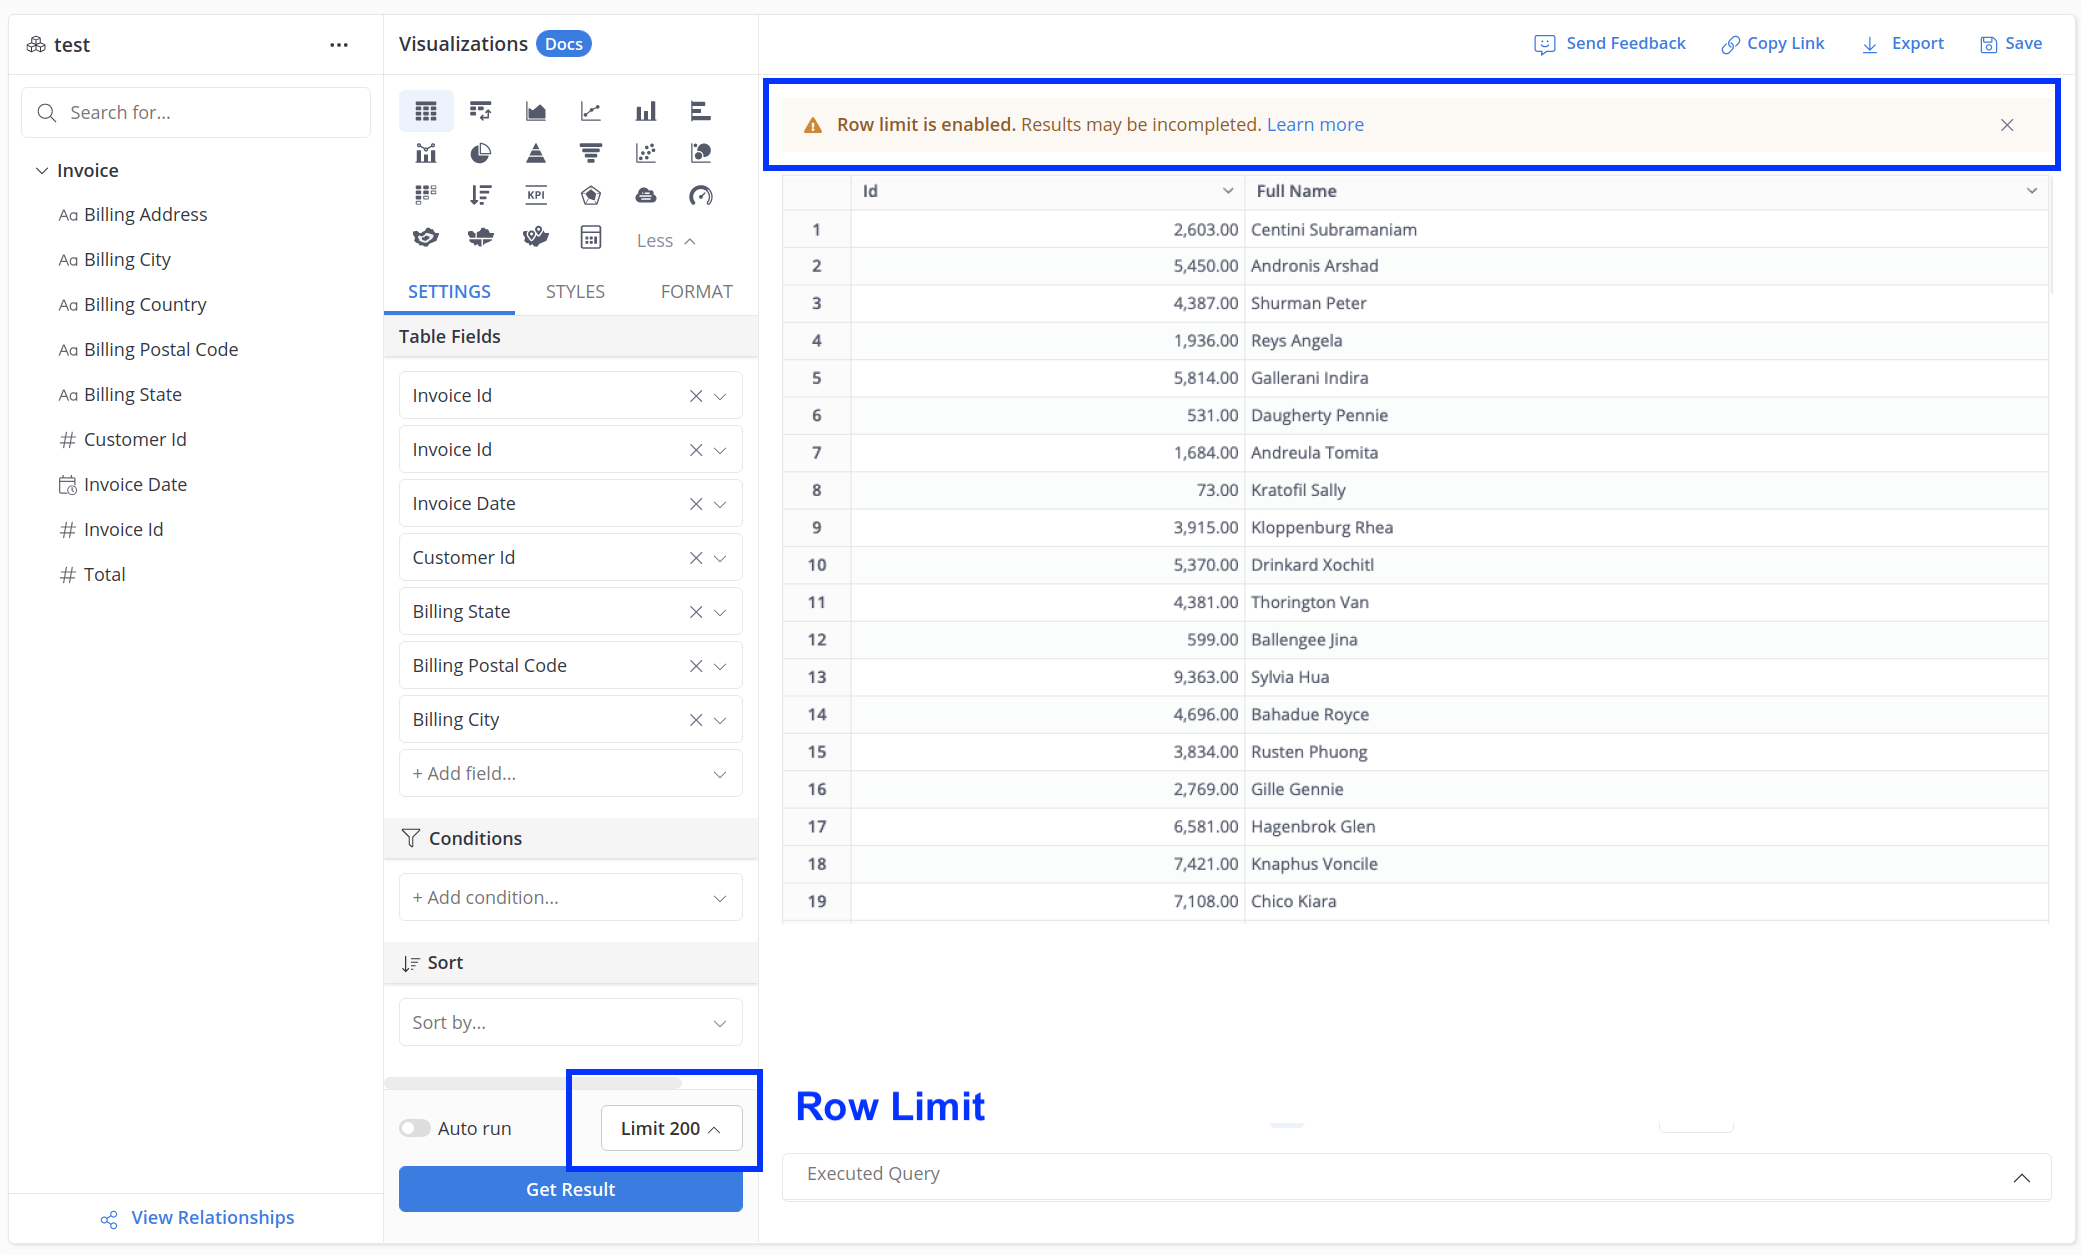
Without a set row limit, Holistics supports up to 1,000,000 rows for Data Exploration / Report Creation and 100,000 rows for Data Modeling Preview. When you apply a row limit, Holistics displays the specified number of rows, notifying you of incomplete results.
- The Row Limit is directly applied on your query.
- Our sort order is important in these situations: Holistics will first applies the limit, and then applies the sort. For more detail, please refer to the Sorting data page.
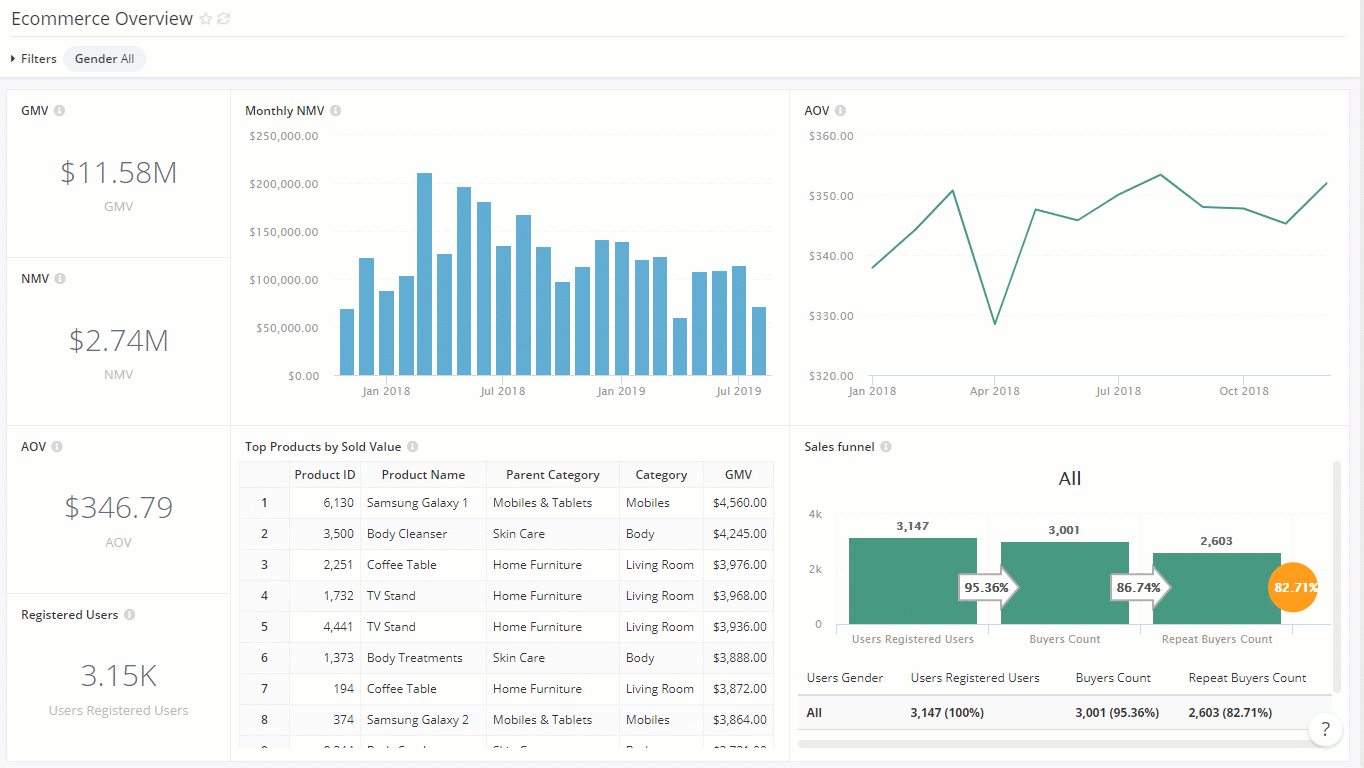
Result Panel
This panel displays the final visualization, which is generated from the query sent to the database using the configurations from the Visualization Settings Panel.
Show Items with No Data
When exploring two models with relationships, it is possible that a value in one model may not exist in another model.
For example, not all customers will have at least one order, so some users will not have associated records in the orders table. By default, Holistics will not display these records:
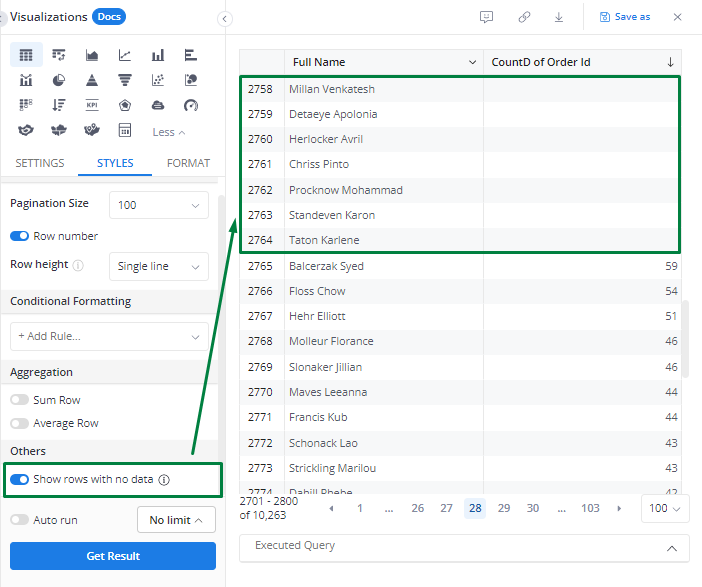
To include items with no data, you can toggle on the option Show rows with no data under STYLE > Others in our Visualization Settings. Please refer to the video below:
You might also want to check out how to show rows with no data when applying filter.
Explore with SQL
For adhoc SQL-based data exploration, you can use SQL editor, see Using SQL for Data Exploration.