Ask AI in Natural Language
Where to find Ask AI
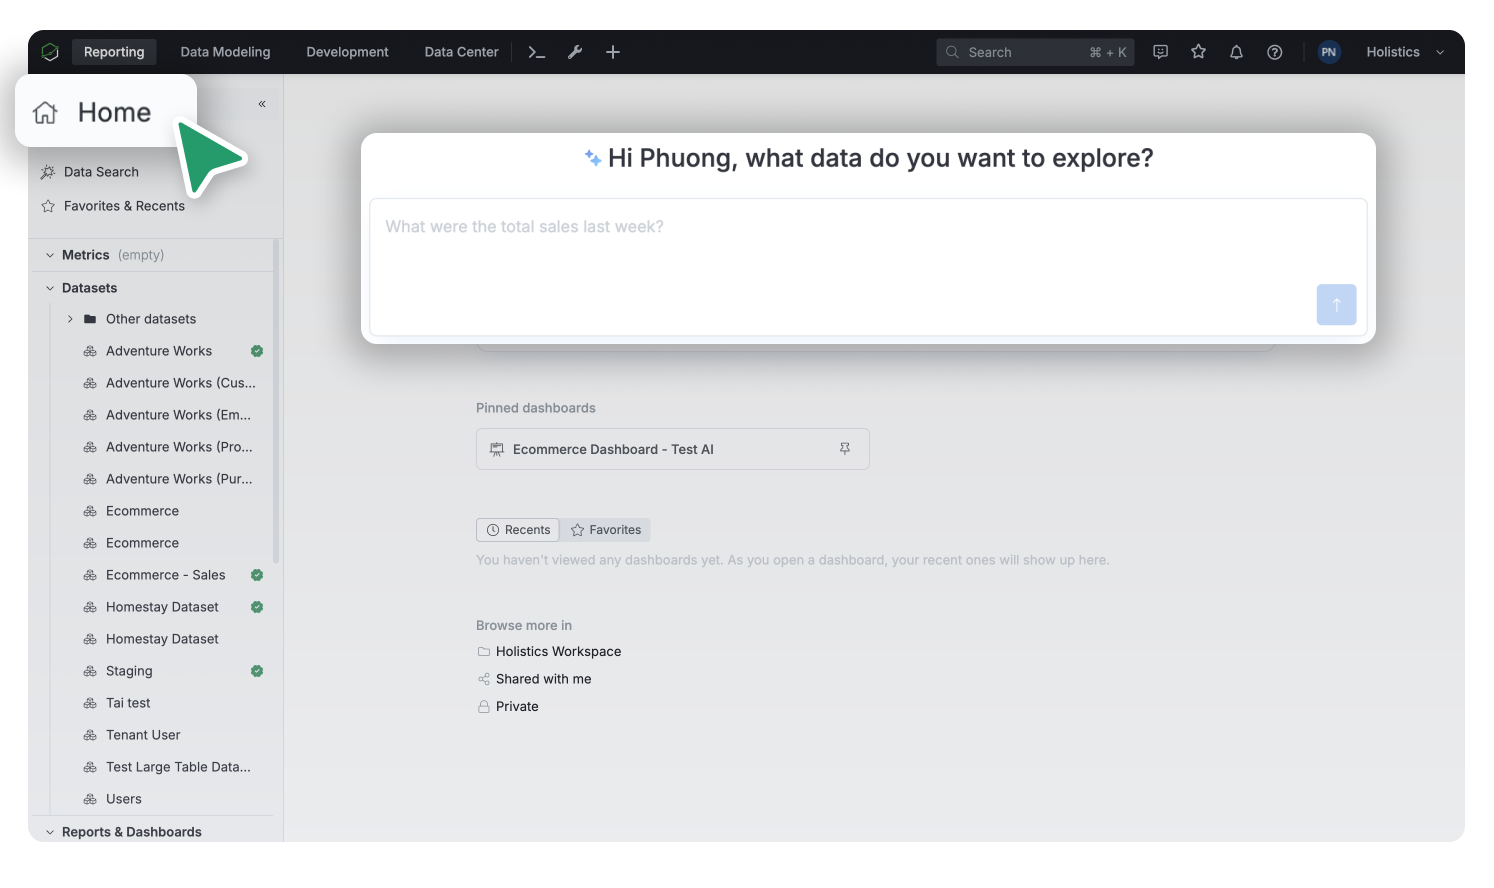
Reporting home page
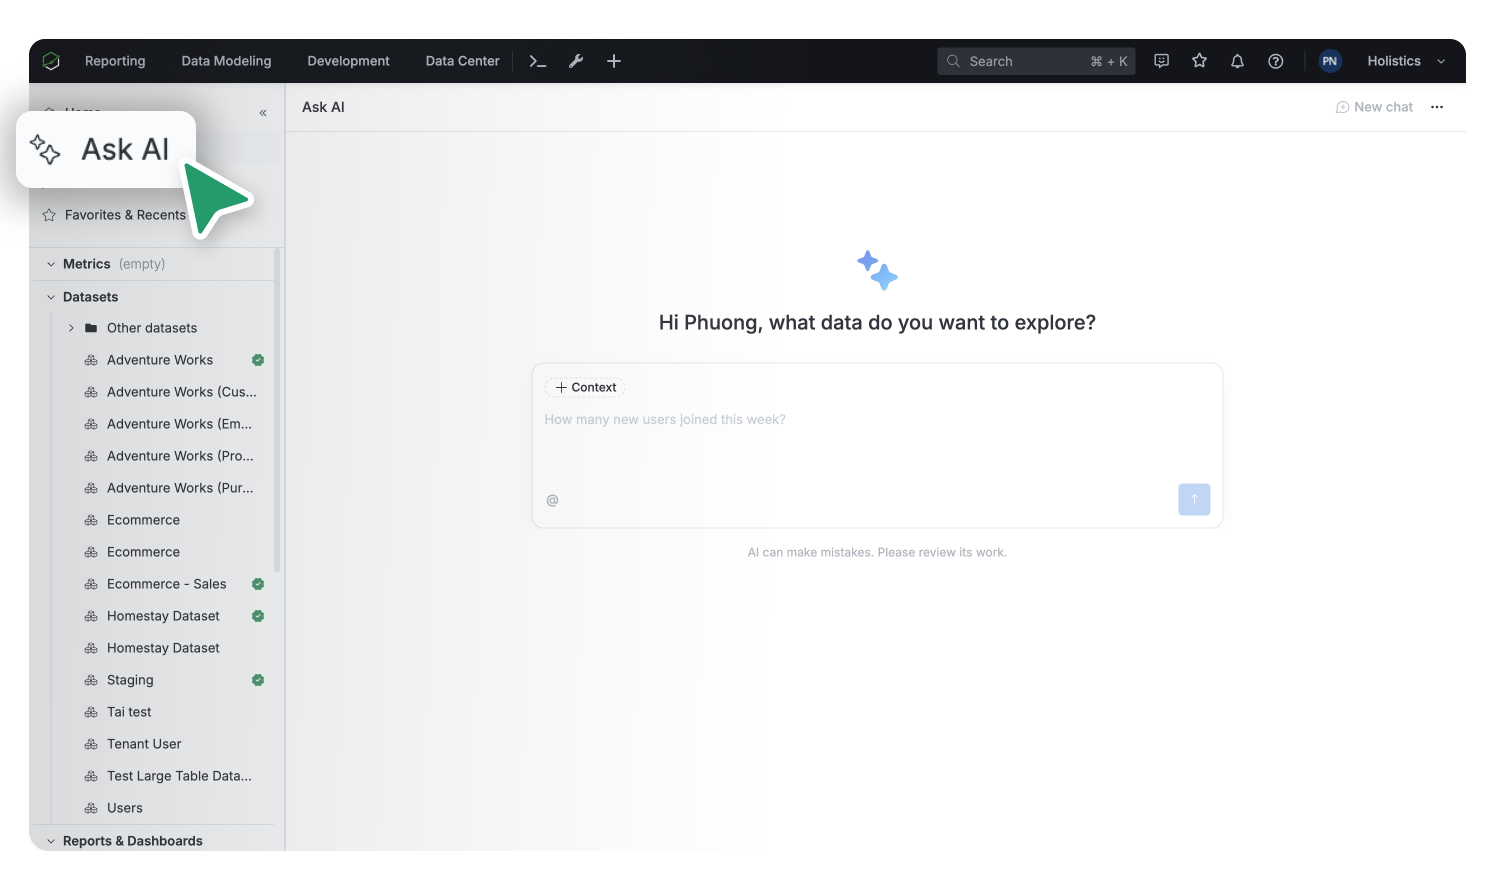
Reporting left navigation bar
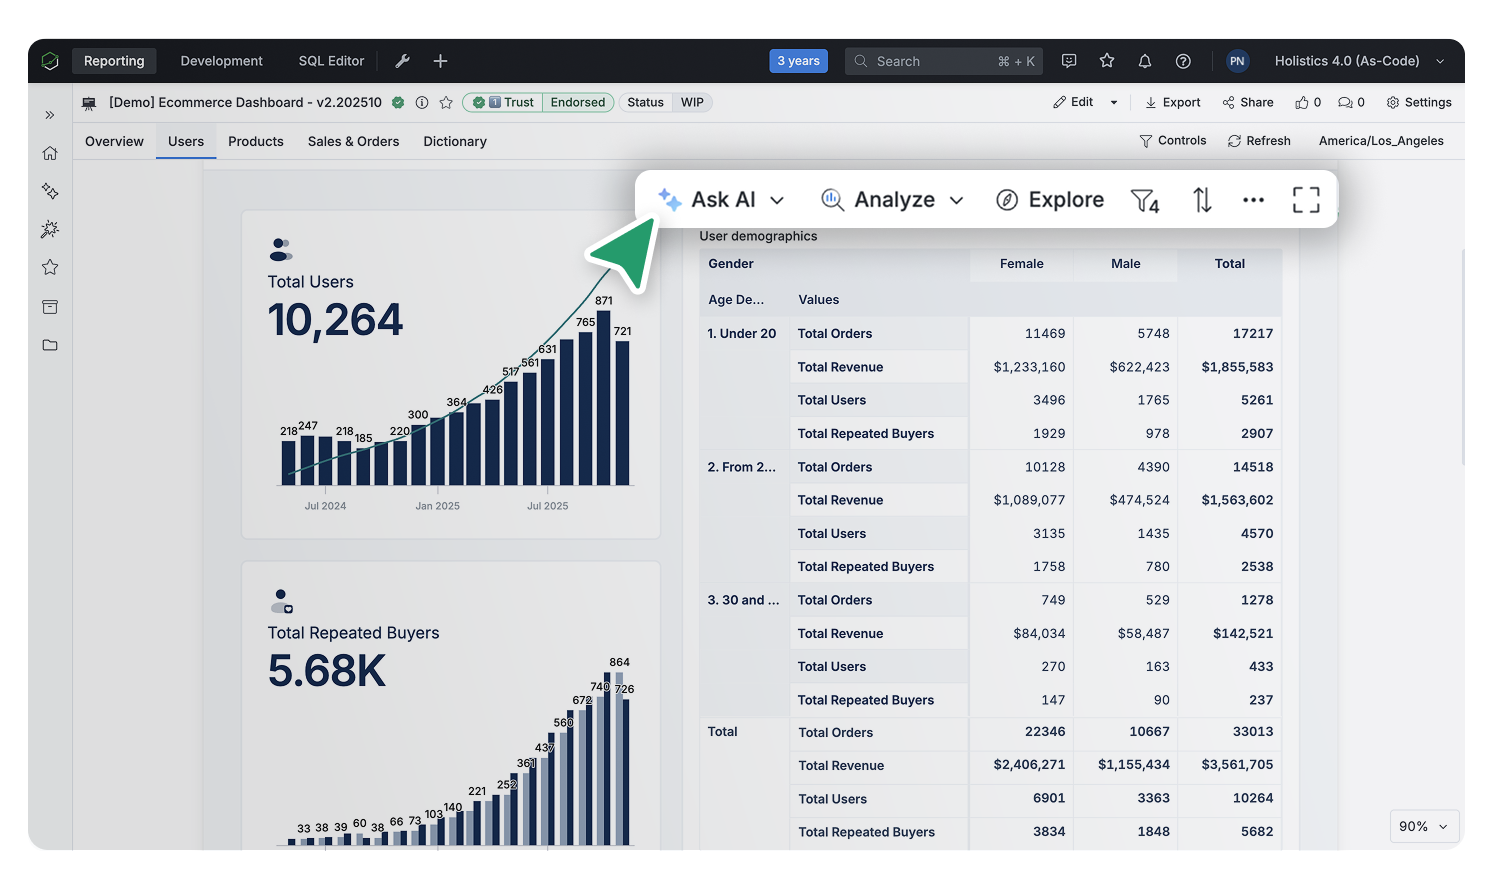
Dashboard widgets
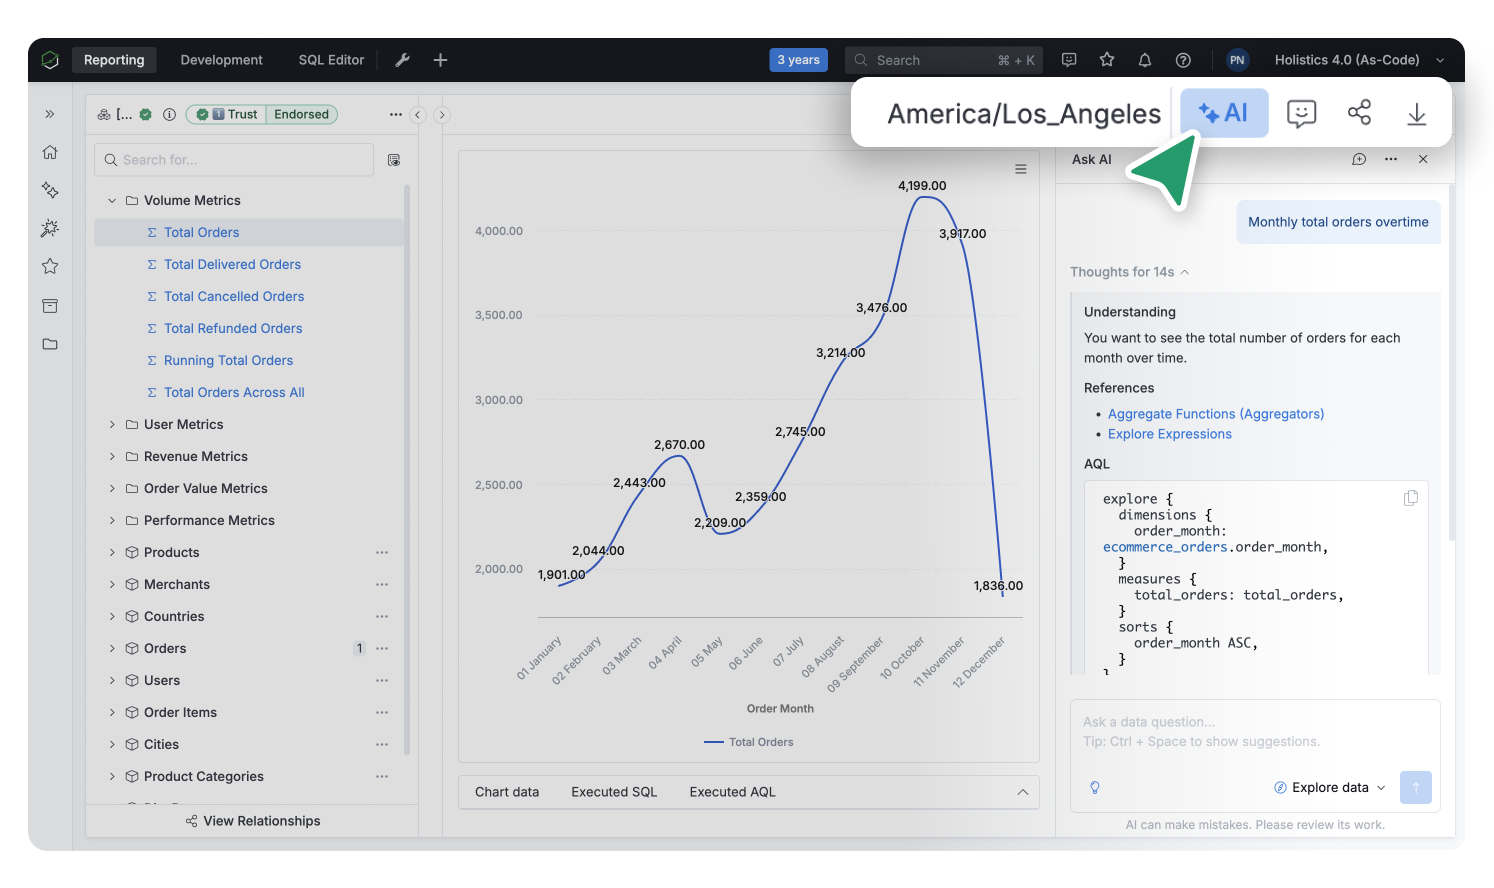
Dataset exploration
Ask your questions
Ask questions in natural language to explore metrics, run complex analyses, or get step‑by‑step instructions. Our Agentic AI automatically determines your intent and selects the appropriate knowledge source to deliver the right answers.
Inspect how results are formed
Inspect how Ask AI interprets your question, the analysis it performs, and the underlying formulas for each metric and dimension.
Go deeper with guided analysis
Great data analysts don't just stop at presenting a chart. Holistics AI serves as your data analyst companion, surfacing key insights and suggesting next steps so you can decide with confidence.
Add context for smarter AI answers
Provide context — like specific datasets — to help the AI give more accurate answers. Type @ to reference an object in a single message, or click + Context to pin it for the entire conversation.
Synthesize dashboard insights with AI
You can instantly get insights and dig deeper into any chart with Holistics AI. Hover over a chart you're curious about, click "Ask AI," then choose a suggested prompt or type your own.