How Exploration works
A grasp of these concepts will help you understand this documentation better:
There are two ways you can explore the data: the first is exploring data from a dataset, and the second is using SQL editor.
The difference between these two methods is that the Dataset Exploration UI provides an interface with drag-and-drop experience to explore data and create charts. With SQL editor, you can write your own queries to create reports.
In Holistics, exploring data from a dataset is the starting point toward building a dashboard. Using datasets prepared by data analysts, business users can slice and dice your data with a drag-and-drop interface, as well as combining different data models to answer complex questions.
Explore data from a dataset
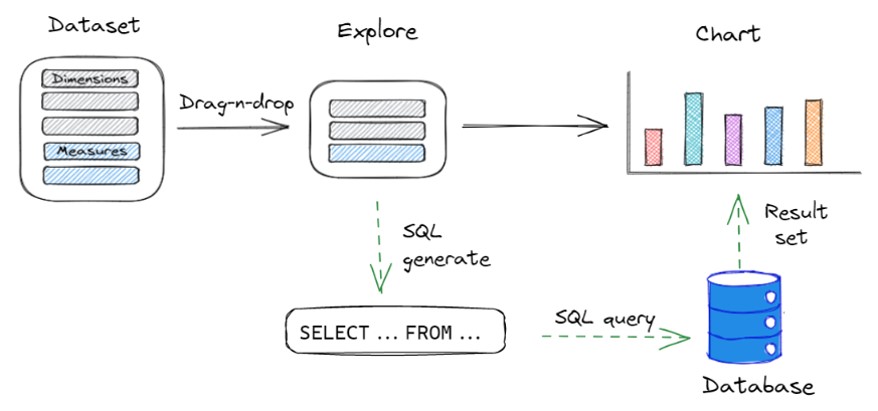
On the surface level, you interact with your data using a familiar drag-and-drop interface. Behind the scene, Holistics uses your interactions and the metadata in the modeling layer to generate queries, and then runs it against your database. When the result set is returned from the database, Holistics combines it with the visualization settings to render the result to your browser.
Please go here to learn more about what you can do with Holistics Dataset Exploration tool.
Explore using SQL Editor
Beside the Dataset, Holistics also has the SQL Editor as another way to explore your data.
In general, the dataset exploration UI is great for the less technical-inclined members. If you are well-versed in SQL, probably you would love to write your own queries in our SQL Editor.