Visualizing & Formatting Data
Visualizing data
Sometimes the numbers do not say it all, but a picture may worth a thousand words. Holistics provides you some of the commonly used chart types to visualize your data.

In each chart type, there will be further options to customize how you want to present your data. To learn more about charts in Holistics, please refer to the Visualizations documentation page.
Formatting data
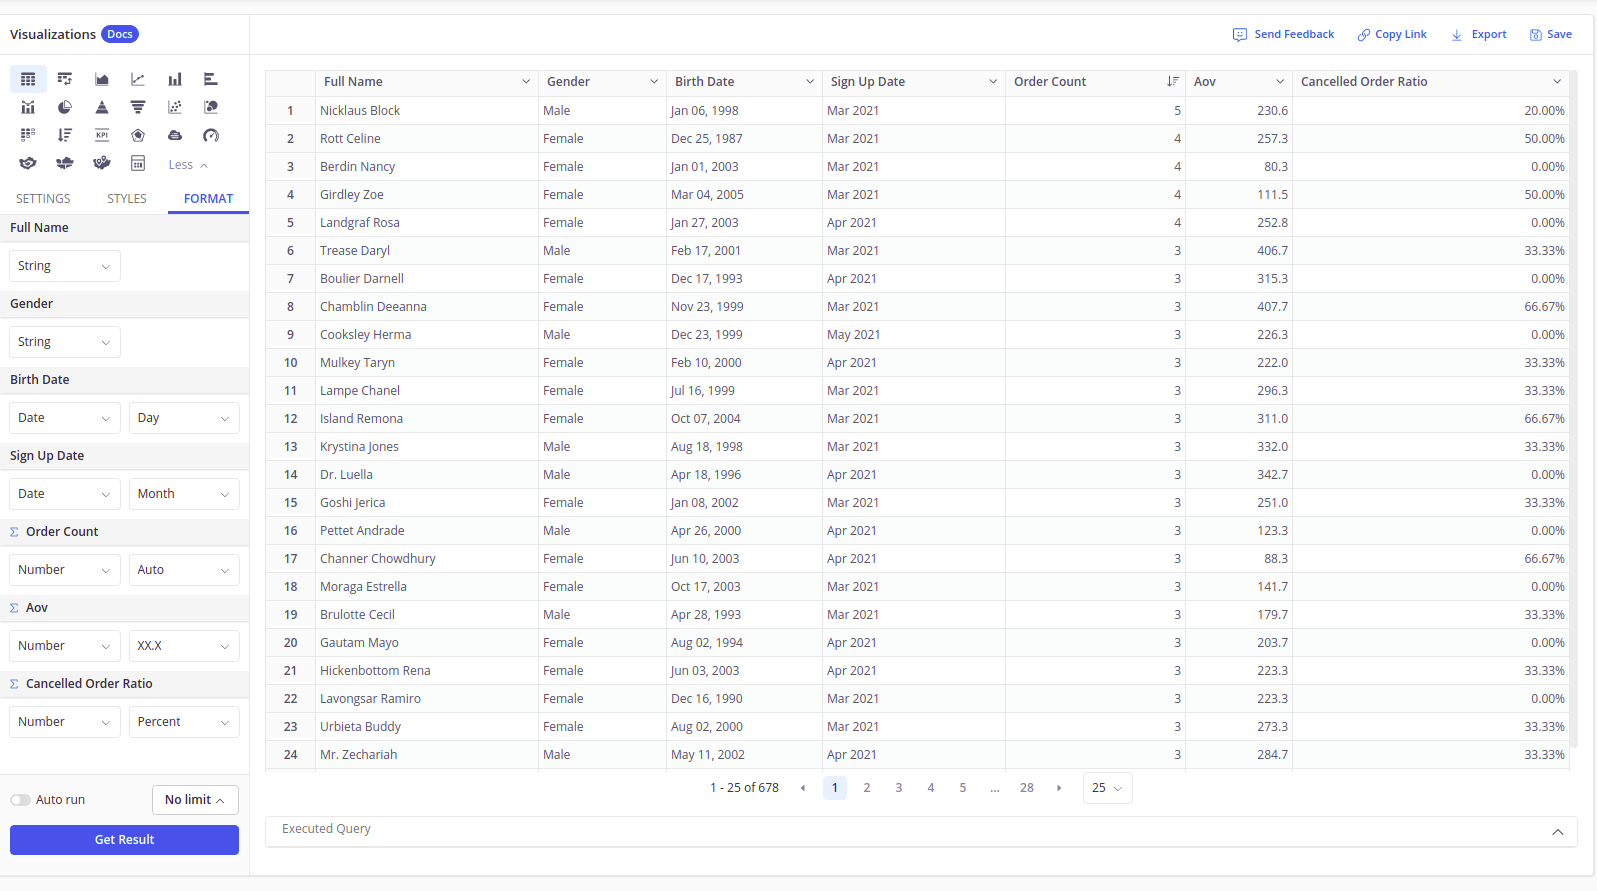
The Format tab in the Visualization panel is where you further customize how you want to display data. For example, you can choose to display decimal numbers with one or two decimal points, or even display a date field as a string.
For more details, please refer to the Formatting Data page.