Window Functions Overview
AQL Window Functions provide ways to do secondary calculations like navigating (previous, next), ranking, or aggregating (sum, avg, etc.) across a subset of rows of a table. These are analogous to SQL window functions.
Overview
Definition
Window functions are a class of functions that allow you to perform calculations across a set of table rows related to the current row without changing the number of rows returned by the query, as opposed to aggregate functions, which reduce the number of rows returned by the query.
Syntax
Most Window Functions in AQL have the following parameters:
partition(aliasreset) -> The column used to divide the table rows into multiple groups (partitions). You can use'rows','columns','x_axis', or'legend'to partition by visualization axes.order-> The column used to order the rows within each partition. You can use'rows','columns','x_axis', or'legend'to order by visualization axes.frame-> The window frame range, specifying the subset of rows related to the current row within the partition for calculations.
Each parameter corresponds to one of the three basic concepts of window functions: partitioning, ordering, and frame. These concepts will be explained in detail in the following sections.
For now, here are some examples of window functions in AQL:
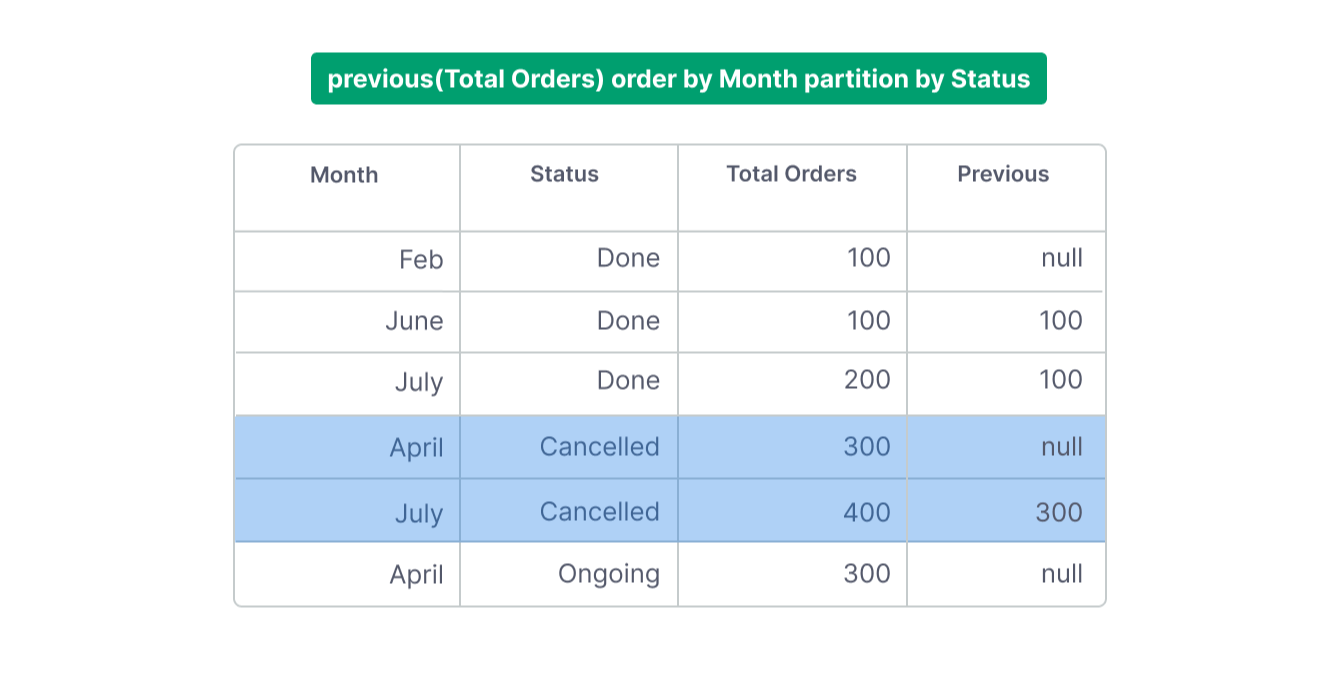
- The previous row's total orders, ordered by the month of the order creation date:
previous(orders.total_orders, order: orders.created_at | month())
- The rank of the current row ordered by the total orders and partitioned by the order status:
rank(order: orders.total_orders, partition: orders.status)
- The average of the count of orders, partitioned by
orders.status, ordered byorders.created_at, and calculated in the frame containing the current row and the two rows before it:
window_avg(count(orders.id), -2..0, order: orders.created_at, partition: orders.status)
- Calculating running totals across visualization axes:
// Running sum across rows
window_sum(orders.total_revenue, order: 'rows')

// Running sum across columns
window_sum(orders.total_revenue, order: 'columns')

// Using axis aliases for clarity
window_sum(orders.total_revenue, order: 'x_axis')    // same as 'rows'
window_sum(orders.total_revenue, order: 'legend')    // same as 'columns'

// Partition by one axis, order by another
window_sum(orders.total_revenue, order: 'rows', partition: 'columns')

// Override visualization sort order
window_sum(orders.total_revenue, order: 'rows' | desc())
Types of Window Functions
Navigation Functions
Navigation functions allow you to access values from other rows within the same partition. The available navigation functions in AQL are:
- previous - Accesses the value from the previous row
- next - Accesses the value from the next row
- first_value - Returns the value from the first row of the window frame
- last_value - Returns the value from the last row of the window frame
- nth_value - Returns the value from the Nth row of the window frame
Ranking Functions
Ranking functions assign a rank to each row based on the value of a specified column. The rank can be calculated in ascending or descending order. The available ranking functions in AQL are:
- rank - Calculates the (skip) rank of a value
- dense_rank - Calculates the dense rank of a value
- ntile - Divides rows into ranked groups
- percent_rank - Calculates the relative percentile rank of a value
Aggregate Functions
Currently, Window Aggregate Functions only accept aggregate metrics as input. We plan to support non-aggregate input in the future.
Aggregate functions calculate aggregate values across a subset of rows within a partition. These functions are similar to the aggregate functions in SQL but operate on a subset of rows within a partition. The aggregate functions available in AQL are:
- window_avg
- window_sum
- window_min
- window_max
- window_count
- window_stdev
- window_stdevp
- window_var
- window_varp
Basic Concepts
Partitioning
Partitioning is the process of dividing the rows of a table into groups, each called a partition. If no partition is specified, the entire table is treated as a single partition. Partitioning is achieved by grouping rows that share the same value in the partitioning column.
The purpose of partitioning is to limit the scope of the window calculation so that each row within a partition only "sees" the rows within the same partition. Consider the following example:
explore {
  dimensions {
    orders.created_at | month(),
    orders.status,
  }

  measures {
    total_orders: count(orders.id),
    previous: previous(
      count(orders.id),
      order: orders.created_at | month(),
      partition: orders.status,
    )
  }
}
In this example, for the line of Cancelled Orders in April, even though there are earlier months (e.g., February) with different statuses, they are not included because they belong to a different partition.
Ordering
Ordering in window functions refers to the process of sorting rows within each partition. It's important to note that window ordering is distinct from the order of the final result set; window ordering does not influence the final arrangement of the results.
We can conceptualize it using this simplified mental model: the original table is duplicated and then sorted within each partition. Each row in the original table uses this internally sorted version to perform its calculations.
For instance, even if the rows in the table are not sorted by any specific criteria, the calculation of a previous row's total orders still accurately references the corresponding row in the sorted table.
Axis-Aware Ordering
When working with visualizations, you can use axes as ordering criteria:
'rows'or'x_axis': Orders by the dimensions mapped to rows/x-axis'columns'or'legend': Orders by the dimensions mapped to columns/legend
These axis references automatically adapt to your visualization structure and respect the sort order defined in your explore. You can also override the sort direction:
// Use the row sort order from the visualization
window_sum(revenue, order: 'rows')

// Override to sort rows in descending order
window_sum(revenue, order: 'rows' | desc())

// Override to sort rows in ascending order (useful when explore sorts desc)
window_sum(revenue, order: 'rows' | asc())
Note: If an axis is not available in certain chart types, it will be ignored. For example, in a simple bar chart, the 'columns' axis may not be present.
Frame
Frames in window functions refer to the range of rows within a partition that are considered for the window calculation. Think about the frame as a "window frame" that moves along the sorted partition relative to the current row.
In AQL, the frame is specified using a range literal, which consists of two integers separated by two dots (..). These integers represent the number of rows before and after the current row, respectively. For example, -2..0 indicates the two rows before the current row and the current row itself.
Unbounded frames are also supported by omitting one of the integers. For instance:
0..means from the current row to the last row in the partition...0means from the first row in the partition to the current row...means all rows in the partition.
Frames are available only to Aggregate Window Functions, such as window_avg, window_sum, window_min, and window_max, since they aren't useful for other types of window functions.
Axis-Aware Window Functions
Window functions support using visualization axes directly in the order and partition parameters. This makes it easier to write calculations that adapt to your visualization structure across different chart types.
Available Axes
'rows'or'x_axis': Refers to dimensions mapped to rows or x-axis'columns'or'legend': Refers to dimensions mapped to columns or legend/series
Examples
explore {
  dimensions {
    rows {
      _year: orders.created_at | year()
    }
    columns {
      _category: products.category
    }
  }

  measures {
    revenue: sum(order_items.quantity * products.price),

    // Running total across years (rows)
    running_by_year: window_sum(revenue, order: 'rows'),

    // Running total across categories (columns)
    running_by_category: window_sum(revenue, order: 'columns'),

    // Partition by category, order by year
    yearly_growth_by_cat: window_sum(revenue, order: 'x_axis', partition: 'legend')
  }
}
Overriding Sort Direction
You can override the visualization's sort order using asc() or desc():
// Force ascending order even if visualization sorts descending
window_sum(revenue, order: 'rows' | asc())

// Force descending order
rank(order: 'columns' | desc())
Behavior Across Chart Types
Axis references work across all visualization types:
- Pivot tables: Both row and column axes are available
- Bar/Line charts: Typically only x-axis is available; column/legend axes may be ignored
- Bar/Line charts with legend: Both axes are available.
- If an axis is not applicable to the current chart type, it will be gracefully ignored
Table
Window functions operate on a table, so they can only be used within the context of a table. Specifically, they can be utilized in the following contexts (and similar contexts):
A Select Over a Table:
orders | select(orders.created_at, previous(orders.created_at, order: orders.created_at))
A Filter Over a Table:
orders | filter(rank(order: orders.created_at) < 10)
Inside a Dimension Definition of a Model:
In this case, the table it operates on is the model's table.
Model orders {
  dimension previous_created_at {
    type: string
    sql: previous(orders.created_at, order: orders.created_at)
  }
}
Inside an Exploration:
Here, the table will be the result of the exploration before the window function is applied.
explore {
dimensions {
orders.created_at | month()
}
measures {
count(orders.id),
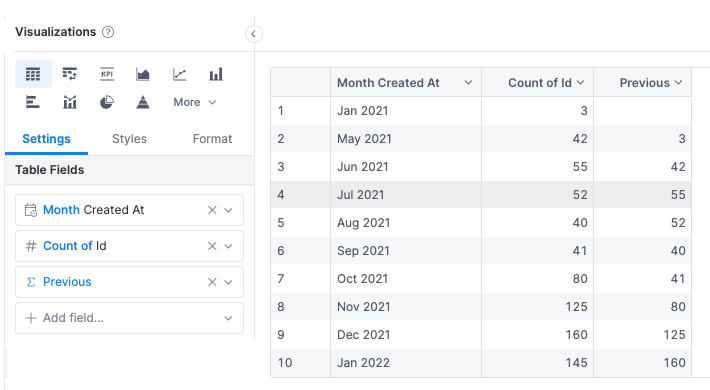
previous: previous(count(orders.id), order: orders.created_at | month())
}
}
In Holistics, this is equivalent to this UI.
Default Behavior
Default Partitioning
If no partition is specified and no ordering is specified, the entire table is treated as a single partition. This is equivalent to specifying a partition that groups all rows together.
If no partition is specified, but an ordering is specified, all other grouping dimensions in the exploration are used as the partitioning columns. For example, if you have a table with columns month, status, and total_orders, and you specify order: month, the table will automatically be partitioned by status. We choose this behavior to avoid the partial ordering issue.
If any partition is specified, the table is partitioned by the specified column(s). You should ensure that the combination of partitioning and ordering columns is unique to avoid partial ordering issues.
Default Ordering
If no ordering is specified, the rows are not sorted within each partition. Note that this can lead to non-deterministic results if you use window functions that depend on ordering, as it introduces the partial ordering issue.
Default Frame
If no ordering is specified, the default frame is .., which means all rows in the partition are considered for the window calculation.
If an ordering is specified, the default frame is ..0, which means all rows from the first row in the partition to the current row are considered for the window calculation.
Common Pitfalls
Partial Ordering
Partial ordering occurs when the rows within a partition are not uniquely ordered. This situation arises when the ordering column(s) do not uniquely identify each row within a partition. As a result, the outputs of window functions can be non-deterministic. For example, if you order by created_at but have multiple rows with the same created_at value, the results may vary each time you run the query.
We recommend ensuring that the combination of partitioning and ordering columns is unique to avoid partial ordering issues.
Ordering and Partitioning use dimensions not available in the LoD context
If you use dimensions that are not available in the Level of Detail (LoD) context for ordering or partitioning, the window function might not work as expected. AQL handles this issue in the following ways:
-
Ranking Functions: If the window function belongs to the Ranking Function category, the function will return
nullfor any row that lacks the dimension in question. For example,rank(order: orders.total_orders, partition: countries.name)will returnnullfor any row that does not havecountries.namein its context.This behavior can be observed in the Pivot's Grand Total Row. Since the Grand Total Row lacks any dimensions in the LoD context, all ranking functions will return
null.
-
Aggregate Functions: If the window function belongs to the Aggregate Function category, the function will first add the missing dimensions to the LoD context.
For example,
window_avg(count(orders.id), 0..0, order: orders.created_at | quarter())will first addorders.created_at | quarter()to the LoD context before calculating the average, in the case where the context only containsorders.created_at | year(). This behavior ensures that the window function works as expected in Subtotals and Grand Totals.Here you can observed that the Sub Total for
2021is calculated as the average of the quarters in2021, even though the LoD context for subtotals only containsorders.created_at | year(). Even the Grand Total is calculated as the average of all quarters, even though the LoD context for the Grand Total is empty.
It can be tricky to understand these metrics when used outside of the pivot table context and you cannot see the individual rows. So we recommend storing them in ad-hoc calculations rather than as reusable metrics.