Cumulative Metrics
Introduction
In business analytics, aside from typical aggregation metrics, cumulative metric is an indispensable tool to understand the performance of your business over time.
In this guide, we will try to answer the following questions about a fictional ecommerce business:
- How does the company’s cumulative revenue look like over months?
- How does the cumulative average order value of each category look like?
We will work with the familiar ecommerce dataset, and use the running_total() function to answer these questions.
Example 1: Cumulative Total Revenue over Months
Setup
In this example, the ecommerce dataset will contain only the orders, order_items, and products models.
// orders.model.aml
Model orders {
  ...
  dimension id {...}
  dimension user_id {...}
  dimension created_at {...}
  dimension order_month {
    label: 'Created At Month'
    type: 'date'
    definition: @aql date_trunc(orders.created_at, 'month') ;;
  }
}

// order_items.model.aml
Model order_items.model.aml {
  ...
  dimension order_id {...}
  dimension product_id {...}
  dimension quantity {...}
}

// products.model.aml
Model products {
  ...
  dimension id {...}
  dimension price {...}
  dimension category_id {...}
}

// e_commerce.dataset.aml
Dataset e_commerce {
  ...
  models: [orders, order_items, products]
  relationships: [
    relationship(order_items.order_id > orders.id, true),
    relationship(order_items.product_id > products.id, true)
  ]

  metric revenue {
    label: 'Revenue'
    type: 'number'
    hidden: false
    definition: @aql order_items | sum(order_items.quantity * products.price);;
  }

  metric cumulative_revenue {
    label: 'Cumulative Revenue by Month'
    type: 'number'
    definition: @aql running_total(revenue, orders.created_at_month) ;;
  }
}
High-level flow
- Create the normal aggregation metric: In the
ecommercedataset, we create a simplerevenuemetric that calculate order value by summing overorder_items.quantitymultiplied byproducts.price. - Prepare the running dimension: we will create a
created_at_monthdimension in theordersmodel. This will be used in the final running metric. - Create the cumulative metric: We use the
running_total()to run therevenuemetric along the dimension.
Implementation
1. Create the normal sum metric
In the definition file of the ecommerce dataset, we can easily create a revenue metric that combines fields from two different models (order_items and products) without the need to pre-join them:
Dataset ecommerce {
  ...

  metric revenue {
    label: 'Revenue'
    type: 'number'
    definition: @aql order_items | sum(order_items.quantity * products.price) ;;
  }
}
2. Prepare the running dimension
When we first created the orders table model, Holistics automatically scanned the table and pre-create model fields representing the physical table columns.
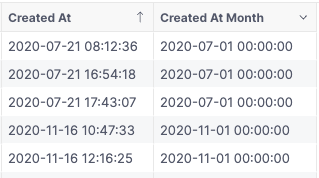
We already have created_at as the time dimension at the lowest grain (seconds), but we want a time dimension with a coarser grain (month). We can use the AQL function date_trunc() to truncate the timestamp values to month grain:
Model orders {
  type: 'table'
  label: 'Orders'

  ...

  dimension created_at {
    label: 'Created At'
    type: 'datetime'
    hidden: false
    definition: @sql {{ #SOURCE.created_at }};;
  }

	dimension created_at_month {
    label: 'Created At Month'
    type: 'datetime'
    definition: @aql date_trunc(orders.created_at, 'month') ;;
  }
}
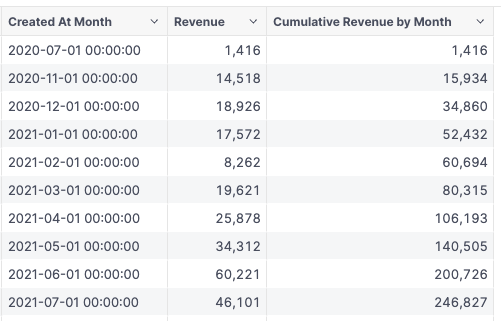
3. Create the cumulative metric
Finally, we can use the running_total() function to create a Cumulative Revenue metric that will gradually add up revenue after each month:
Dataset ecommerce {
  ...

  metric revenue {
    label: 'Revenue'
    type: 'number'
    definition: @aql order_items | sum(order_items.quantity * products.price) ;;
  }

  metric cumulative_revenue {
    label: 'Cumulative Revenue by Month'
    type: 'number'
    definition: @aql running_total(revenue, orders.created_at_month) ;;
  }
}
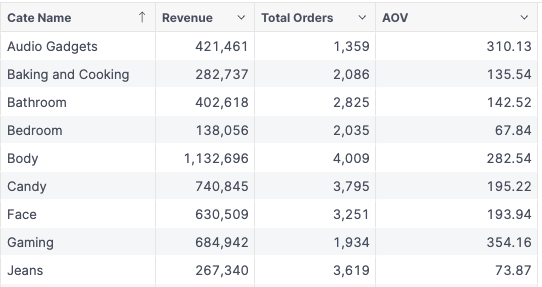
Example 2: Cumulative Average Order Value over Months of each Category
Setup
Sometimes, simply looking at how a metric change over time is not enough - you may want to see how the metric differs between different groups. For example, you may ask: “How does the monthly cumulative average order value differs between categories?”
In this example, we will add the categories model to the ecommerce dataset.
// orders.model.aml
Model orders {
  ...
  dimension id {...}
  dimension user_id {}
  dimension created_at {}

  // note that metrics defined in model are called measures
  measure total_orders {
    label: 'Total Orders'
    type: 'number'
    definition: @aql count(orders.id) ;;
  }
}

// order_items.model.aml
Model order_items.model.aml {
  ...
  dimension order_id {...}
  dimension product_id {...}
  dimension quantity {...}
}

// products.model.aml
Model products {
  ...
  dimension id {...}
  dimension price {...}
  dimension category_id {...}
}

// categories.model.aml
Model categories {
  ...
  dimension id {...}
  dimension name {...}
  dimension parent_id {...}
}

// e_commerce.dataset.aml
Dataset e_commerce {
  ...
  models: [orders, order_items, products, categories]
  relationships: [
    relationship(order_items.order_id > orders.id, true),
    relationship(order_items.product_id > products.id, true),
    relationship(products.category_id > categories.id, true)
  ]

  metric revenue {
    label: 'Revenue'
    type: 'number'
    definition: @aql order_items | sum(order_items.quantity * products.price) ;;
  }

  metric average_order_value {
    label: 'AOV'
    type: 'number'
    definition: @aql safe_divide(revenue, orders.total_orders) ;;
  }

  metric cumulative_aov {
    label: 'Cumulative AOV'
    type: 'number'
    definition: @aql running_total(average_order_value, orders.created_at_month) ;;
  }
}
High-level Flow
- Create the normal average metric: In the
ecommercedataset, we create a simpleaverage_order_valueby dividing the previously createdrevenuemetric with theorders.count_ordersmetric. - Create the cumulative metric: We use the
running_total()to run theaverage_order_valuemetric along theorders.created_at_monthdimension. In the final analysis, we will also include thecategories.namedimension to see the effect.
Implementation
1. Create the normal average metric
In the orders model, we create a total_orders metric that count all the orders:
Model orders {
  ...

  // note that metrics defined in model are called measures
  measure total_orders {
    label: 'Total Orders'
    type: 'number'
    definition: @aql count(orders.id) ;;
  }
}
To create the average_order_values metric, we can actually reuse the revenue metrics we created earlier instead of writing the full calculations again:
Dataset ecommerce {
  ...
  metric revenue {
    label: 'Revenue'
    type: 'number'
    definition: @aql order_items | sum(order_items.quantity * products.price) ;;
  }

  metric average_order_value {
    label: 'AOV'
    type: 'number'
    definition: @aql safe_divide(revenue, orders.total_orders) ;;
  }
}
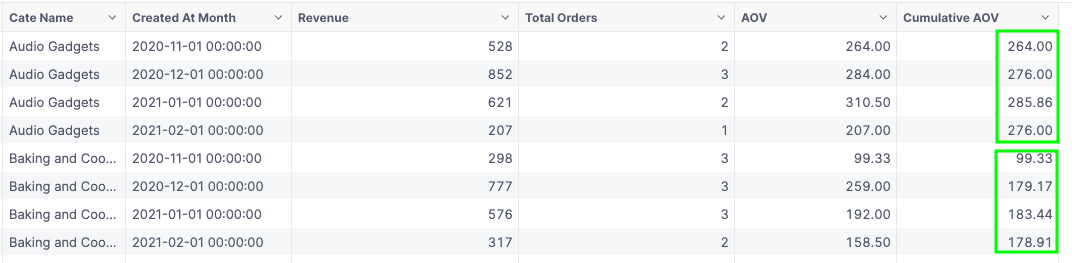
2. Create the cumulative metric
Similar to how we created the cumulative_revenue metric, we use the running_total() function to run the average_order_value metric along orders.created_at_month dimension.
Dataset ecommerce {
  ...

  metric average_order_value {
    label: 'AOV'
    type: 'number'
    definition: @aql safe_divide(revenue, orders.total_orders) ;;
  }

  metric cumulative_aov {
    label: 'Cumulative AOV'
    type: 'number'
    definition: @aql running_total(average_order_value, orders.created_at_month) ;;
  }
}
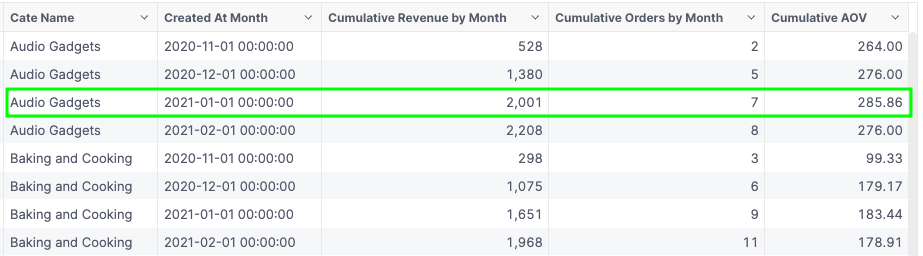
Since the average_order_value metric is only run against the created_at_month dimension, the cumulative_aov metric is partitioned by the categories.name dimension, which is what we wanted:
Producing the cumulative average this way is similar to dividing the cumulative_revenue metric by a cumulative_orders metric: