Path Ambiguity in Dataset
A grasp of these concepts will help you understand this documentation better:
Introduction
When building datasets with multiple models, you may encounter situations where there are multiple possible join paths between two models. This is called path ambiguity, and understanding how Holistics handles it is crucial for building accurate analytics.
For example, let's say you have an e-commerce dataset with the following models and relationships:
Dataset ecommerce {
...
models: [orders, users, order_items, countries, merchants, products, cities]
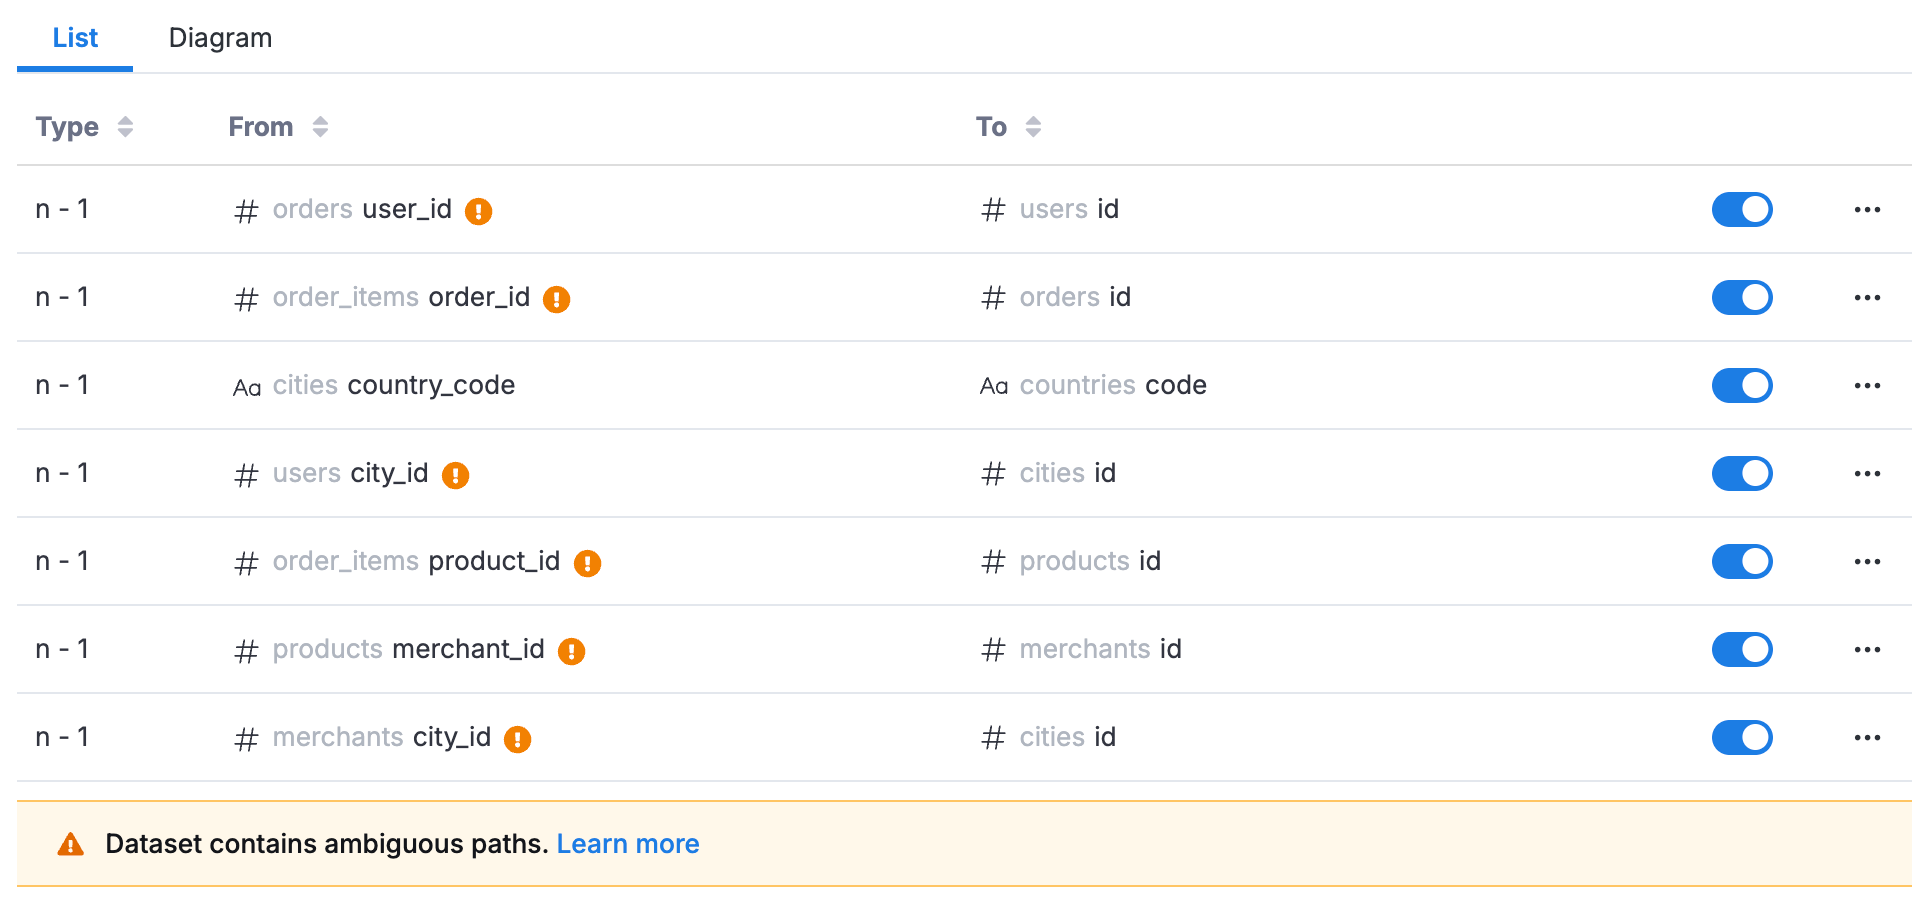
relationships: [
relationship(orders.user_id > users.id, true),
relationship(order_items.order_id > orders.id, true),
relationship(cities.country_code > countries.code, true),
relationship(users.city_id > cities.id, true),
relationship(order_items.product_id > products.id, true),
relationship(products.merchant_id > merchants.id, true),
relationship(merchants.city_id > cities.id, true)
]
}

When you set up relationships like this, you'll see ambiguous path indicators in the dataset editor. This indicator is there to raise awareness, not to block you, so you can still use the dataset normally. Holistics will automatically resolve the ambiguity for you.
This documentation explains how that resolution works so you can understand which path Holistics chooses and why.
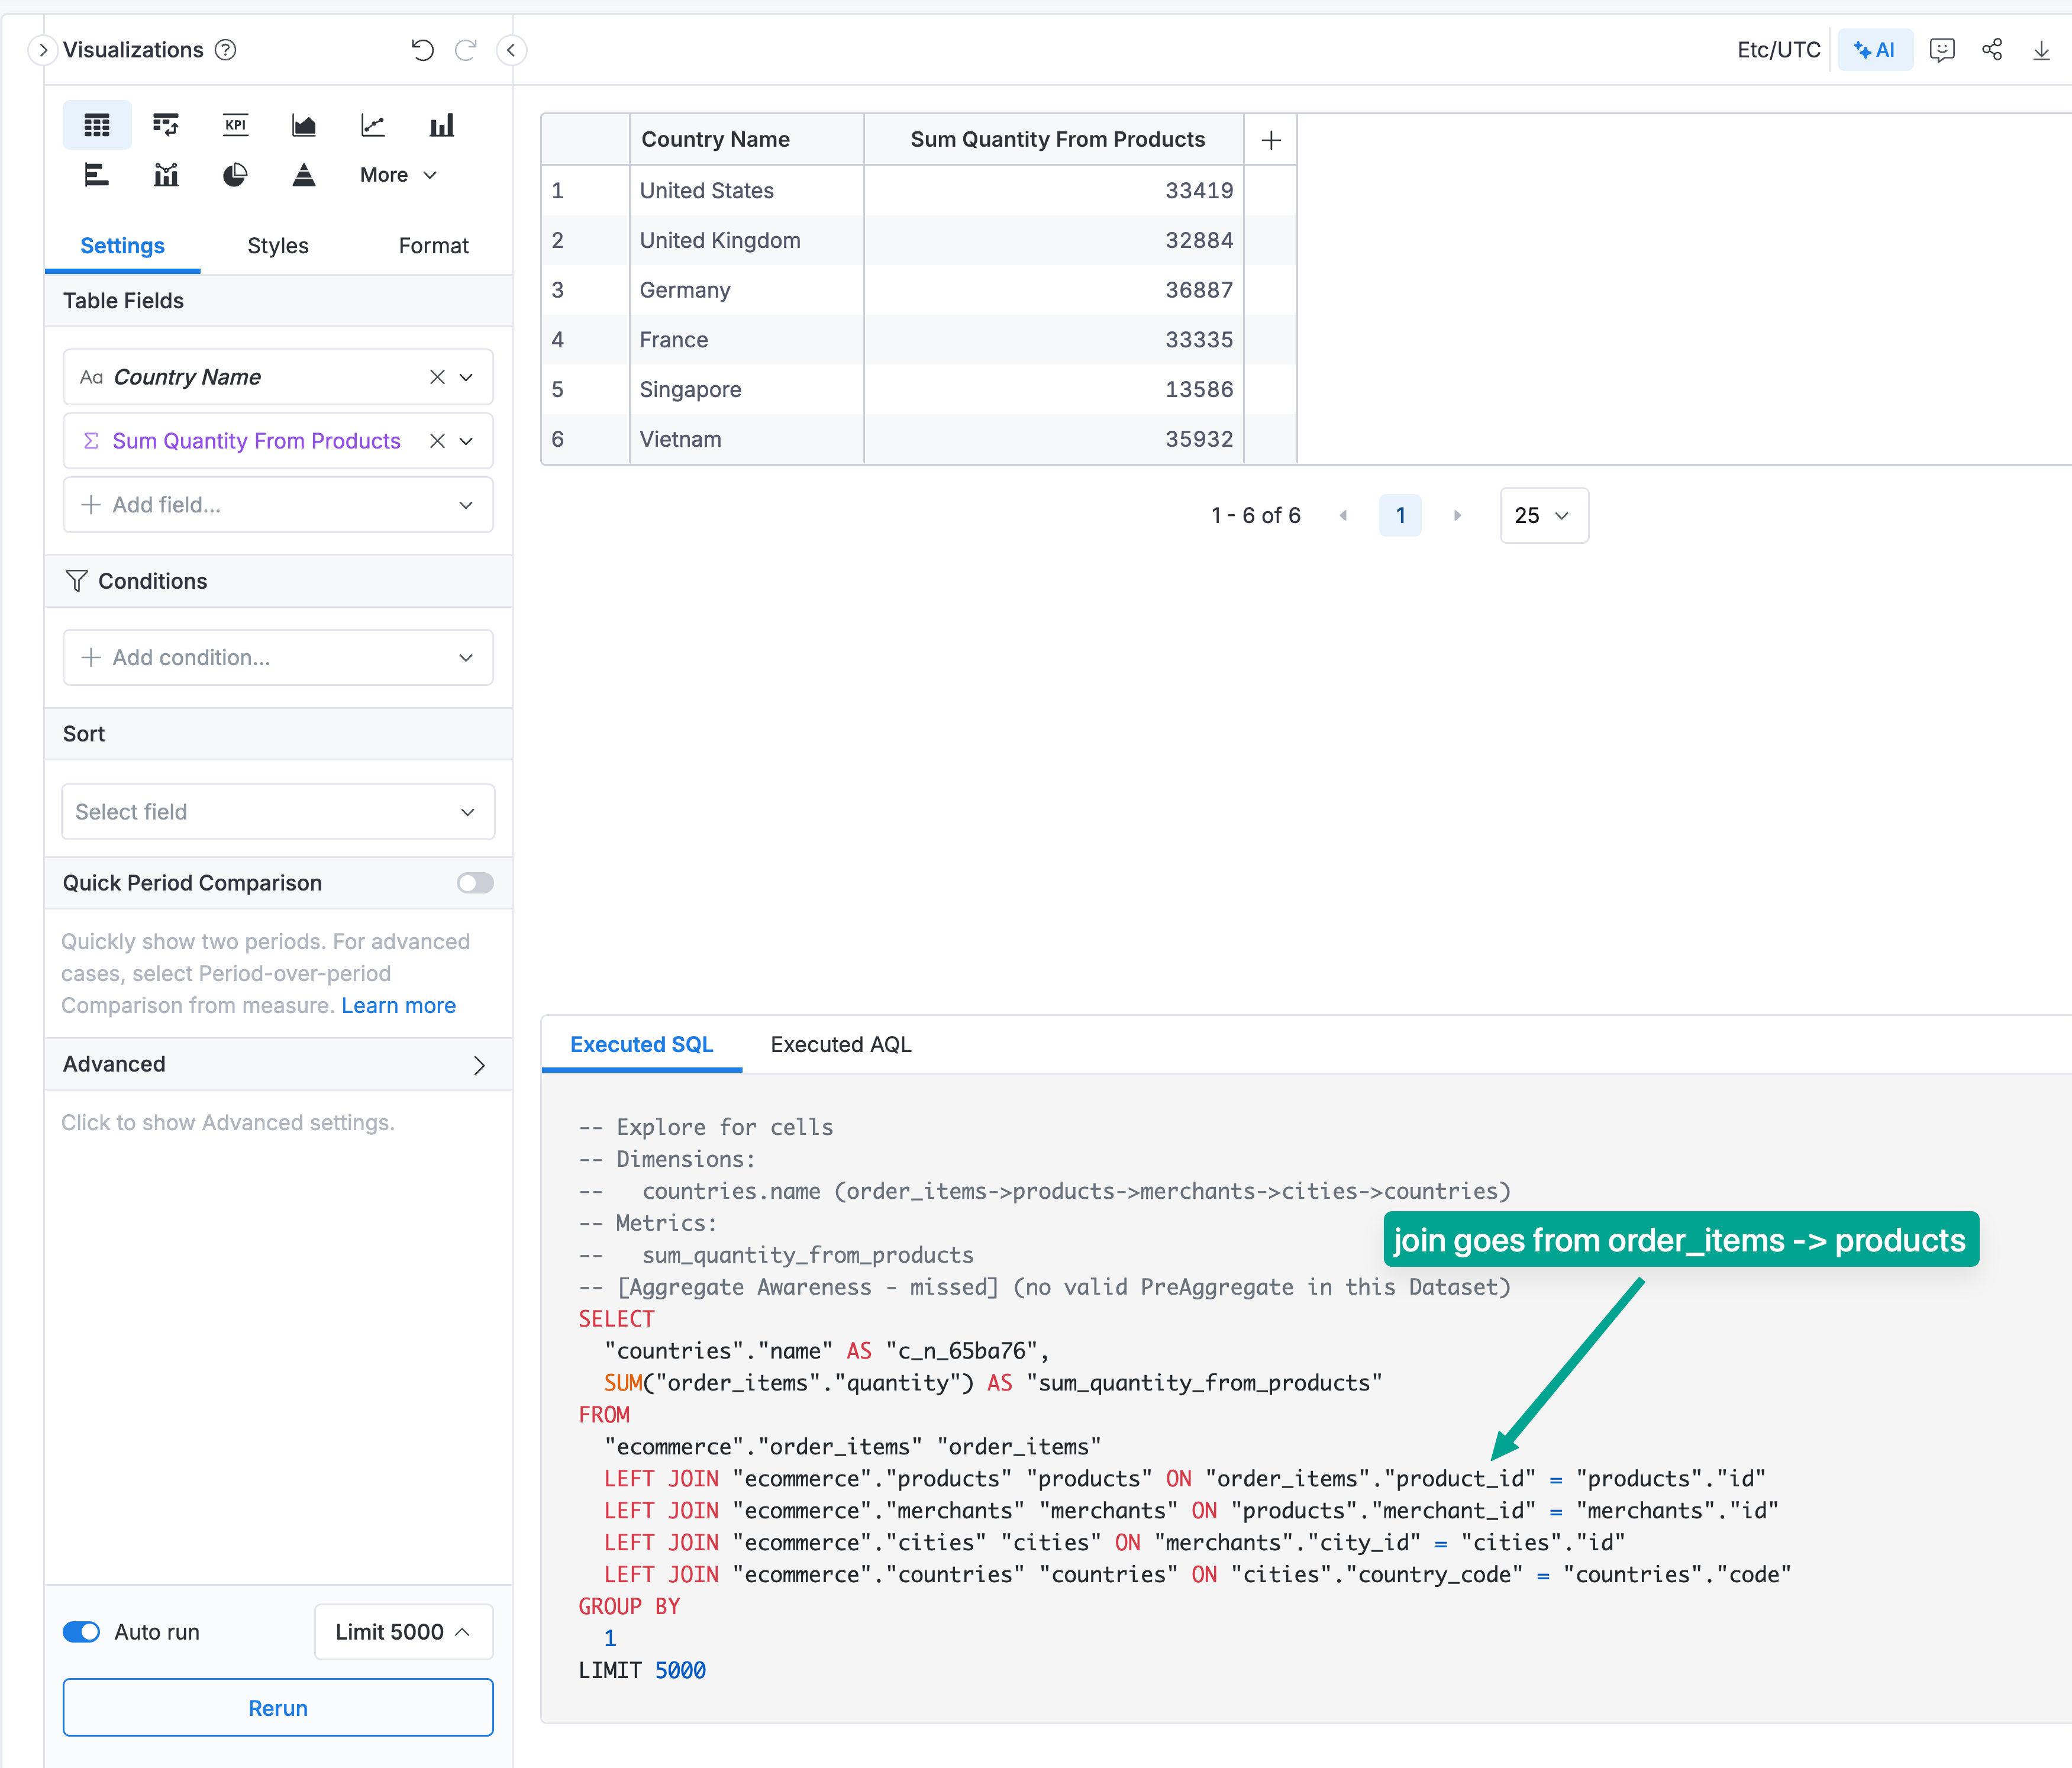
Let's look at a concrete example. Say you want to answer: "What's the total order quantity by country?" You'd drag in Country Name from countries and Total Order Quantity from order_items:
explore {
  dimensions {
    country_name: countries.name
  }
  measures {
    total_order_quantity: sum(order_items.quantity)
  }
}
Here's where ambiguity comes in. There are two valid ways to join from countries to order_items:
- Path A: countries → cities → users → orders → order_items (orders by customer country)
- Path B: countries → cities → merchants → products → order_items (orders by merchant country)
Each path gives you a different answer with a different business meaning: are you analyzing orders based on where your customers live, or where your merchants operate?
How Holistics Resolves Ambiguity Automatically
When multiple paths exist, Holistics intelligently selects the most analytically correct path using a ranking algorithm. You can create datasets with all relationships active, and Holistics will automatically choose the right path at query time.
The algorithm works in 4 steps:
Step 1: Path Tier Classification
All possible paths are categorized into 4 tiers based on common analytics patterns:
- Tier 1 (Best): Only one-to-many relationships (e.g., dimension → fact, like
countries → cities → users → orders) - Tier 2: Only many-to-one relationships (e.g., fact → dimension, like
orders → users → cities → countries) - Tier 3: Special sequential patterns (e.g., many-to-many using junction tables, like
users → orders → order_items → products) - Tier 4: Mixed patterns not matching the above
Step 2: Assign Weights
Each relationship in a path has a default weight of 0. Weights increase when you explicitly specify relationships:
- Default relationships (defined in dataset): Weight = 0
with_relationships()specified: Higher weight than default- Nested
with_relationships(): Inner (nested) relationships get even higher weight
This means explicitly specified paths using with_relationships() take priority over default paths.
Step 3: Rank Paths
Paths are compared in this order:
- Tier first (Tier 1 > Tier 2 > Tier 3 > Tier 4)
- Weight second (higher scores preferred)
- Path length third (shorter paths preferred as they're simpler and more performant)
Step 4: Automatic Selection with Transparency
- Clear winner: Holistics automatically uses the best-ranked path
- Tie situation: If multiple paths have identical rankings, Holistics will:
- Show a warning in the query preview
- Indicate which path was chosen
- Suggest resolving ambiguity manually
Examples
Example 1: Clear Winner Based on Tier Ranking
Query: "Total products by cities"
Path 1: cities → merchants → products (3 hops)
- Business meaning: Total products produced/sold by merchants in each city
- Pattern: cities → merchants → products
- Tier: Only one-to-many relationships → Tier 1 (Best)
- Length: 3 hops
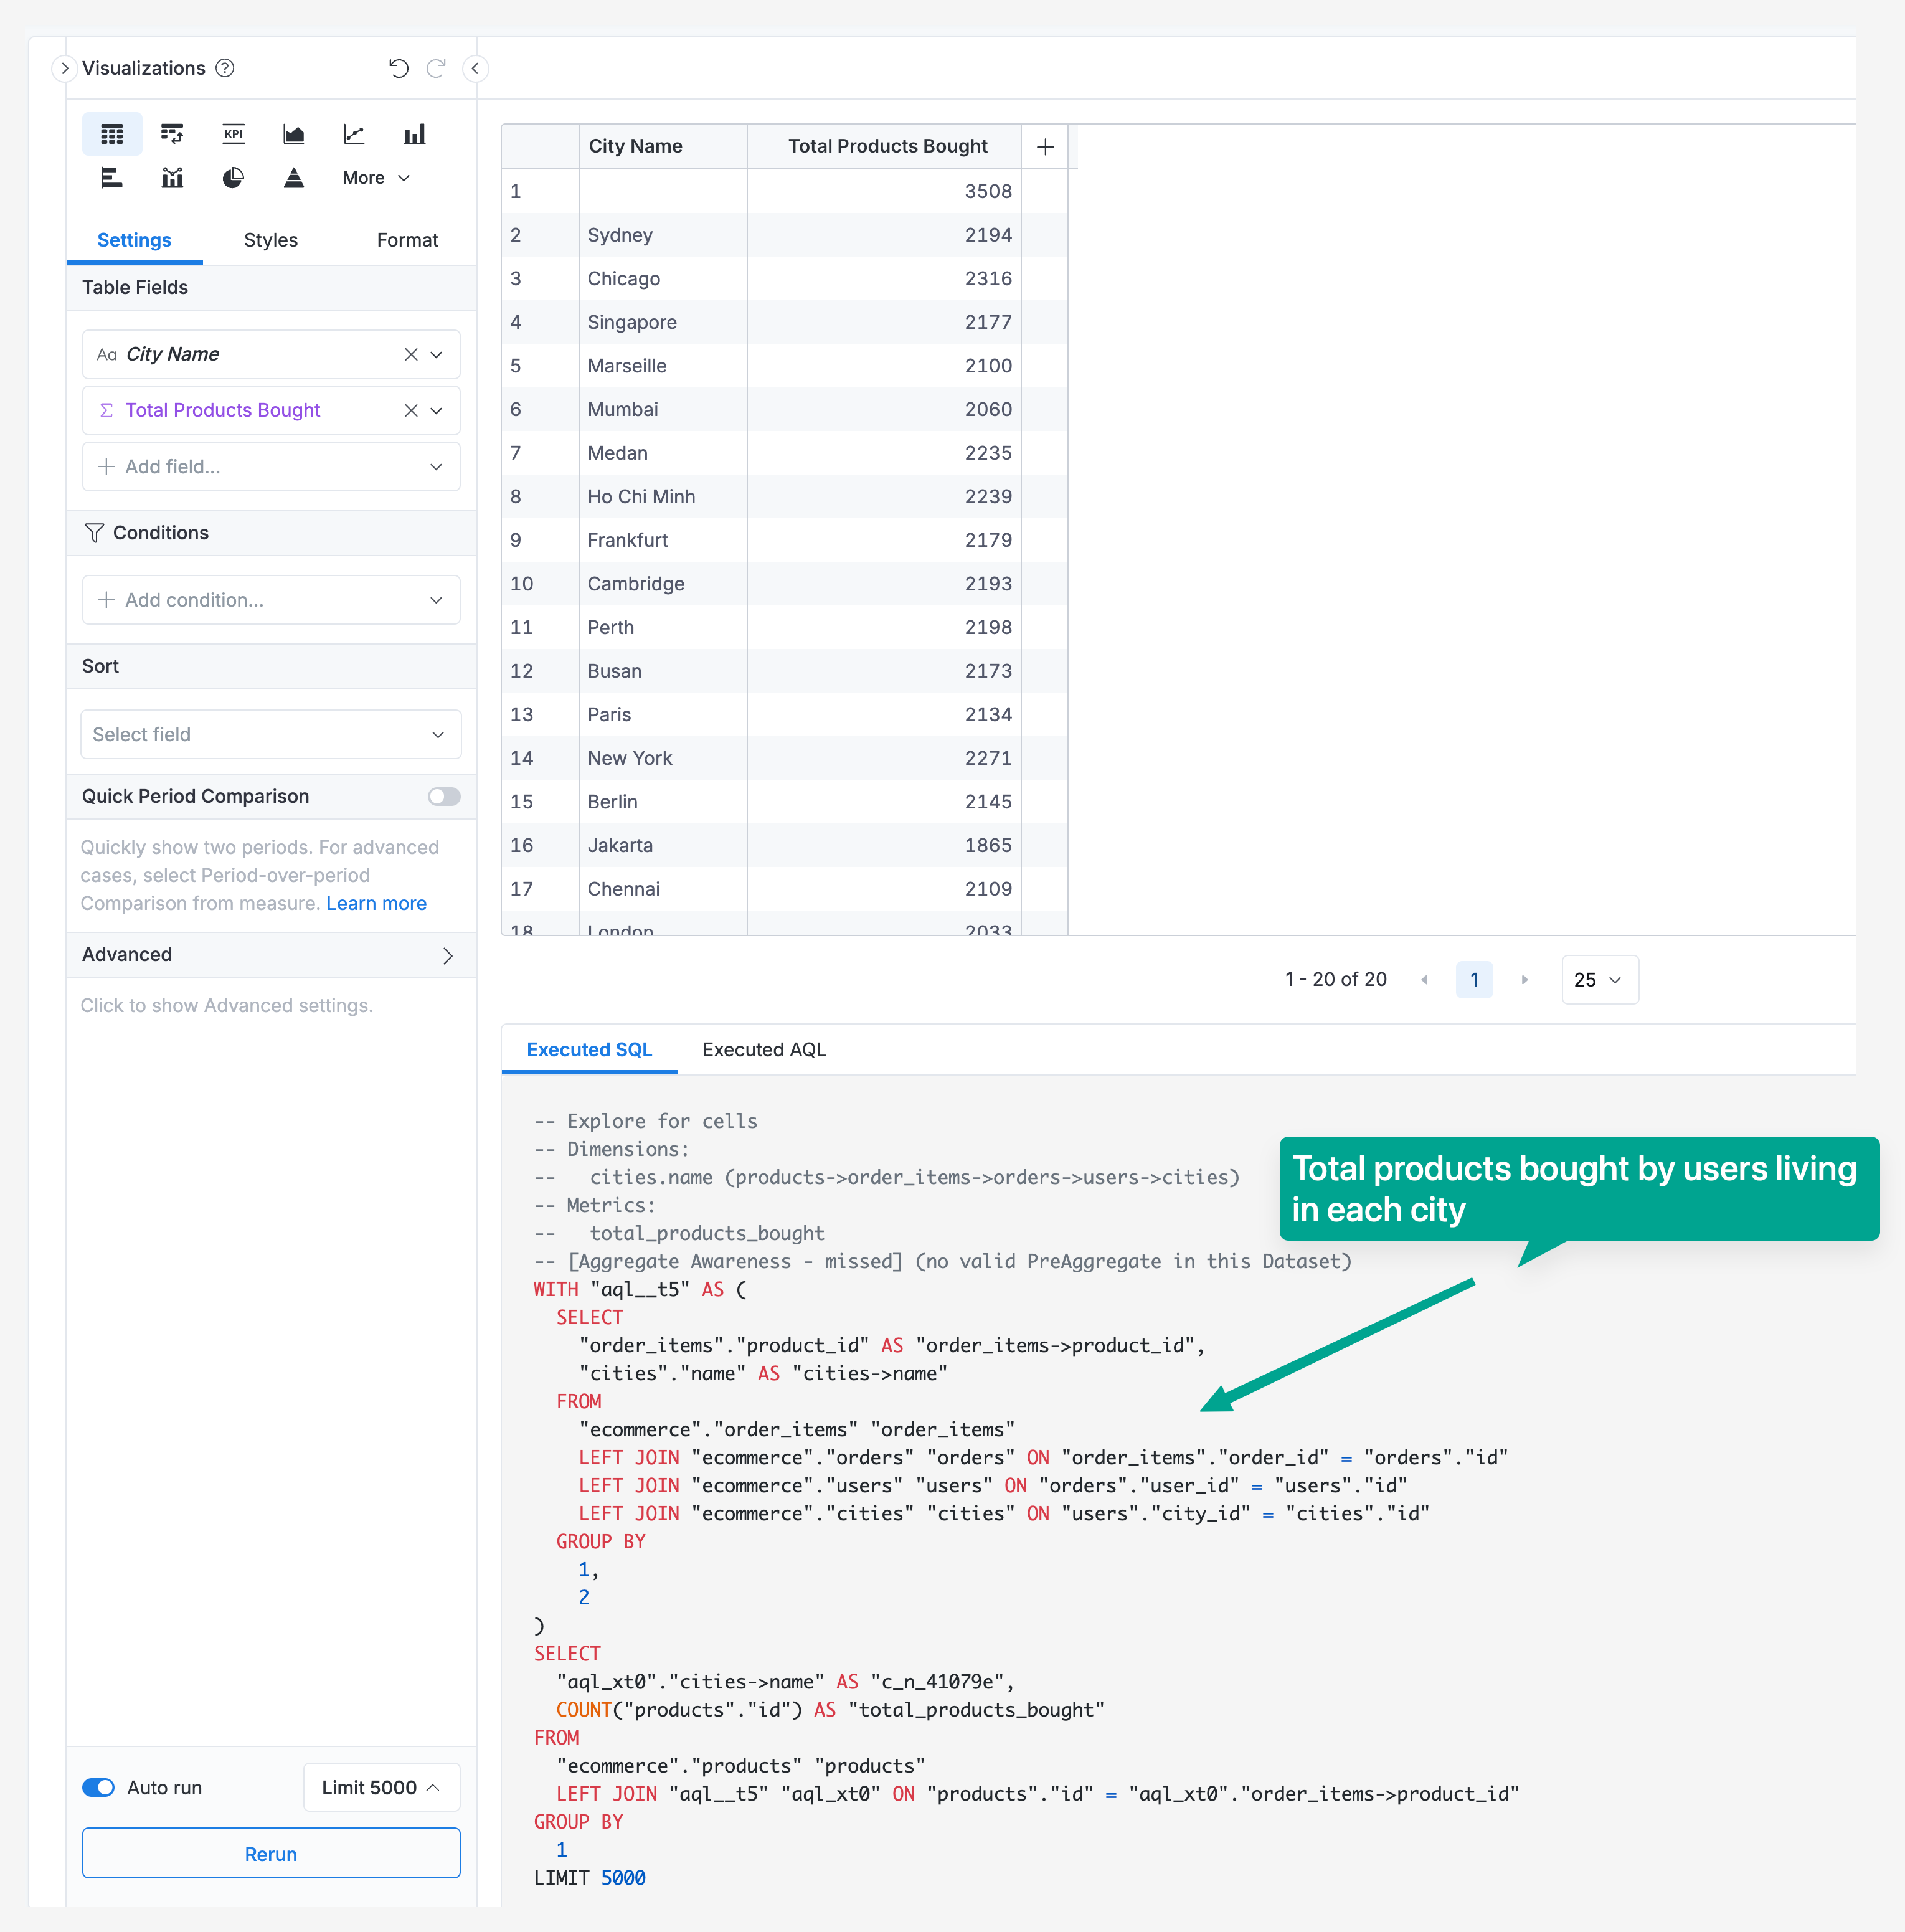
Path 2: cities → users → orders → order_items → products (5 hops)
- Business meaning: Total products bought by users living in each city
- Pattern: cities → users → orders → order_items (junction) → products
- Tier: Many-to-many using junction table (order_items) → Tier 3
- Length: 5 hops
Result: Holistics automatically selects Path 1
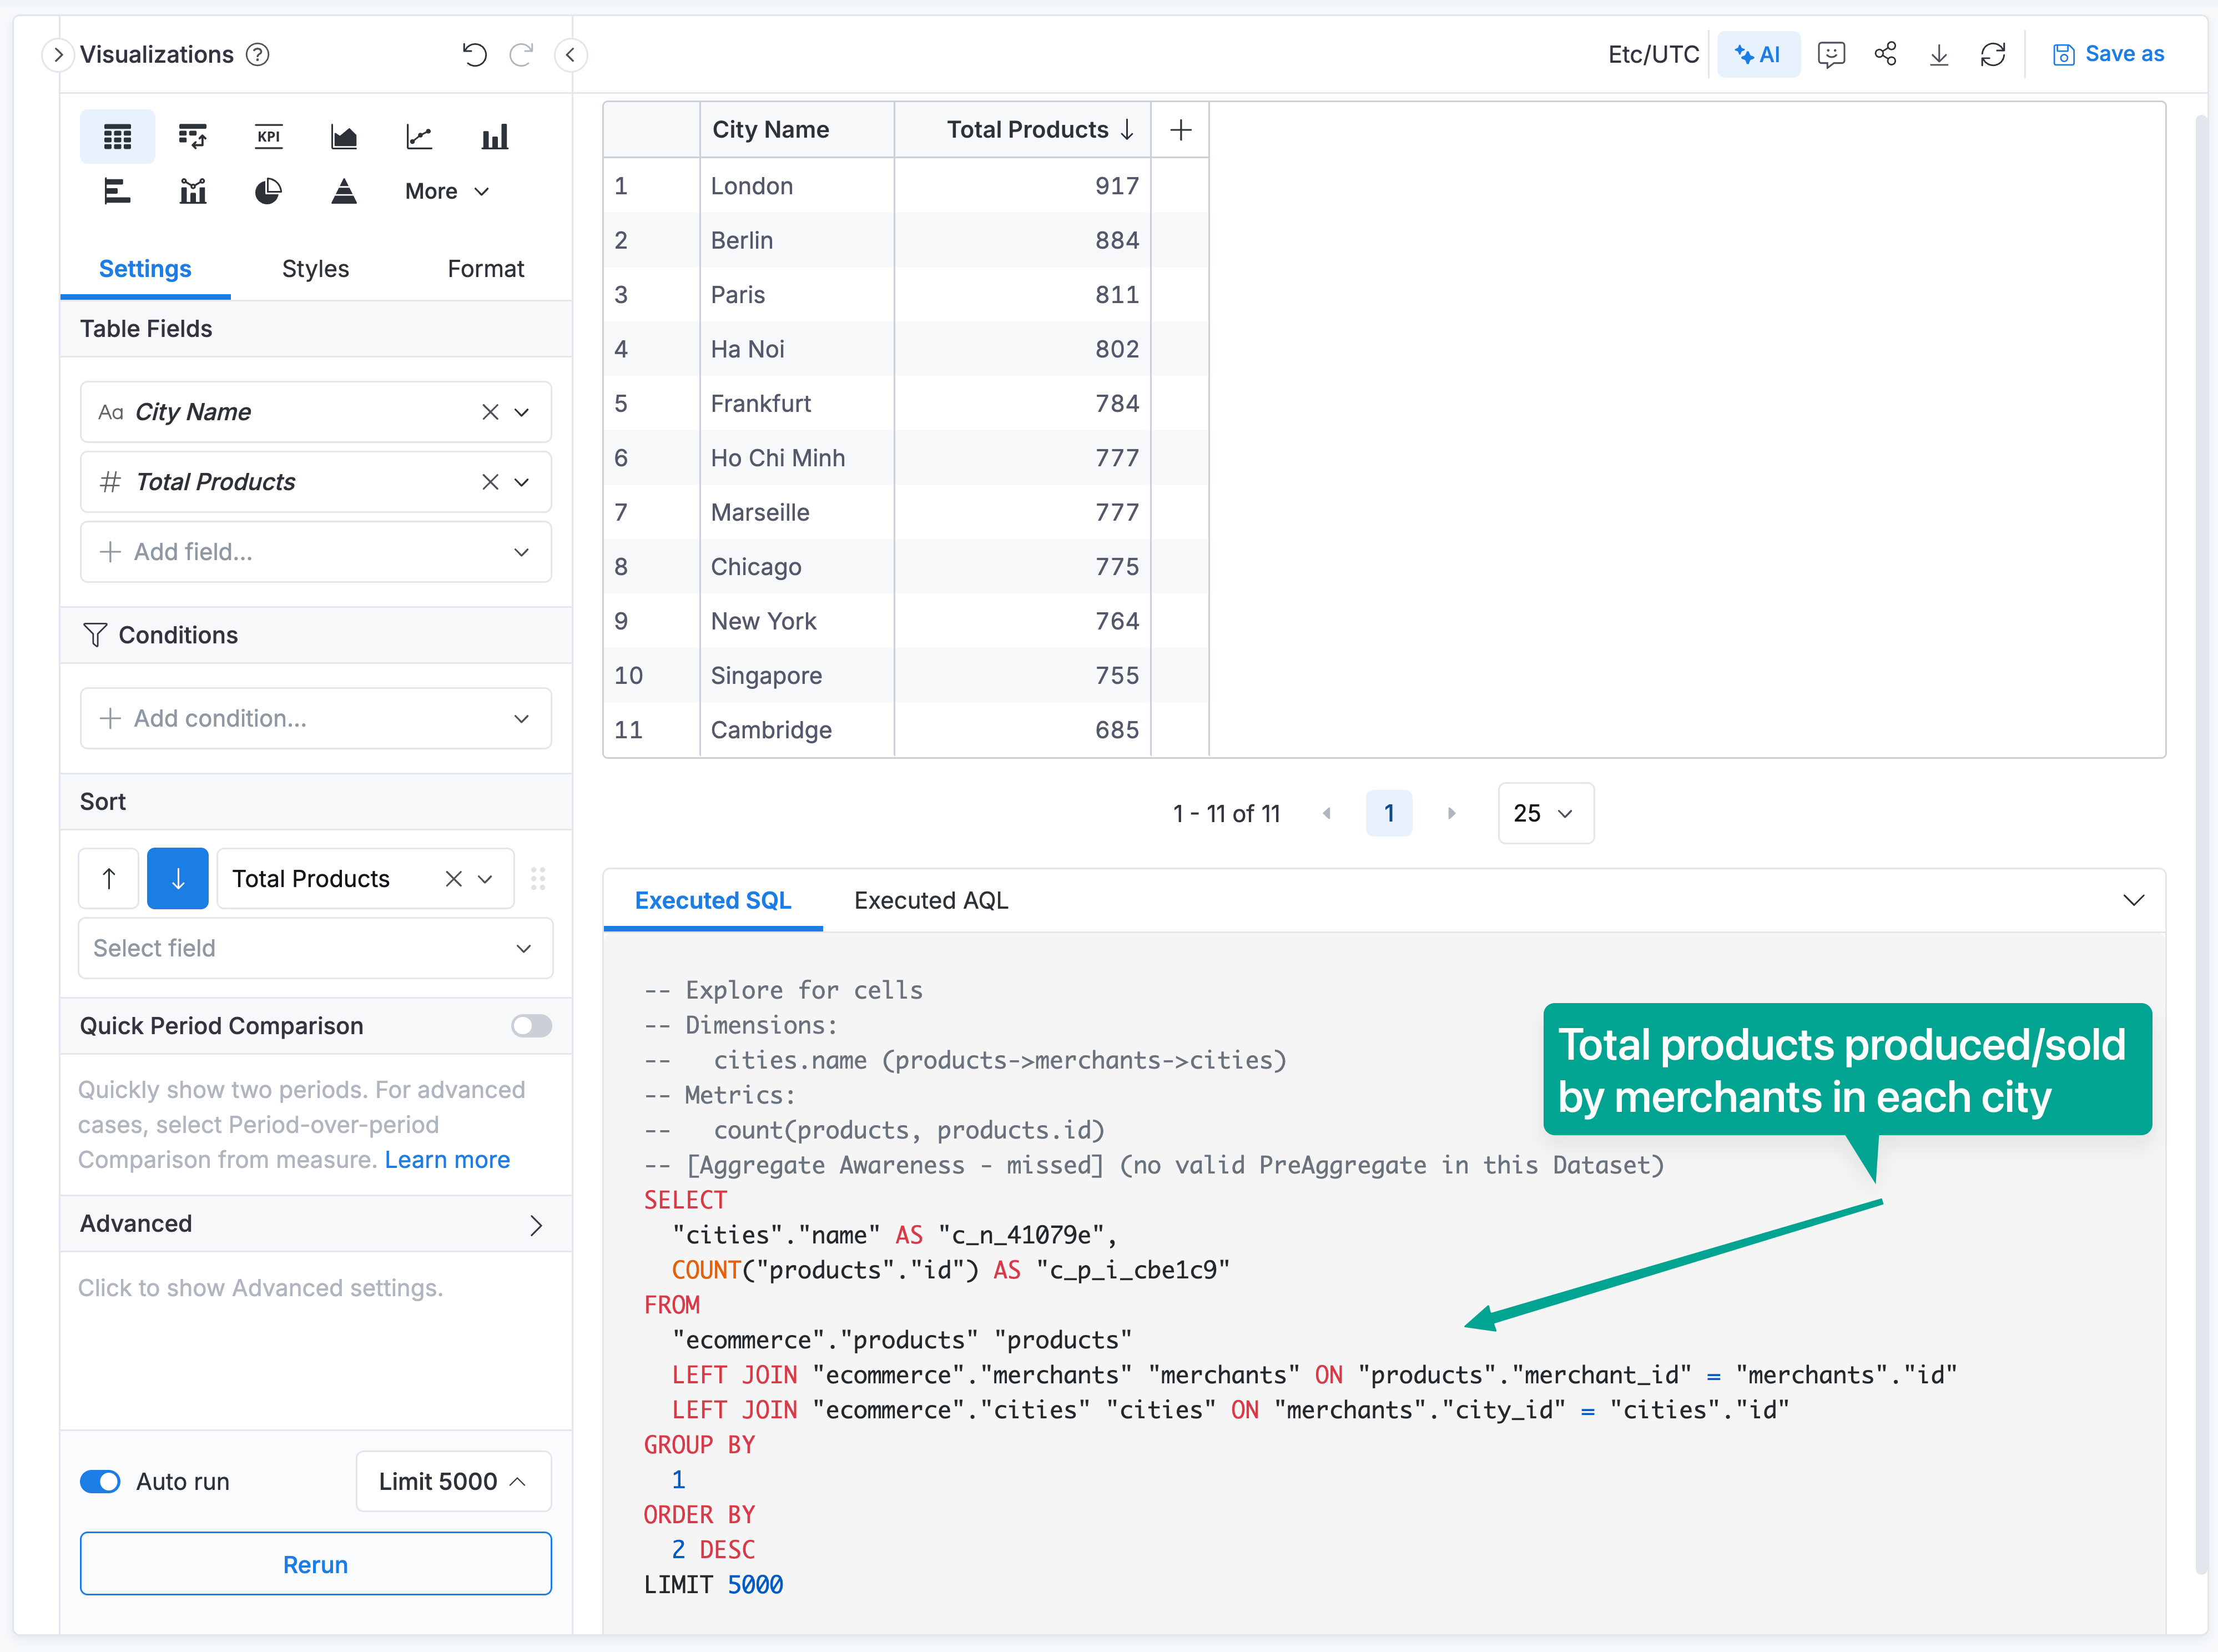
- Tier 1 ranks higher than Tier 3 (tier is the primary ranking criteria)
- Path 1 has a simpler dimension → fact pattern
- Path 2 requires a junction table, making it more complex
Both paths are analytically correct but answer different business questions.
Overriding the automatic selection
If you need Path 2 (products bought by city residents) instead of Path 1 (products sold by city merchants), you can use with_relationships() to control which path to use. We want the customer path instead of the merchant path, so we disable the direct merchant relationship:
Dataset ecommerce {
  ...
  metric products_bought_by_city_residents {
    label: 'Products Bought by City Residents'
    type: 'number'
    definition: @aql
      products
        | count(products.id)
        | with_relationships(
            relationship(products.merchant_id > merchants.id, false, 'two_way')
          )
    ;;
  }
}
By disabling the products → merchants relationship, we're telling Holistics: "Don't take the direct path through merchants. Instead, use the longer path through order_items, orders, and users to reach cities."
Example 2: Tie Situation with Same Tier, Weight, and Path Length
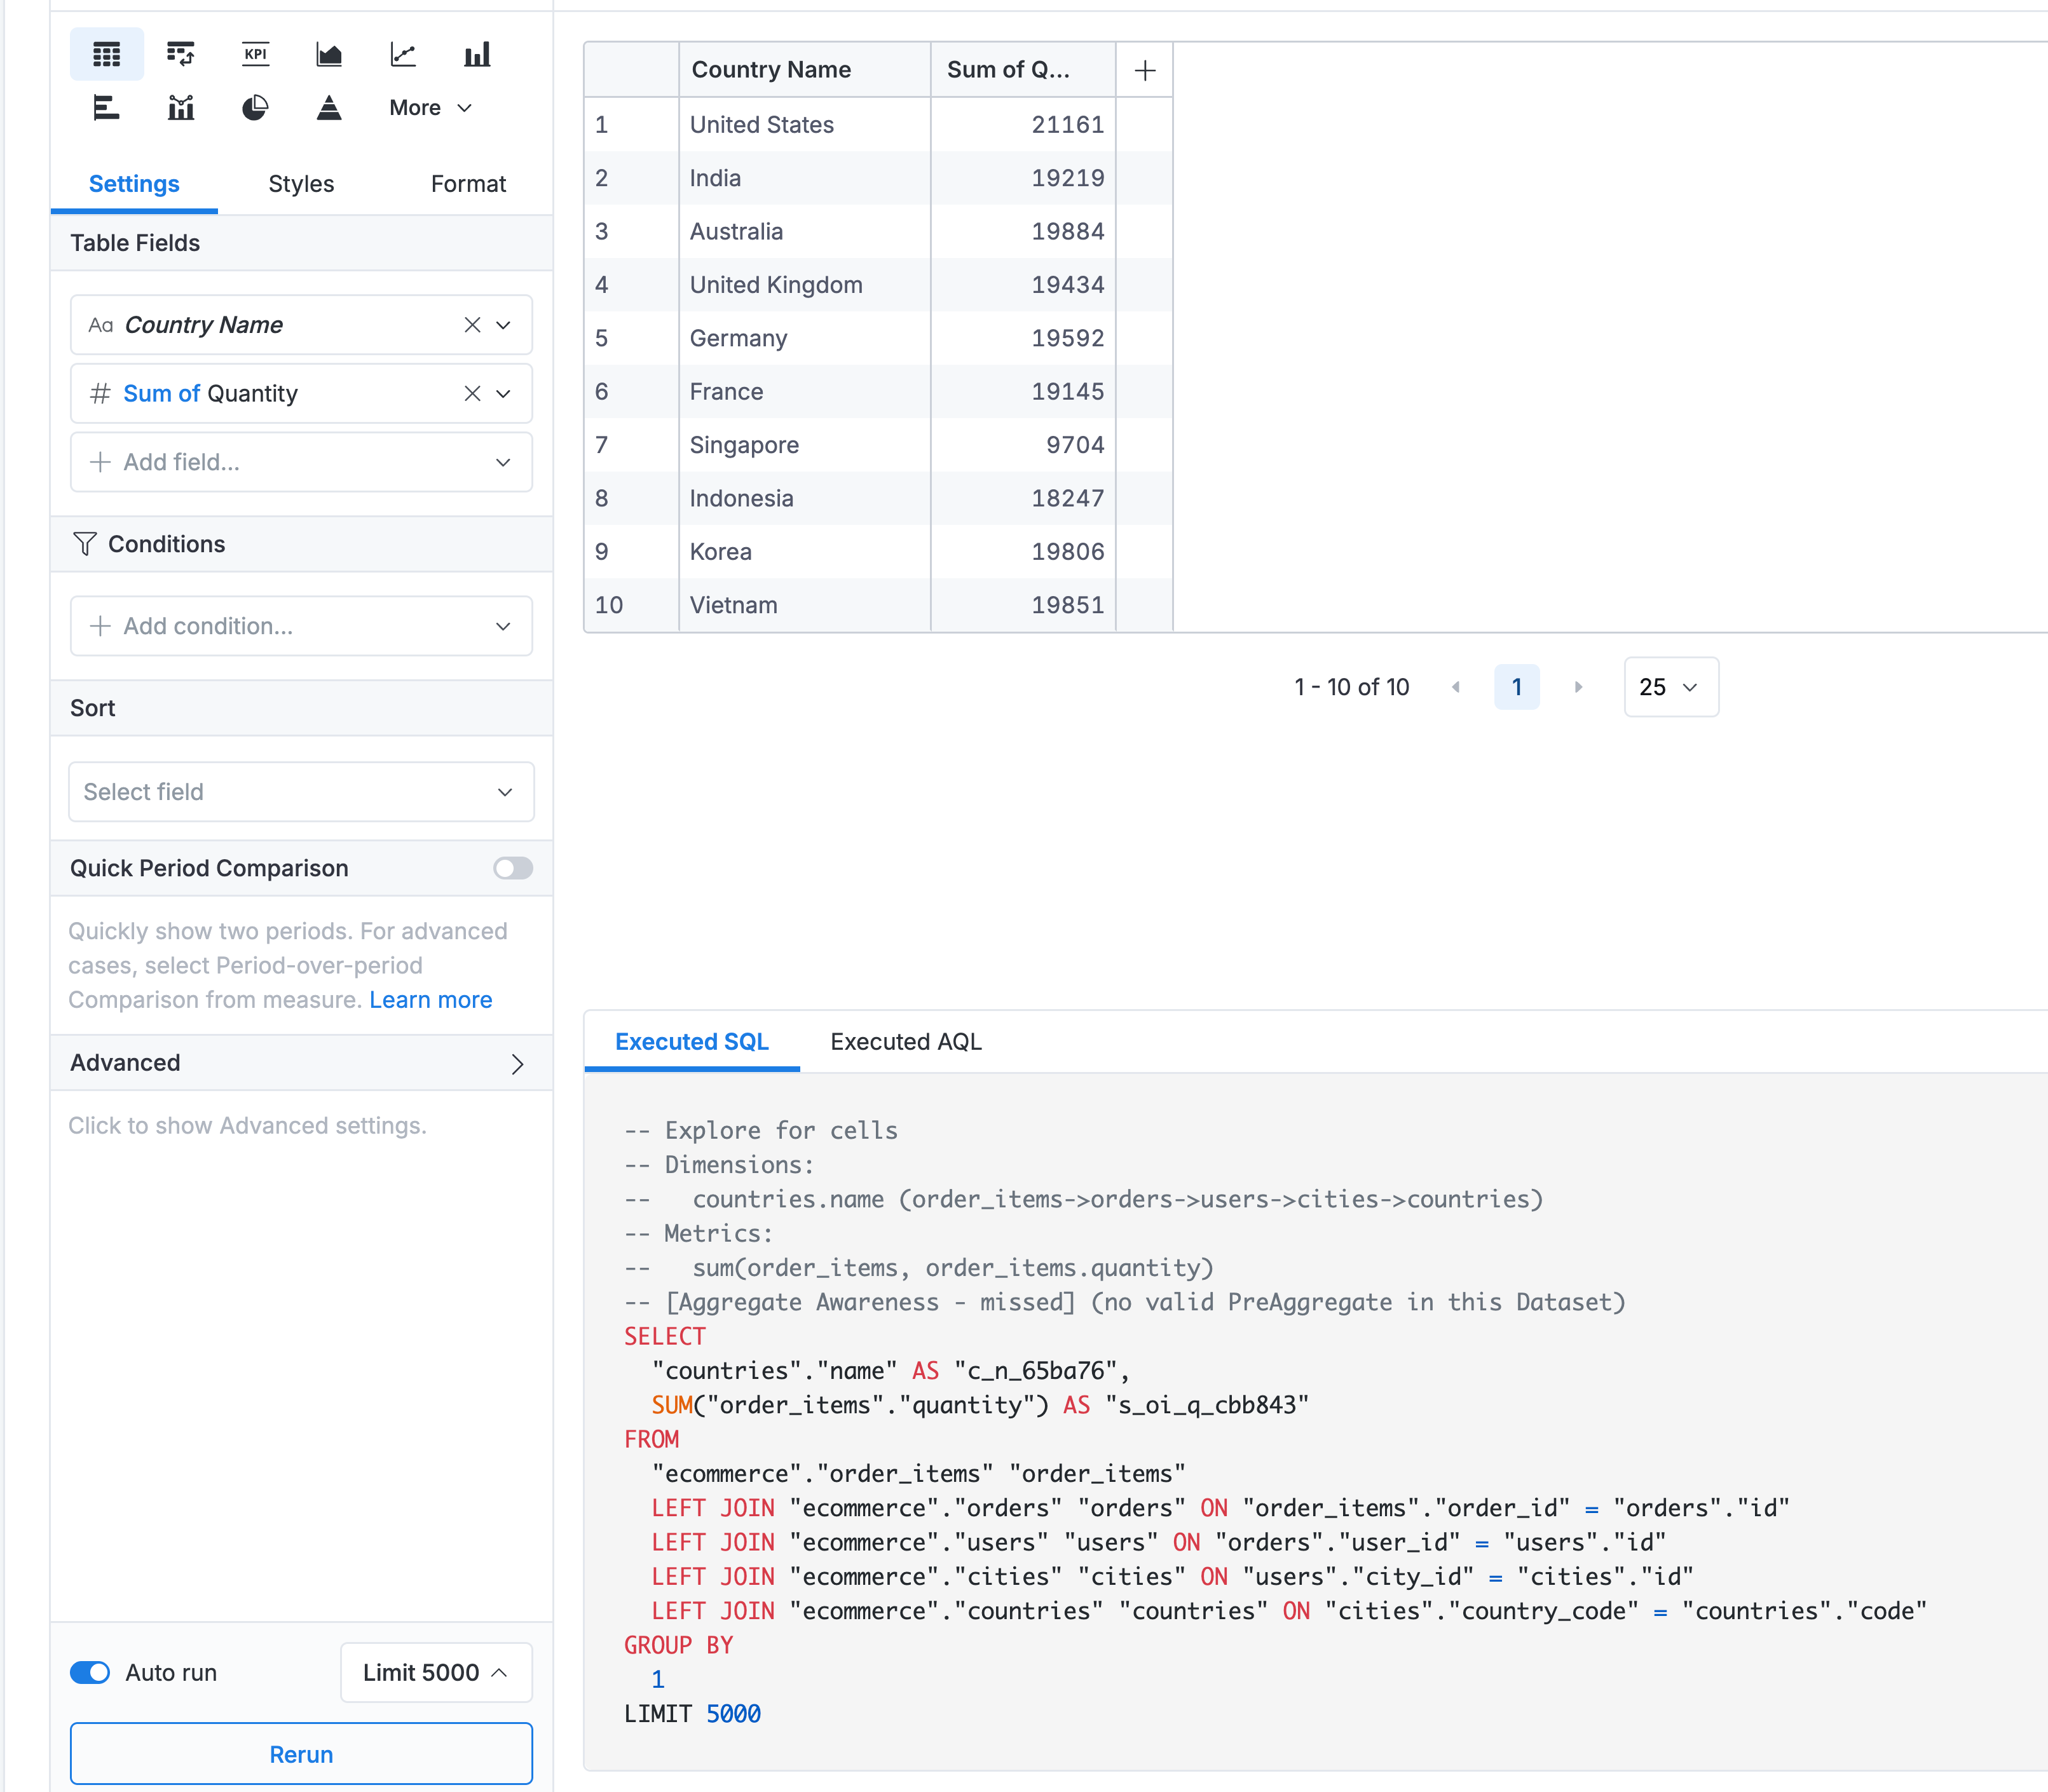
Query: "Total order items by countries"
Path A: countries → cities → users → orders → order_items (5 hops)
- Business meaning: Order items from customers in each country
- Tier: Only one-to-many relationships → Tier 1
- Length: 5 hops
Path B: countries → cities → merchants → products → order_items (5 hops)
- Business meaning: Order items from merchants located in each country
- Tier: Only one-to-many relationships → Tier 1
- Length: 5 hops
Result: Both paths have:
- Same tier (Tier 1 - both are valid dimension-to-fact patterns)
- Same length (5 hops)
- Same weights (both use default relationships)
When faced with a tie, Holistics will automatically pick one of the paths and may display a warning in the query preview, suggesting that you explicitly define which path to use for better clarity.
Overriding the automatic selection:
If you need a different path than the one Holistics selected, you can use with_relationships() to explicitly control which path to use. In this example, we want the merchant path instead of the customer path, so we disable the relationship that leads through customers:
Dataset ecommerce {
  ...
  metric orders_by_merchant_countries {
    label: 'Total Orders by Merchant Countries'
    type: 'number'
    definition: @aql
      order_items
        | count(order_items.id)
        | with_relationships(
            relationship(order_items.order_id > orders.id, false, 'two_way')
          )
    ;;
  }
}
By disabling the order_items → orders relationship, we're telling Holistics: "Don't go through orders to reach countries. Instead, use the alternative path through products and merchants."
When Automatic Resolution Cannot Work
While Holistics' automatic path resolution handles most ambiguous path scenarios, there are specific cases where the algorithm cannot determine the correct path automatically. In these situations, you must manually configure your relationships.
Role-Playing Dimensions
Role-playing dimensions occur when the same dimension table is referenced multiple times from a single fact table, each time with a different meaning. The classic example is using a date dimension for multiple date fields in an order fact: created date, delivered date, cancelled date, etc.
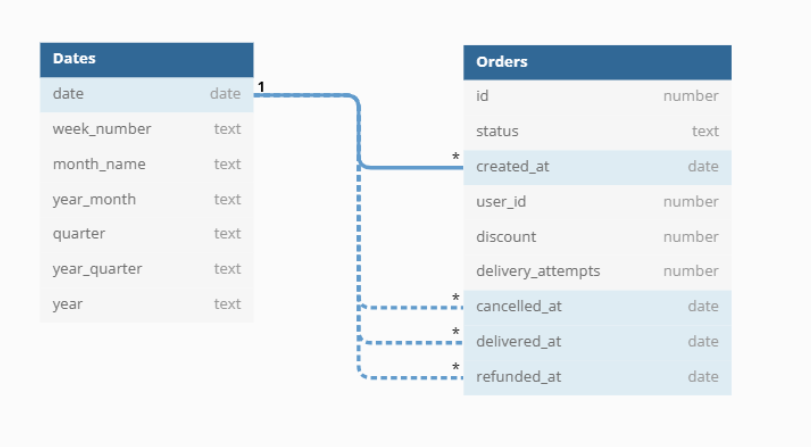
Why automatic resolution fails: When you have multiple relationships between the same two models (e.g., fct_orders → dim_dates via created_at, delivered_at, cancelled_at), there is no clear "winner" based on tier, weight, or path length - all paths have identical characteristics.
Solution: You must disable all relationships except one (the most commonly used), and use with_relationships() to explicitly activate the other relationships when needed.
For detailed implementation steps and an alternative approach using extend(), see Role-Playing Dimensions Pattern.
Manual Control Options
While automatic resolution works well for most cases, you have full control to override the behavior:
Option 1: Disable Relationships and Use with_relationships()
Use with_relationships() to explicitly specify which path a metric should use. This is ideal when different metrics need different paths.
Dataset ecommerce {
  ...

  relationships: [
    relationship(orders.user_id > users.id, true),
    relationship(order_items.order_id > orders.id, true),
    relationship(order_items.product_id > products.id, true),
    relationship(users.city_id > cities.id, true),
    relationship(cities.country_code > countries.code, true),
    relationship(products.merchant_id > merchants.id, true),
    relationship(merchants.city_id > cities.id, false)  // The relationship is currently disabled
  ]

  metric order_values_by_merchant_countries {
    label: 'Total Order Values by Merchant Countries'
    type: 'number'
    definition: @aql orders
      | count(orders.id)
      | with_relationships(merchants.city_id > cities.id);;
    ;;
  }
}
When to use:
- You want to completely prevent a certain path from being used across the entire dataset
- You're working with legacy datasets and want to maintain existing behavior
Trade-offs:
- ❌ Disables the path for ALL queries in the dataset
- ❌ Requires
with_relationships()to re-enable for specific metrics
Option 2: Duplicate Models
Create separate dimension models for different contexts (e.g., user_cities and merchant_cities):

When to use:
- Clear semantic separation is important for end users
- You want to avoid any ambiguity warnings
Trade-offs:
- ❌ Makes the dataset larger and more complex to maintain
- ❌ Duplicates dimension data
Best Practices
-
Let Holistics handle it: For most cases, the automatic resolution works correctly. Trust the algorithm!
-
Use
with_relationships()for exceptions: When you need a specific path that differs from the automatic selection, explicitly declare it. -
Monitor warnings: If you see ambiguity warnings in query previews, review whether the automatic selection makes sense for your use case.
-
Document complex paths: Add comments in your AML code explaining why specific paths are chosen for metrics.
-
Test your metrics: Always verify that metrics return expected results, especially in datasets with multiple possible paths.