Multiple Levels Ranking
This documentation assumes you are familiar with the following concepts:
Introduction
The requirement to rank items in a report is a common business requirement. For example, you need to know the top-performing products in a certain aspect so you can double-down on them, or knowing the worst performing items so you can investigate for further problems.
In this guide, we will walk you through some examples of how to use the rank() function in Holistics to answer the following questions:
- What are the products with the highest sales in the whole platform?
- What are the products rankings within each category?
- Compare products’ ranks within the category and across all categories
Overall, ranking falls into two categories: Dynamic Ranking and Static Ranking.
- Dynamic Ranking: Affected by filters and dimensions, and is a metric in Holistics.
- Static Ranking: Not affected by filters and dimensions. A Static Ranking field is a dimension.
The first two questions can be answered by a ranking metric (dynamic ranking), while the third question need a ranking dimension (static ranking)
Example 1: Ranks all products by total sales
Setup
In this example, the e_commerce dataset will contain the following models: order_items , products .
- Initial Setup
- Final Setup
// order_items.model.aml
Model order_items.model.aml {
  ...
  dimension order_id {...}
  dimension product_id {...}
  dimension quantity {...}
}

// products.model.aml
Model products {
  ...
  dimension id {...}
  dimension price {...}
  dimension category_id {...}
}

// e_commerce.dataset.aml
Dataset e_commerce {
  ...
  models: [order_items, products]
  relationships: [
    relationship(order_items.product_id > products.id, true)
  ]
}
// order_items.model.aml
Model order_items.model.aml {
  ...
  dimension order_id {...}
  dimension product_id {...}
  dimension quantity {...}
}

// products.model.aml
Model products {
  ...
  dimension id {...}
  dimension price {...}
  dimension category_id {...}
}

// e_commerce.dataset.aml
Dataset e_commerce {
  ...
  models: [order_items, products]
  relationships: [
    relationship(order_items.product_id > products.id, true)
  ]

  metric revenue {
    label: 'Revenue'
    type: 'number'
    definition: @aql sum(order_items, order_items.quantity * products.price);;
  }

  metric ranking {
    label: 'Ranking'
    type: 'number'
    definition: @aql rank(order: total_sales | desc());;
  }

}
High-level flow
- Create a Revenue metric: In the
e_commercedataset, we create a simplerevenuemetric that calculate order value by summing overorder_items.quantitymultiplied byproducts.price. - Create a Ranking metric: Use the
rank()function to takerevenueas in put and generate ranking numbers in descending order (larger revenue value comes first) - Visualize: Include the Ranking metric with Product Name in the visualization to answer your questions
Implementation
1. Create a Revenue metric
In the definition file of the e_commerce dataset, we can easily create a Revenue metric that combines fields from two different models (order_items and products). This will be the basis for our ranking:
Dataset e_commerce {

  ...

  metric revenue {
    label: 'Revenue'
    type: 'number'
    definition: @aql coalesce(
      order_items | sum(order_items.quantity * products.price),
      0
    ) ;;
  }
}
In cases where a dimension (like products, or users) have no order records, the corresponding revenue will be 0 instead of NULL. This way we do not need to worry about different ways that different databases handle NULL when ranking.
2. Create a Ranking metric
We continue to create the Ranking metric that use the Revenue metric as the ordering field. The syntax revenue | desc() is necessary if we want the revenue values are ranked in descending order.
Dataset e_commerce {

  ...

  metric revenue {
    label: 'Revenue'
    type: 'number'
    definition: @aql order_items | sum(order_items.quantity * products.price) ;;
  }

  metric ranking {
    label: 'Ranking'
    type: 'number'
    definition: @aql rank(order: revenue | desc());;
  }
}
3. Visualize
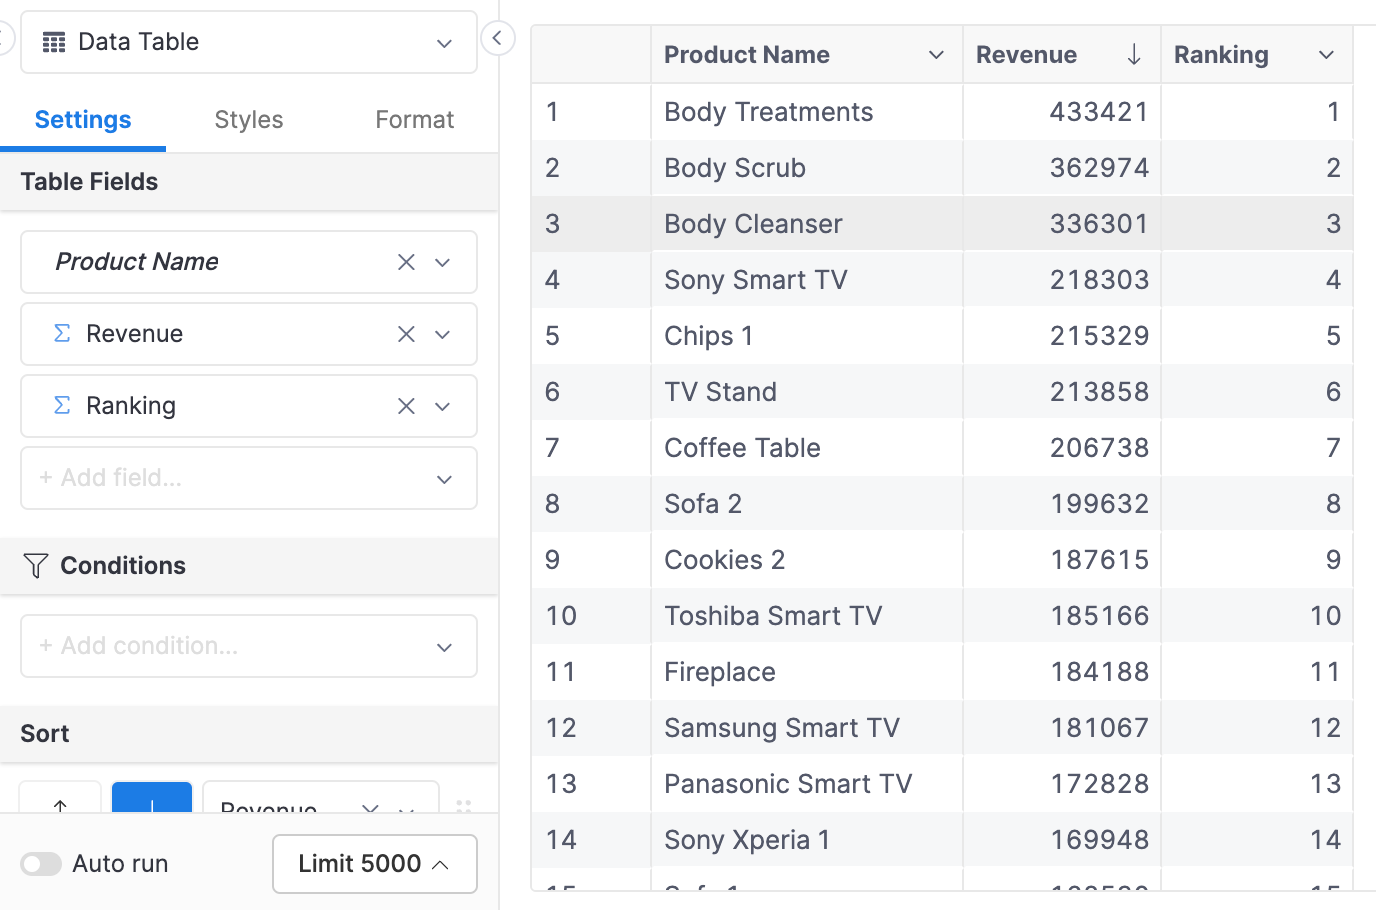
You can combine the Ranking metric with any dimensions to calculate it ranking basing on revenue. For example, here we visualize the ranking of Products:
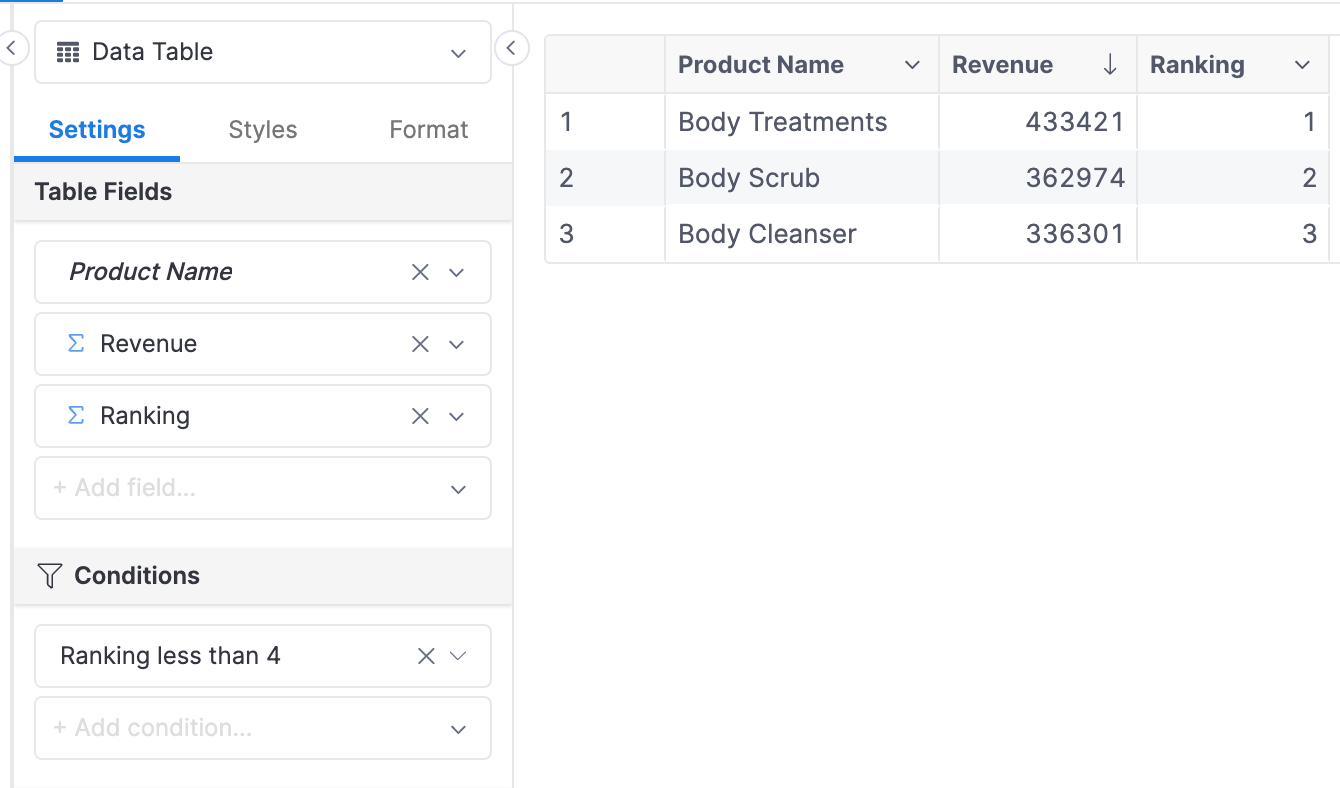
The ranking metric can also be used to filter. For example, we can choose to display the top 3 products by revenue:
Example 2: Ranking within a category
Sometimes knowing what sells the most across the whole platform is not insightful enough - we want to know the top products within each category. In this example, we will explore how to answer this question.
Setup
The setup will be quite similar to Example 1. The only difference is that we will add the categories model to the dataset:
- Initial Setup
- Final Setup
// order_items.model.aml
Model order_items.model.aml {
  ...
  dimension order_id {...}
  dimension product_id {...}
  dimension quantity {...}
}

// products.model.aml
Model products {
  ...
  dimension id {...}
  dimension price {...}
  dimension category_id {...}
}

// merchants.model.aml
Model merchants {
  ...
  dimension id {...}
  dimension name {...}
}

// categories.model.aml
Model categories {
  ...
  dimension id {...}
  dimension name {...}
}

// e_commerce.dataset.aml
Dataset e_commerce {
  ...
  models: [order_items, products, merchants]
  relationships: [
    relationship(order_items.product_id > products.id, true)
    relationship(products.merchant_id > merchants.id, true)
    relationship(products.category_id > categories.id, true)
  ]
}
// order_items.model.aml
Model order_items.model.aml {
  ...
  dimension order_id {...}
  dimension product_id {...}
  dimension quantity {...}
}

// products.model.aml
Model products {
  ...
  dimension id {...}
  dimension price {...}
  dimension category_id {...}
}

// merchants.model.aml
Model merchants {
  ...
  dimension id {...}
  dimension name {...}
}

// categories.model.aml
Model categories {
  ...
  dimension id {...}
  dimension name {...}
}

// e_commerce.dataset.aml
Dataset e_commerce {
  ...
  models: [order_items, products, merchants]
  relationships: [
    relationship(order_items.product_id > products.id, true)
    relationship(products.merchant_id > merchants.id, true)
    relationship(products.category_id > categories.id, true)
  ]

  metric revenue {
    label: 'Revenue'
    type: 'number'
    definition: @aql sum(order_items, order_items.quantity * products.price);;
  }

  metric ranking_by_cate {
    label: 'Ranking by Cate'
    type: 'number'
    definition: @aql rank(order: revenue | desc(), partition: categories.name);;
  }
}
High-level flow
- Create a Ranking by Category metric: In this new ranking metric, we will include Category Name as the partition field
- Visualization: For this ranking metric with partition to work, we will need to include the partition field (Category Name) field in the visualization.
Implementation
1. Create a Ranking by Category metric
When defining the ranking metric, we reuse the Revenue metric that we have defined. We will pass the categories.name field into the partition argument of the rank() function to specify that the ranking should be calculated within a category:
Dataset e_commerce {

  ...

  metric revenue {
    label: 'Revenue'
    type: 'number'
    definition: @aql order_items | sum(order_items.quantity * products.price) ;;
  }

  metric ranking_by_cate {
    label: 'Ranking by Category'
    type: 'number'
    definition: @aql rank(order: revenue | desc(), partition: categories.name);;
  }
}
2. Visualization
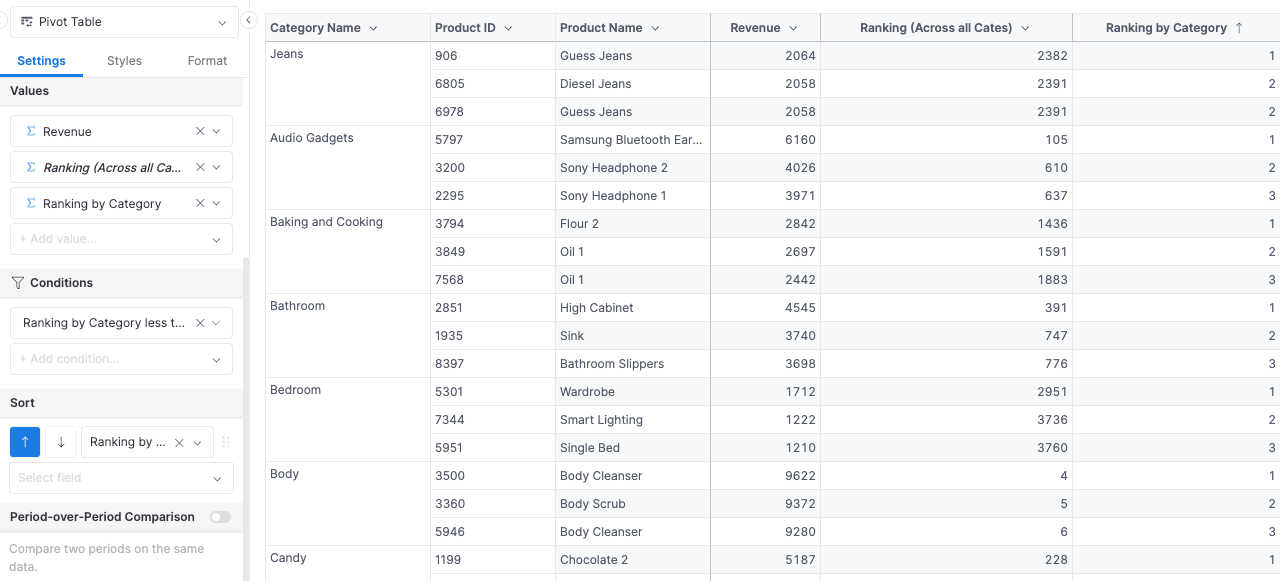
When specifying the categories.name field as the partition field, we must include it in the visualization for the ranking to work correctly.
Below is the result, where we only display products with rank from 1 to 3 within a category.
Example 3: Static Product Ranking
The two ranking examples we have done so far fall under the category of “Dynamic Ranking”. The ranking is dynamic in the sense that the rank values are affected by new filters and dimensions that we include in the visualization.
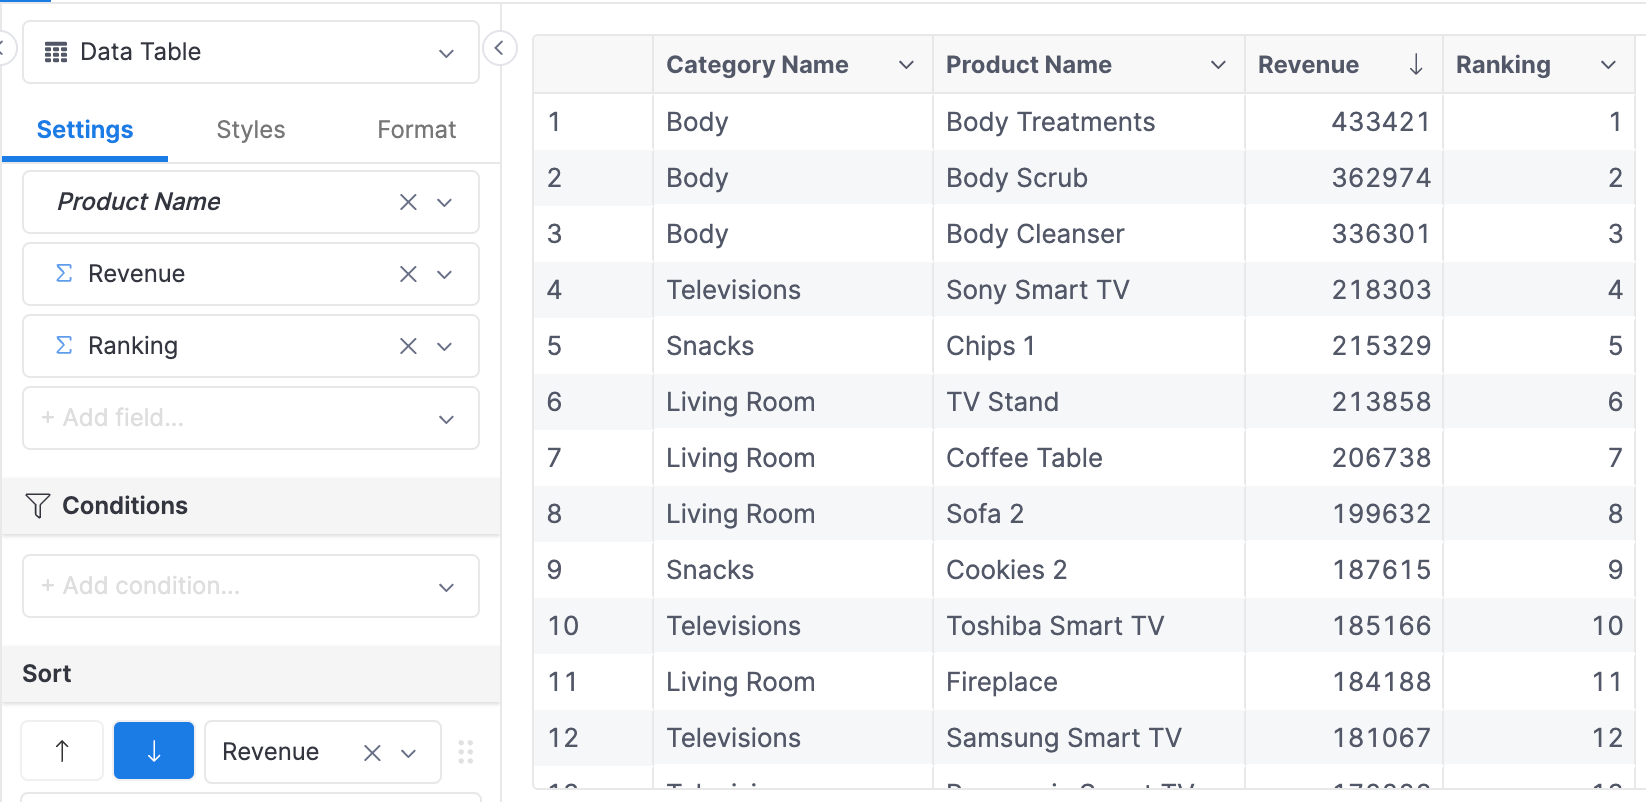
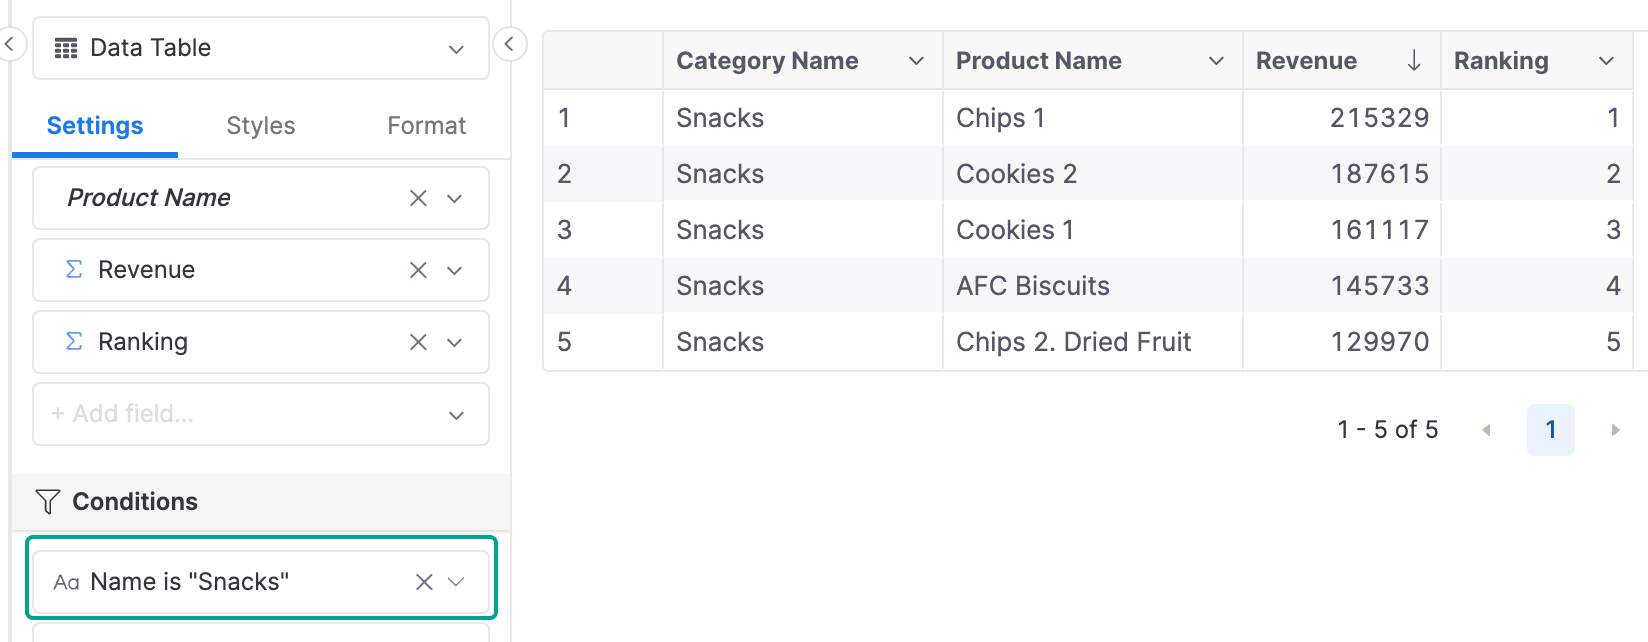
For example, without any filter, the product Chips 1 has rank 5, but when applying the filter Category Name is “Snack”, the ranking is re-calculated, and Chips 1 has rank 1.
- Without Filter
- With Filter
What if we want to display only Products in the Snacks category, but still retain their overall rankings? In this example, we will explore how to produce a Static Ranking that is unaffected by filters.
Setup
The only difference with the other examples is how we create the ranking field. In previous examples, the ranking fields are metrics, but in static ranking, the field will be a dimension.
- Initial Setup
- Final Setup
// order_items.model.aml
Model order_items.model.aml {
  ...
  dimension order_id {...}
  dimension product_id {...}
  dimension quantity {...}
}

// products.model.aml
Model products {
  ...
  dimension id {...}
  dimension price {...}
  dimension category_id {...}
}

// merchants.model.aml
Model merchants {
  ...
  dimension id {...}
  dimension name {...}
}

// categories.model.aml
Model categories {
  ...
  dimension id {...}
  dimension name {...}
}

// e_commerce.dataset.aml
Dataset e_commerce {
  ...
  models: [order_items, products, merchants]
  relationships: [
    relationship(order_items.product_id > products.id, true)
    relationship(products.merchant_id > merchants.id, true)
    relationship(products.category_id > categories.id, true)
  ]
}
  // order_items.model.aml
  Model order_items.model.aml {
    ...
    dimension order_id {...}
    dimension product_id {...}
    dimension quantity {...}
  }

  // products.model.aml
  Model products {
    ...
    dimension id {...}
    dimension price {...}
    dimension category_id {...}
  }

  // merchants.model.aml
  Model merchants {
    ...
    dimension id {...}
    dimension name {...}
  }

  // categories.model.aml
  Model categories {
    ...
    dimension id {...}
    dimension name {...}
  }

  // e_commerce.dataset.aml
  Dataset e_commerce {
    ...
    models: [order_items, products, merchants]
    relationships: [
      relationship(order_items.product_id > products.id, true)
      relationship(products.merchant_id > merchants.id, true)
      relationship(products.category_id > categories.id, true)
    ]

    metric revenue {
      label: 'Revenue'
      type: 'number'
      definition: @aql sum(order_items, order_items.quantity * products.price);;
    }

    dimension product_ranking_dim {
      label: 'Product Ranking (Dimension)'
      type: 'number'
      model: products
      definition: @aql  rank(order: revenue | dimensionalize(products.id) | desc());;
    }

  }
High-level Flow
- Create a Ranking dimension: Instead of creating a ranking as a metric, now we will define it as a dimension.
- Visualization: For this ranking metric with partition to work, we will need to include the partition field (Category Name) field in the visualization.
Implementation
1. Create a Ranking Dimension
We will reuse the revenue metric in the dataset as the basis for the ranking. Then, we define the product_ranking_dim dimension in the dataset file, but specify that this dimension belongs to the products model.
Dataset e_commerce {
  ...
  metric revenue {
    label: 'Revenue'
    type: 'number'
    definition: @aql sum(order_items, order_items.quantity * products.price);;
  }

  dimension product_ranking_dim {
    label: 'Product Ranking (Dimension)'
    type: 'number'
    model: products
    definition: @aql  rank(order: revenue | dimensionalize(products.id) | desc());;
  }
}
For more details about this process of dimensionalize a metric, please refer to our dimensionalize doc.
2. Visualization
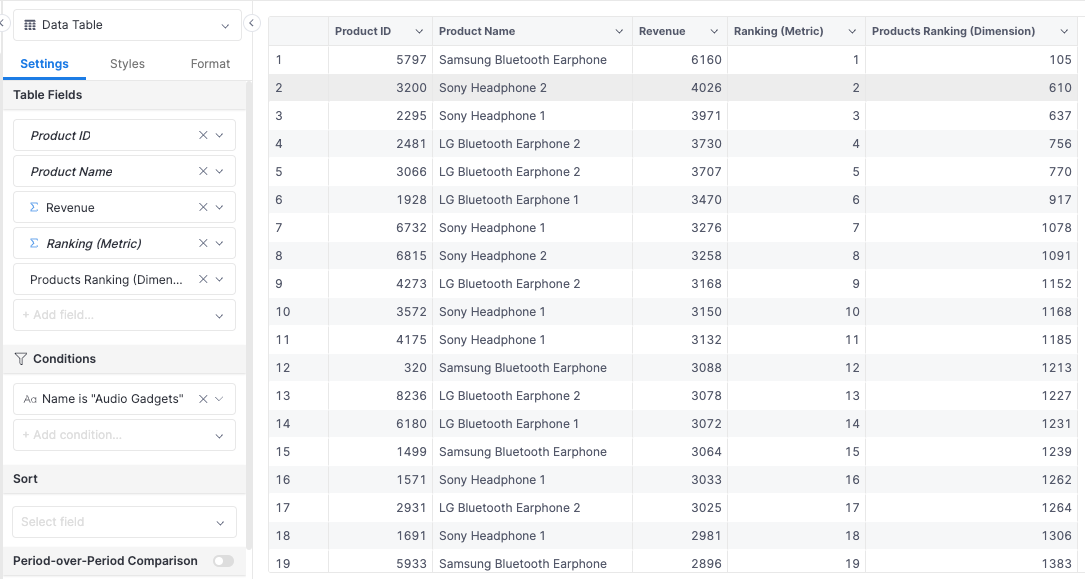
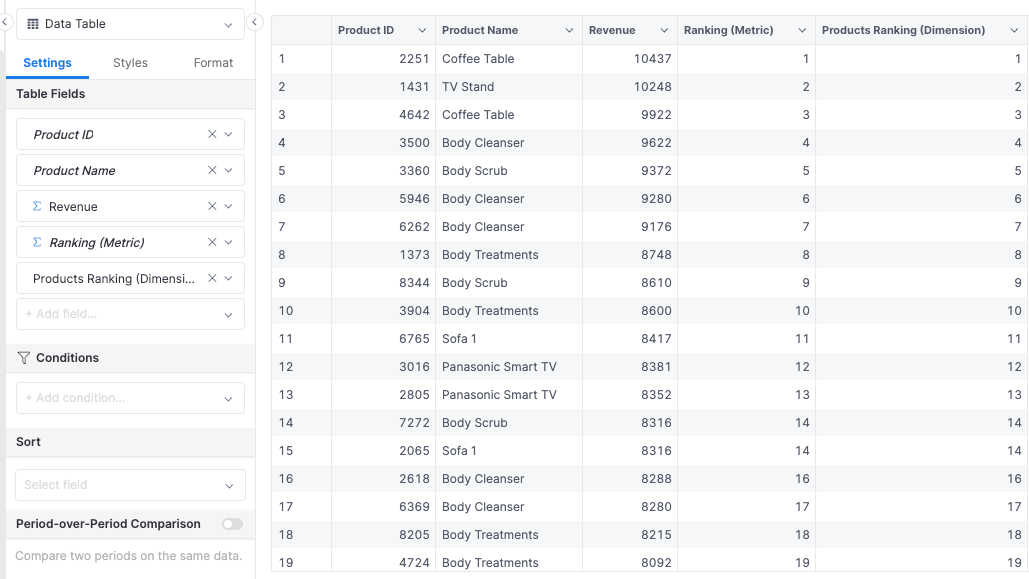
To compare the result created by the ranking metric and dimension, we will use the following fields: Product ID, Product Name, Ranking, Product Ranking (Dimension). Without any filtering, the two return the same ranking values:
Now if we add Category Name is “Audio Gadget” filter, we can see that the Ranking metric’s values are re-calculated, while the Product Ranking dimension’s values are maintained. There are gaps between the values because products of other categories have been removed from the visualization.
