Create Cohort Retention
A grasp of these concepts will help you understand this documentation better:
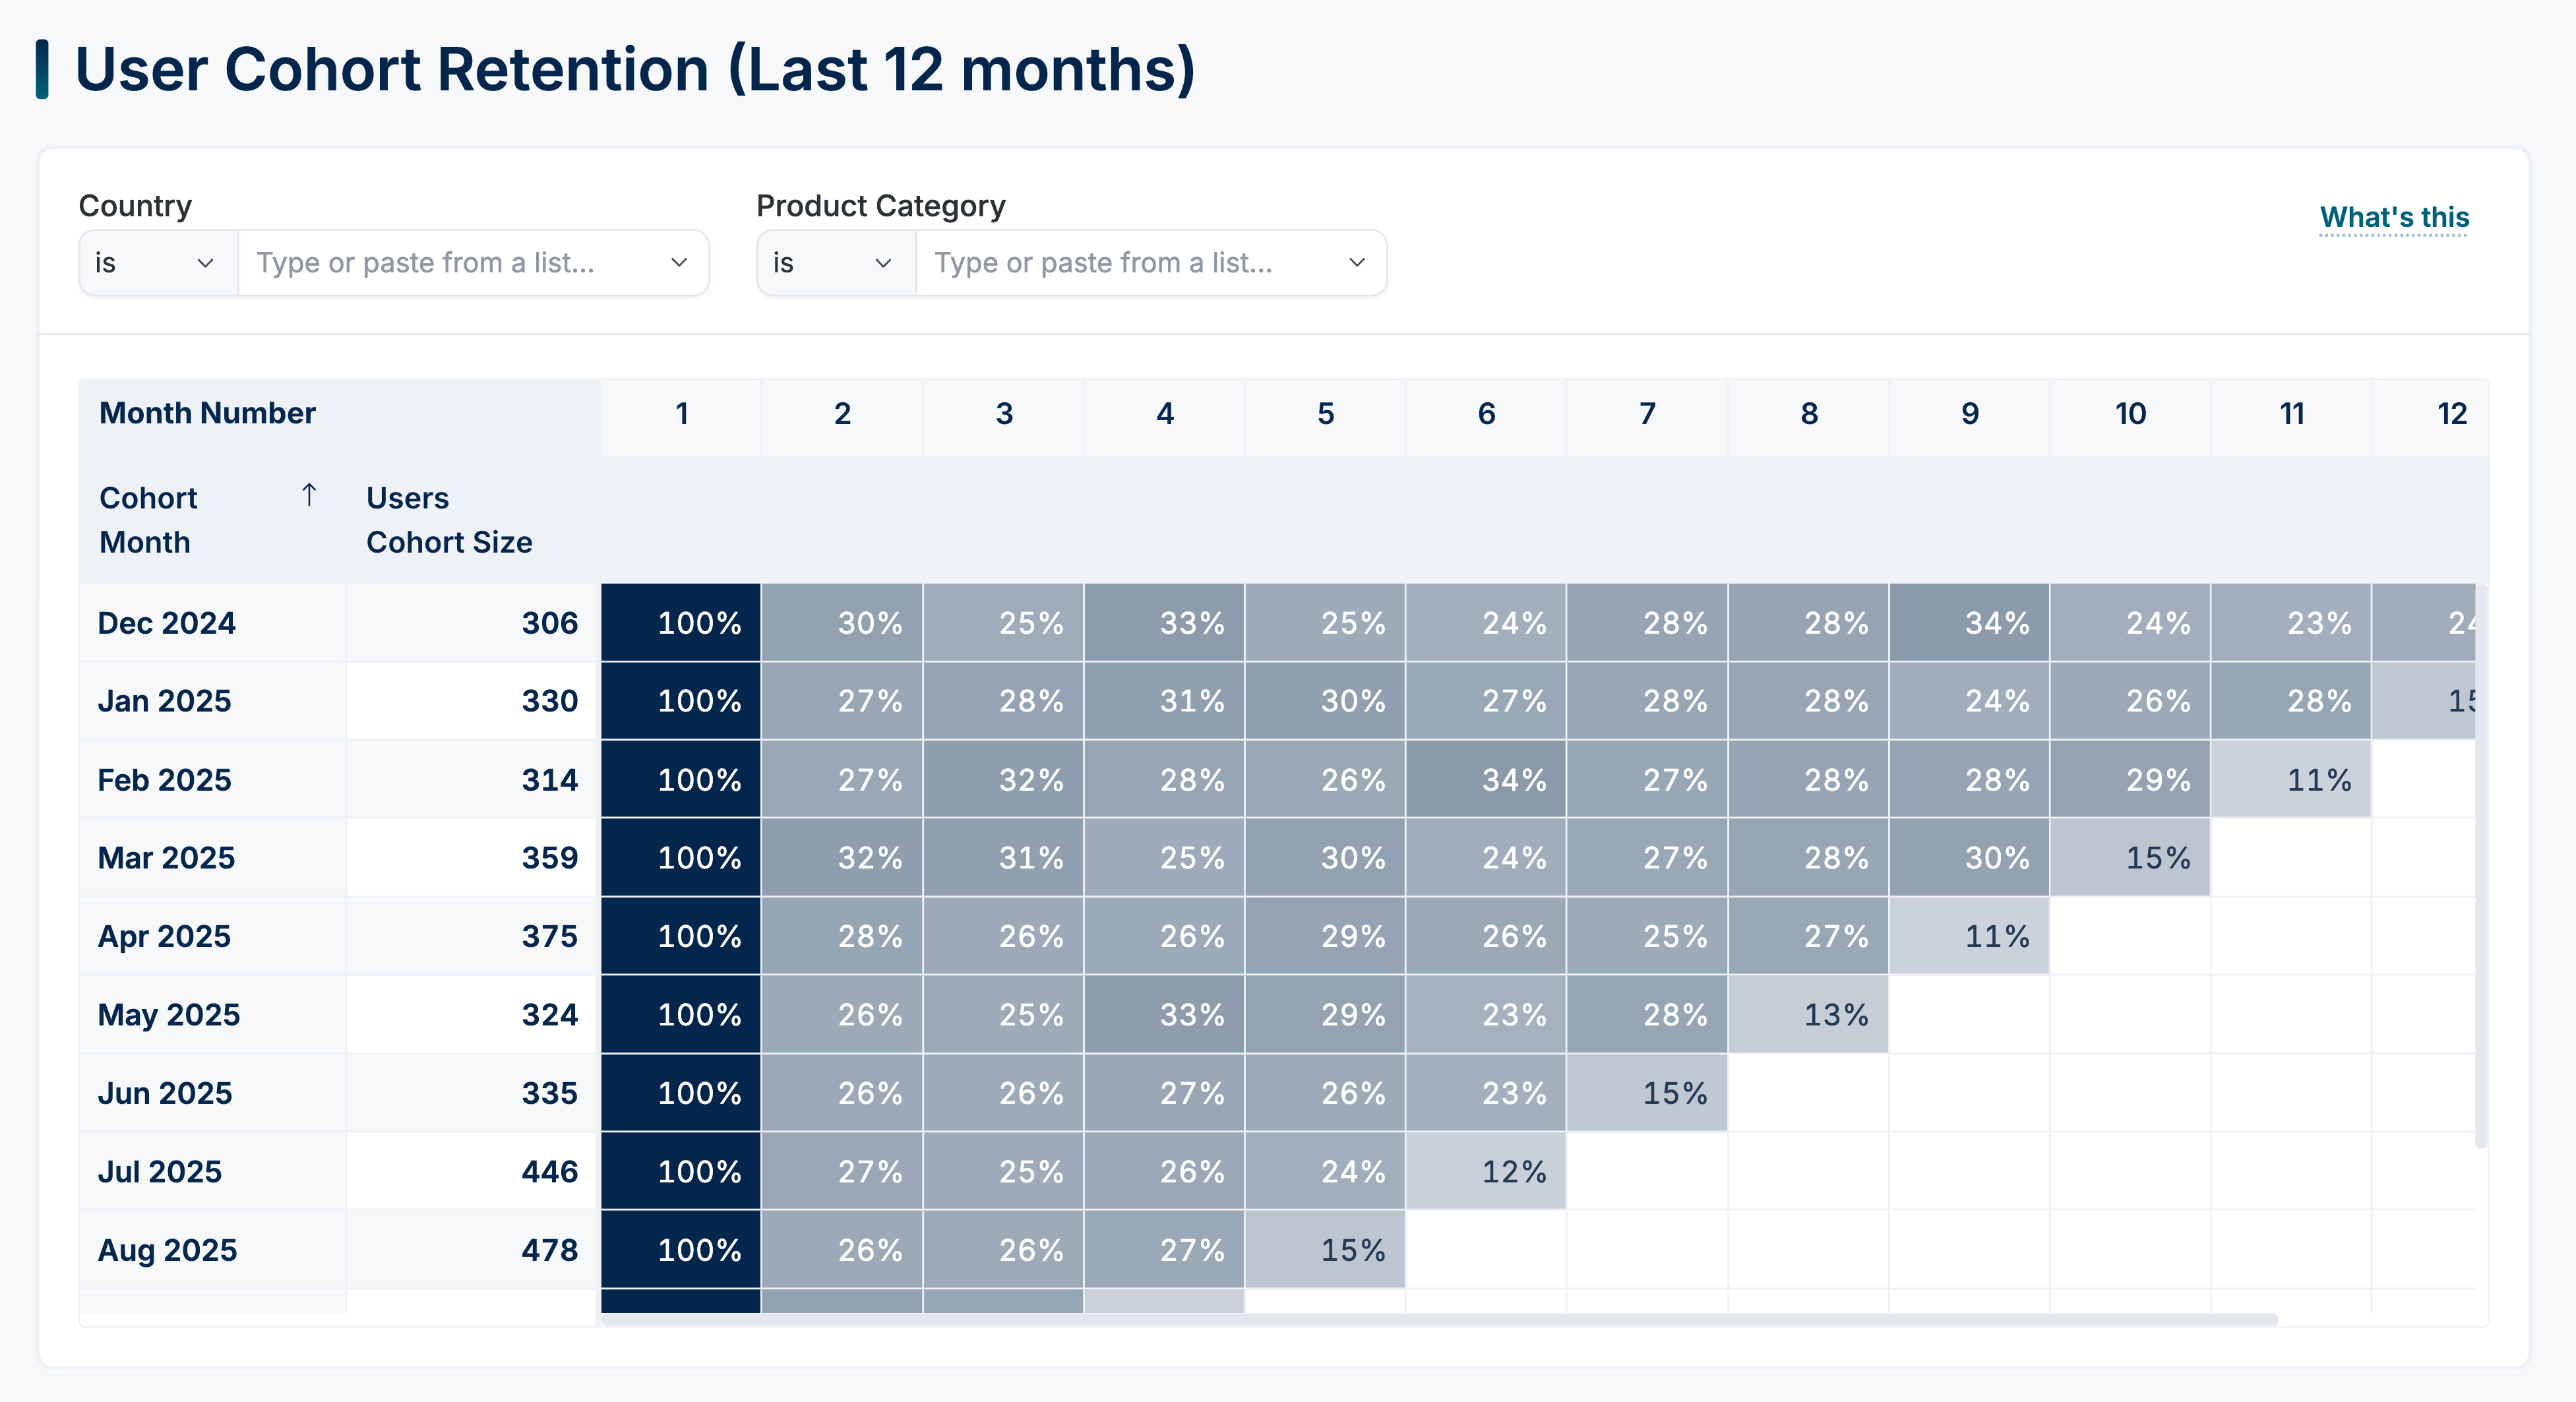
We support multiple ways to build a retention heatmap. Here's a quick comparison to help you pick the right one:
| Option | Custom colors | Auto color scale* | Maintenance |
|---|---|---|---|
| Built-in, legacy Retention Heatmap | No | Yes | Low — built-in visualization |
| Pivot Table with conditional formatting (this page, recommended) | Yes | Coming soon | Low — built-in visualization |
| Dynamic Content Block | Yes | Yes | Higher — you maintain the HTML/CSS yourself |
(*) Auto color scale: Color intensity adjusts automatically to the current data range. Without it, a heatmap built for a max of 1,000 will look washed out when a user's data only goes up to 80, or when a time filter reduces the range.
Introduction
Cohort Retention Analysis analyzes the continued engagement of specific user groups over time, helping businesses understand and improve customer loyalty and long-term user activity.
We will provide a step-by-step walkthrough on how to build a report in Holistics that demonstrates the classic cohort retention.
Setup
In order to gain insights into the lifetime value of groups of users who were acquired for each particular period of time, our objective is to define and analyze Acquisition Cohorts.
For this tutorial, we will be using an e-commerce dataset that consists of two models: orders and users.
Before diving into the implementation, let's take a quick look at our dataset setup.
- Initial Setup
- Final Setup
// orders.model.aml
Model orders {
  ...
  dimension id {...}
  dimension user_id {}
  dimension created_at {}
}
// users.model.aml
Model users {
  ...
  dimension id {...}
  dimension name {...}
}

// e_commerce.dataset.aml
Dataset e_commerce {
  ...
  models: [orders, users]
  relationships: [
    relationship(orders.user_id > users.id, true)
  ]

}
// orders.model.aml
Model orders {
  ...
  dimension id {...}
  dimension user_id {}
  dimension created_at {}
}
// users.model.aml
Model users {
  ...
  dimension id {...}
  dimension name {...}
}

// e_commerce.dataset.aml
Dataset e_commerce {
  ...
  models: [orders, users]
  relationships: [
    relationship(orders.user_id > users.id, true)
  ]

  // Define the Cohort
  dimension acquisition_month_cohort {
    model: users
    type: 'date'
    label: 'Acquisition Month Cohort'
    definition: @aql min(orders.created_at | month()) | dimensionalize(users.id);;
  }

  // Calculate the Total Users are in this Cohort
  metric total_users {
    label: "Untitled metric"
    type: "number"
    definition: @aql count(users.id);;
  }

  // Define the Month Number
  dimension month_no {
    model: orders
    label: 'Month Number'
    type: 'number'
    definition: @aql date_diff('month', orders.cohort_month, orders.created_at | month());;
  }

  // How many users of the cohort are still active in consecutive months
  metric retention {
    label: 'Retention'
    type: 'number'
    definition: @aql (total_users*1.0) / (total_users | of_all(orders.month_no));;
  }
}
Sample data

High-level flow
- Define Acquisition Cohort: Determine the period and timeframe when each customer was acquired. This period could be daily, monthly, yearly, or any other suitable duration based on your business needs.
- Define the metric: Define the metric you want to observe for each cohort
- Define the retention logic: How many users of the cohort are still active in subsequent months
Implementation
1. Define Acquisition Cohort
Let’s define the acquisition cohort as the month that users made their first purchase.
Since 1 user can make multiple purchases on different days, to find each user's first order date, obtain the earliest order created date (in the Orders model) and dimensionalize it by associating it with the User ID in the Users model. This can be done by using min() function and dimensionalize().
Dataset e_commerce {
  (...)

  dimension acquisition_month_cohort {
    model: users
    type: 'date'
    label: 'Acquisition Month Cohort'
    definition: @aql min(orders.created_at | month()) | dimensionalize(users.id);;
  }
}

2. Define the Metrics (or the Cohort Size)
You will then be able to find out how many users in the Acquisition Cohort.
First, calculate the Total Number of Users by simply using count() function.
Dataset e_commerce {
  (...)

  dimension acquisition_month_cohort {...}

  metric total_users {
    label: 'Total Users'
    type: 'number'
    definition: @aql count(users.id);;
  }

}
And then, to find out how many users are in this Acquisition Cohort, you will use the combination of dimension Acquisition Month Cohort with the metric Total Users

3. Define the retention logic
What is considered retention:
- If first-time user A made an order on Week 1, and returns to buy more stuffs the next weeks, she is a returned user.
- If user B also made an order on Week 1 and does not return the following weeks, she's a bounced user, that basically means you lose her as a user.
First, calculate the Month since Acquisition by using the date_diff() function.
This dimension is necessary to determine how many users from a specific acquisition cohort return in subsequent months.
Dataset e_commerce {
  (...)

  dimension acquisition_month_cohort {...}

  metric total_users {...}

  dimension month_no {
    model: orders
    label: 'Month Number'
    type: 'number'
    definition: @aql date_diff('month', users.acquisition_month_cohort, (orders.created_at | month()));;
  }

}
This can be best illustrated by using Pivot Table where
- The Row is the Dimension
Acquisition Month Cohort - The Column is the Dimension
Month Number - The Values is the Metric
Total Users

Month Number 0 represents the Cohort Size, which calculates the total number of users who made their first purchase in the Acquisition Month Cohort.
Month Numbers 1, 2, and 3 show how many users from that cohort continue to make purchases in the subsequent months 1, 2, and 3, respectively.
Finally, create a retention metric to measure the percentage of total users retained in each acquisition cohort for each month.
Dataset e_commerce {
  (...)

  dimension acquisition_month_cohort {...}

  metric total_users {...}

  dimension month_no {...}

  metric retention {
    label: 'Retention'
    type: 'number'
    definition: @aql (total_users*1.0) / (total_users | of_all(orders.month_no));;
  }

}

We have covered all the foundational concepts required to calculate metrics for the acquisition cohort, and you are now equipped to create even more powerful cohort analysis reports to present to your stakeholders in Holistics.