Cohort Retention
This is a legacy built-in chart. We recommend switching to the AQL Cohort Retention approach for better flexibility and more styling options.
We support multiple ways to build a retention heatmap. Here's a quick comparison to help you pick the right one:
| Option | Custom colors | Auto color scale* | Maintenance |
|---|---|---|---|
| Built-in, legacy Retention Heatmap (this page) | No | Yes | Low -- built-in visualization |
| Pivot Table with conditional formatting (recommended) | Yes | Coming soon | Low -- built-in visualization |
| Dynamic Content Block | Yes | Yes | Higher -- you maintain the HTML/CSS yourself |
(*) Auto color scale: Color intensity adjusts automatically to the current data range. Without it, a heatmap built for a max of 1,000 will look washed out when a user's data only goes up to 80, or when a time filter reduces the range.
Introduction
Cohort Retention measures how well a business retains its users over time. Two concepts to know:
- Cohort: A group of users who share a common starting point, like signup month. For example: users who first purchased in September 2021.
- Retention: How many of those users come back. If 100 users sign up but only 20 return the next month, your retention rate is 20%.
The most common way to visualize this is a heatmap. Rows represent cohorts, columns represent time elapsed, and cell colors reflect retention rates, making it easy to spot trends at a glance.

Create a built-in retention heatmap
High-level approach
There are 2 main steps involved in building a cohort retention using Holistics:
- Transform your raw data (input data) into the required format
- Visualize the transformed data using Holistics' built-in cohort retention chart
Step-by-step guide
Let's say we want to build a cohort retention chart for our e-commerce orders.
First, we need a simple raw data table orders that contains the following fields:
id: order iduser_id: ID of the usercreated_at: when the order is made
Then, we transform it into a table with these columns:
- Cohort month: The month a user made their first purchase (e.g., Sep 2019)
- Cohort size: Total number of users in that cohort
- Month number: How many months have passed since the user's first purchase (0 = first month, 1 = next month, etc.)
- Number of users: How many users from that cohort came back in that specific month

Here's a diagram of the transformation process. We need to build 4 query models that feed into each other:

Step 1: Define cohorts
Create a query model cohort_dfn (user_id, cohort_month) to group our cohorts based on the month in which they made their first purchase.
// Cohort defined by first order => Output: user_id, cohort_month

Model cohort_dfn {
  type: 'query'
  dimension user_id {
    type: 'number'
  }
  dimension cohort_month {
    type: 'date'
  }
  query: @sql
    select
      {{#o.user_id}},
      date_trunc('month', min({{#o.created_at}}))::date as cohort_month
    from {{#orders as o}}
    group by 1
	;;
 }
Step 2: Calculate cohort size
Create a new query model cohort_size (cohort_month, total_users) to count how many users are in each cohort.
// Cohort size defined by number of users in the cohort
// Output: cohort_month, total_users

Model cohort_size {
   type: 'query'
   dimension cohort_month {
     type: 'date'
   }
   dimension total_users {
     type: 'number'
   }
   query: @sql
     select {{#c.cohort_month}}
		        , count(distinct({{ #c.user_id }})) as total_users
     from {{#cohort_dfn as c}}
     group by 1
   ;;
 }
Step 3: Calculate activity by user by month
Create a 3rd query model retention_by_user_by_month (user_id, month_number) that indicates if user X has made a purchase in month Y.
month_number is an integer denoting the number of months since the user's cohort month. For example:
- User X belongs to cohort Sep 2019
- X makes a repeat purchase on Nov 2019
- There will be a record
(X, 2): 2 months between September and November
A sample table would look like:
| user | month_number |
| Alex | 0            |
| Alex | 1            |
| Bob  | 0            |
| Bob  | 2            |
// Months between the user's acquisition date and their order date
// Output: user_id, month_number

Model retention_by_user_by_month {
  type: 'query'
  dimension user_id {
	  type: 'number'
  }
  dimension month_number {
	  type: 'number'
  }
  query: @sql
    select
      {{#o.user_id}},
      ((date_part('year', {{#o.created_at}}::date) - date_part('year', {{#c.cohort_month}}::date)) * 12 +
        (date_part('month', {{#o.created_at}}::date) - date_part('month', {{#c.cohort_month}}::date))) as month_number
    from {{#orders as o}}
		left join {{#cohort_dfn as c}} on {{#o.user_id}} = {{#c.user_id}}
	;;
}
Step 4: Aggregate into final retention data
From the data in step 3, aggregate them and build the 4th query model cohort_retention (cohort_month, month_number, num_users). This indicates how many users in cohort X make purchases in month number Y.

// cohort_month, month_number, num_users
Model cohort_retention {
   type: 'query'
   dimension cohort_month {
	   type: 'date'
   }
   dimension month_number {
	   type: 'text'
		 definition: @sql concat('Month ', to_char({{ #SOURCE.month_number}}, 'fm00'));;
   }
   dimension num_users {
    type: 'number'
   }
   query: @sql
    select {{#c.cohort_month}}
        , {{#r.month_number}}
        , count(distinct({{#r.user_id}})) as num_users
    from {{#retention_by_user_by_month as r}}
        left join {{#cohort_dfn as c}} on {{#r.user_id}} = {{#c.user_id}}
		group by 1,2
		;;
}
Step 5: Create the dataset
Create a new dataset cohort that joins cohort_size and cohort_retention with a 1-n relationship on cohort_month. This is required to create the retention heatmap.

import '../models/cohort/cohort_retention.model.aml' {
  cohort_retention
}
import '../models/cohort/cohort_size.model.aml' {
  cohort_size
}
Dataset cohort {
  models: [
    cohort_retention,
    cohort_size,
  ]
  relationships: [
    rel(rel_expr: cohort_retention.cohort_month > cohort_size.cohort_month, active: true)
  ]
}
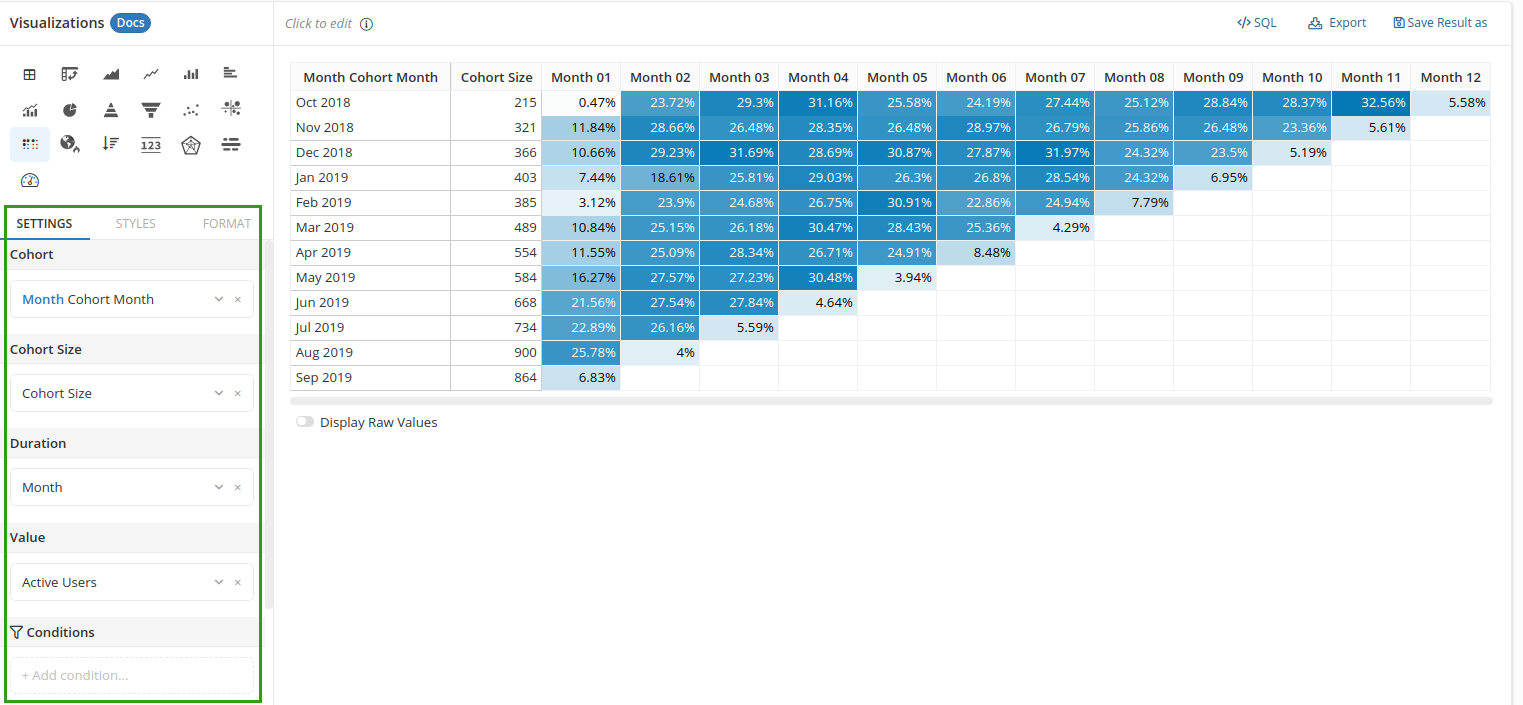
Final step: Build the chart
Go to Reporting, choose the Retention Heatmap visualization, and drag the fields into each slot.
Order your Duration column
The variable you use for Duration will always be converted into string type, and your columns will be in alphabetical order.
For example, your Duration variable is "Month name" whose values are:
'Jan 2019', 'Feb 2019', 'Mar 2019', 'Apr 2019'...
The columns will appear in the alphabetical order, which is not exactly what you want:
'Apr 2019', 'Feb 2019', 'Jan 2019', 'Mar 2019'...
To have your columns in your desired order, instead of using the month names, you can use the month's numerical representation:
'2019-01', '2019-02', '2019-03', '2019-04'...
In case your Duration column is of numeric type, you will need to create a custom dimension to prepend zeroes to your variable. In other words, you will need to turn your variable from this:
1, 2, 3, 4, ..., 10, 11, ...
To this:
'01', '02', '03', '04', ..., '10', '11', ...