Understand Custom Chart
This document walks you through the components of a custom chart definition and how they work together at runtime.
High-level structure
A custom chart definition combines Vega or Vega-lite specifications with Holistics's own syntax on top:
-
Holistics's specifications: a small set of syntax that defines how end-users interact with the chart through the Data Exploration view. This includes:
- Field definition: maps your dataset's fields to Vega chart axes and dimensions.
- Option definition: maps Holistics styling options to Vega chart styling properties.
-
Vega/Vega-lite specifications: defines how the visualization looks. For more details, see Template definition.
For example, a simple bar chart definition using Vega-lite:
CustomChartDef bar_chart {
  label: 'Bar Chart'

  // === Holistics's specifications ===
  // Field definition
  fields {
    field x {
      type: "dimension"
      label: "Category"
    }
  }

  // Option definition
  options {
    option tooltip {
      type: "toggle"
      label: "Show tooltip"
      default_value: true
    }
  }

  // === Vega-lite specifications ===
  template: @vgl {
    "data": {"values": @{values}},

    "mark": {
        "type": "bar",
        "tooltip": @{options.tooltip.value},   // receive tooltip value (true/false) from 'options' object
    },

    "encoding": {
        "x": {"bin": true, "field": @{fields.x.name},},  // receive field name from 'fields.x' object
        "y": {"aggregate": "count"}
    }
  };;
}
Below is a visual guide showing how each component in the definition will appear in the Data Exploration view:

In the following sections, we will go deeper into each component.
Field definition
This component is written in Holistics Syntax, and it is where you define how your dataset fields map to Vega chart's axes and dimensions. Holistics will read these configurations and prepare the field input boxes in the Data Exploration view.
In the example below, we have defined two fields. They will appear as two field input boxes in the Visualization's Setting tab:
fields {
  field a {
    type: "dimension"
    label: "This is the label of the first field"
  },

  field b {
    type: "measure"
    label: "This is the label of the second field"
  }
}

For more information about fields object's properties, please refer to the Field Properties doc.
Option definition
This is written in Holistics Syntax. This is where you define the styling options your chart accepts, such as tooltip visibility, goal line value or histogram bin size customization, etc. These options can be found in Styles tab in Data Exploration view.
For example, you want to give users the option to toggle on/off tooltip. Your Tooltip Option could look something like below:
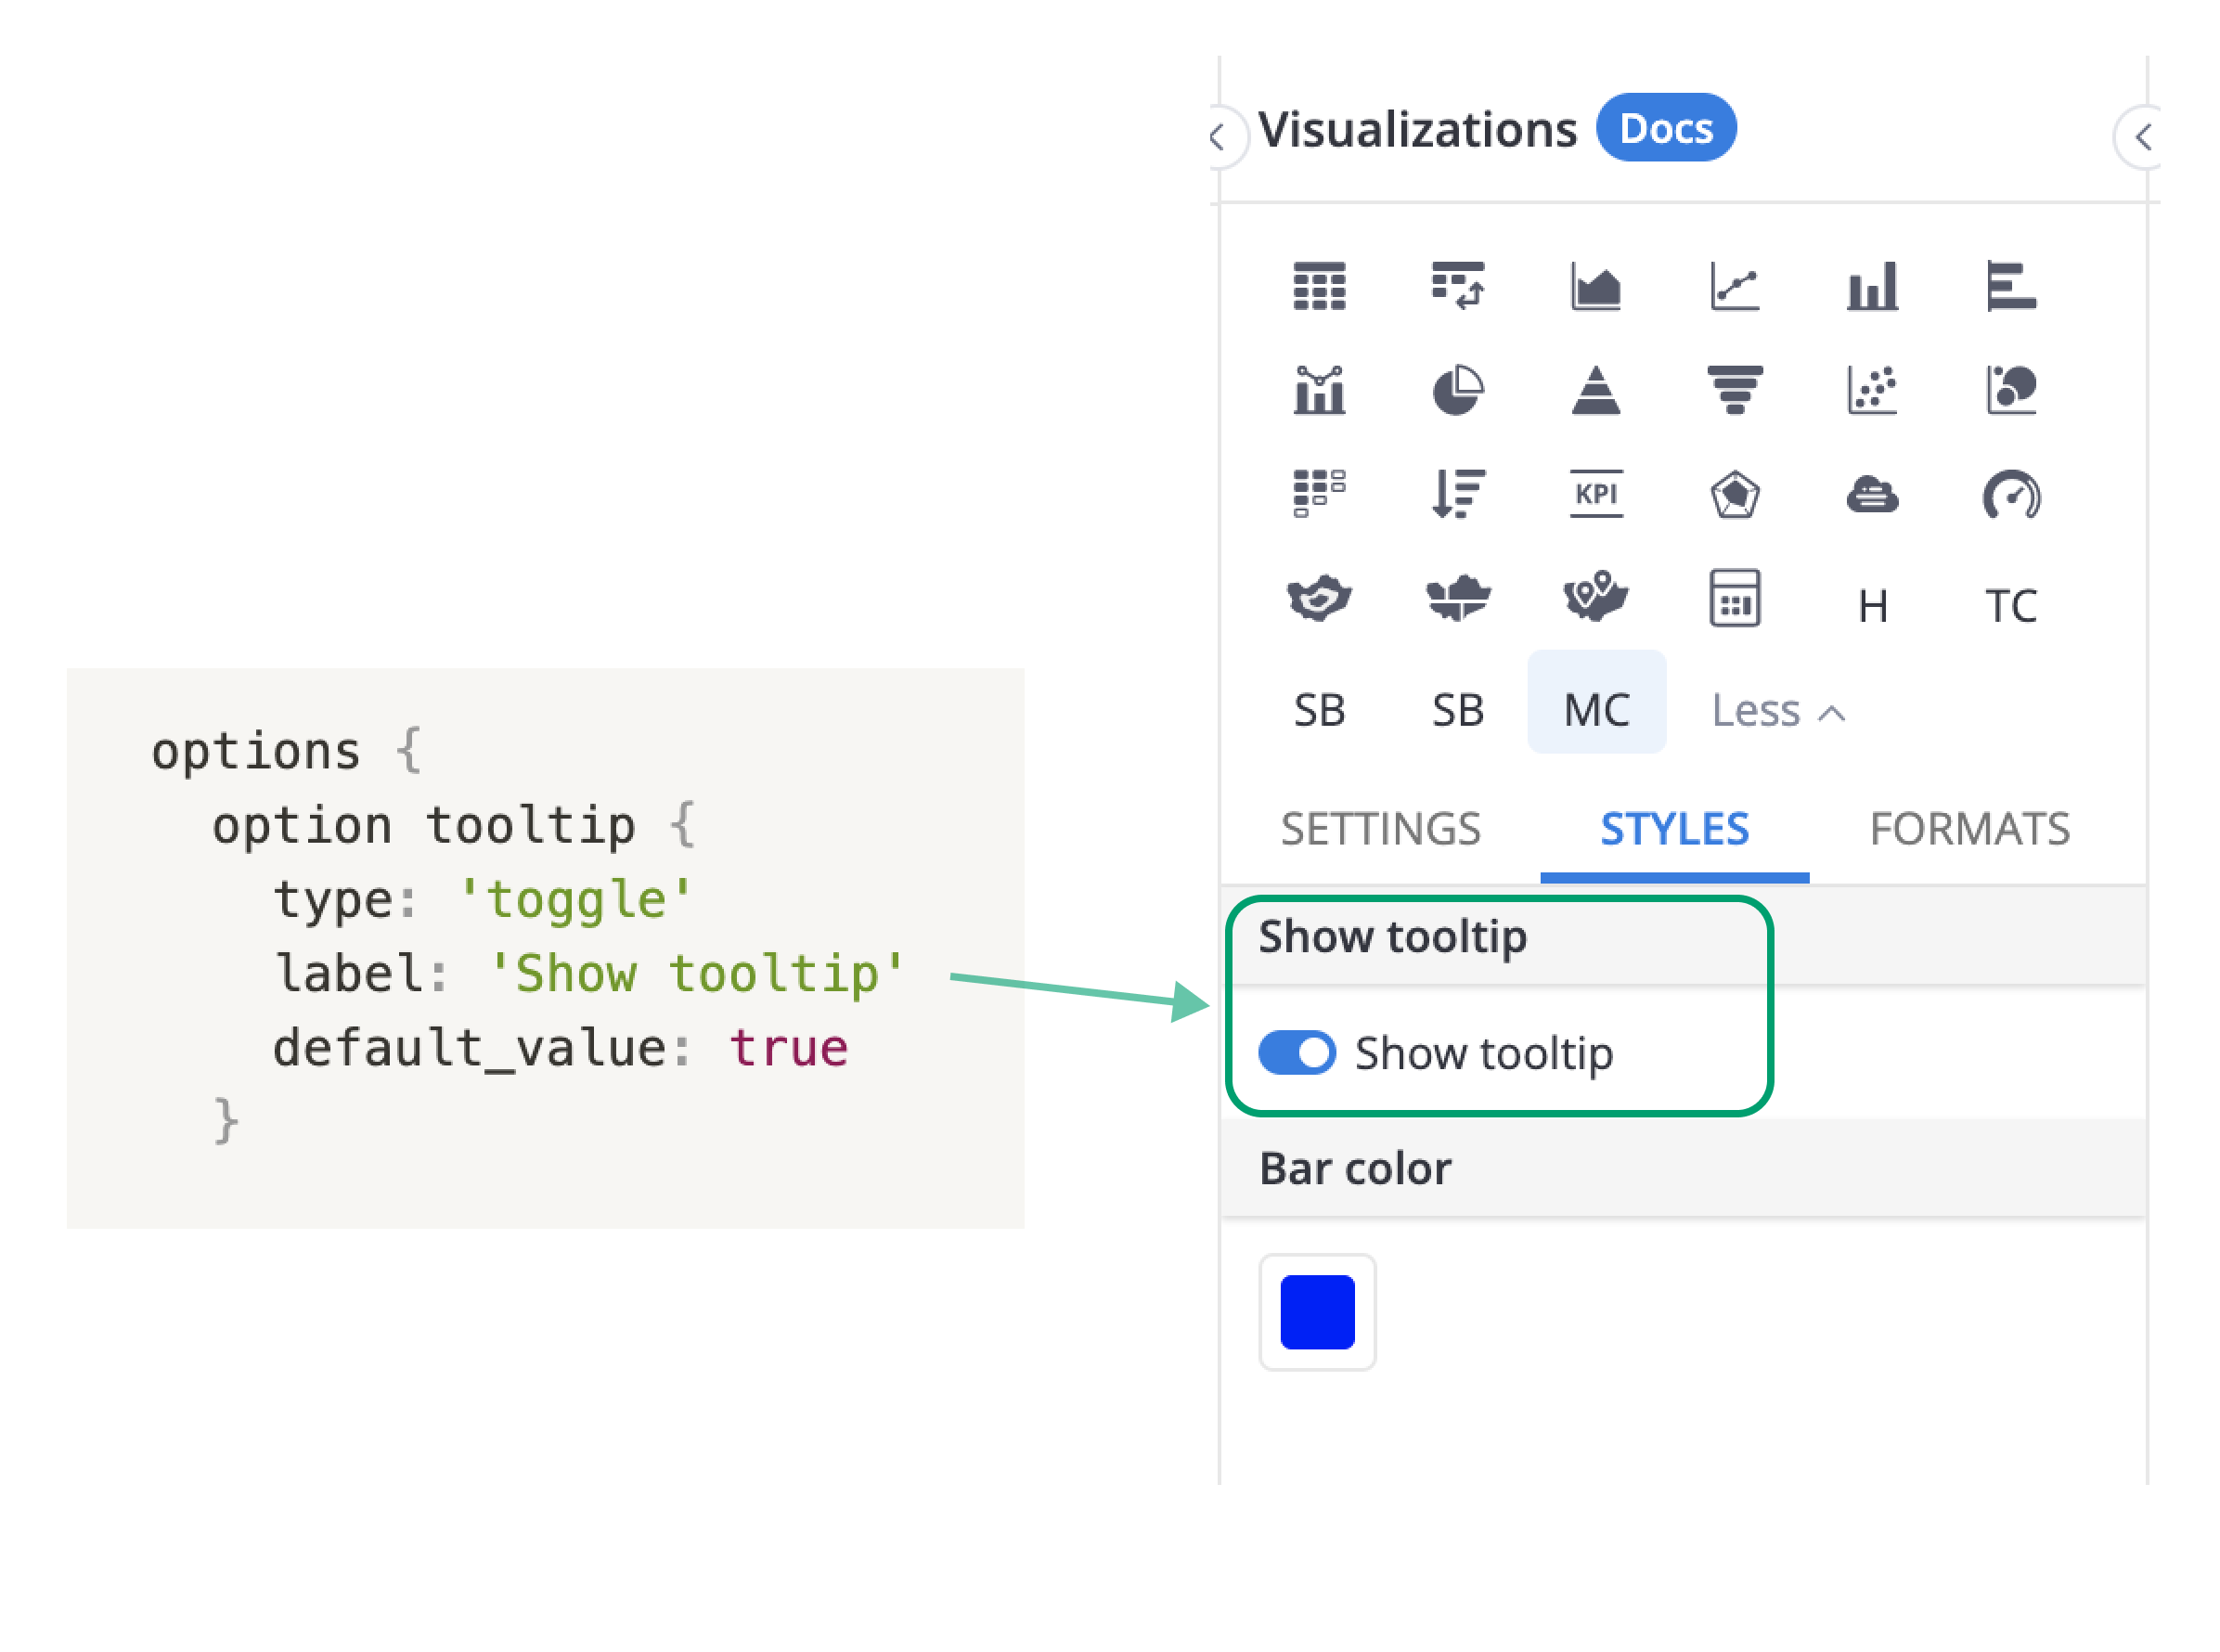
For more information about option object's properties, please refer to the Option Properties doc.
Chart template definition
This is written using Vega-lite syntax (template: @vgl) or Vega syntax (template: @vg). This dictates the visualization properties, such as the shapes to be used (bars, points, lines,...), which field is mapped to the X/Y axis, or styling details like line thickness, colors etc...
The examples in this doc use Vega-lite (@vgl). If you prefer Vega, use @vg instead, but note that the chart template structure will differ. Refer to the official Vega documentation for details.
A Vega-lite chart is defined with three required properties:
data: specifies the data source of the chartmark: specifies the shapes that you want to use and their stylesencoding: specifies the mapping between user-input fields and chart's dimensions
Other than these required properties, you can specify how end-users can interact with your chart using Vega-lite's params, and Holistics's holisticsConfig property.
For a full reference, check the official Vega-lite documentation. If you just need a quick refresher on how properties work within Holistics, see Vega-lite Properties.
How Custom Chart works
Normally when defining a Vega-lite chart, the user needs to hard-code every detail of the chart before rendering it. For example, the data source of a chart must be a pre-defined JSON object, or a link to an external data file.

Open the Chart in the Vega Editor
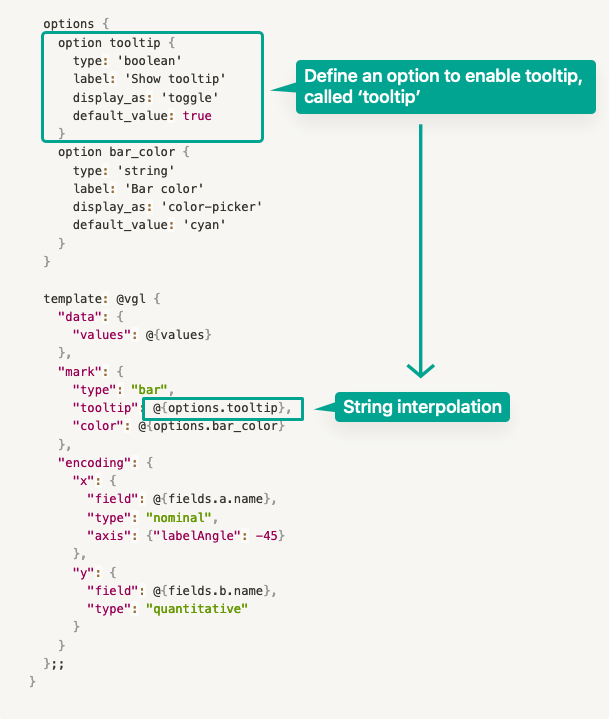
However, in Holistics, the Vega-lite component receives values from the declared fields and options objects, so that charts can be created dynamically when users drag in a dataset field, or toggle a styling option in the Data Exploration view.
This feature is enabled by string interpolation. For example, we have a custom chart definition as below:
CustomChartDef bar_chart {
  label: 'Bar Chart'

  fields {
    field a {
      type: "dimension"
      label: "Dimension Field"  // label of the field input's box in Data Exploration view
      sort {apply_order: 1 direction: "asc"}
    }
    field b {
      type: "measure"    // dataset fields put here will be aggregated
      label: "Measure Field"
      sort {apply_order: 2 direction: "desc"}
    }
  }

  options {
    option tooltip {
      type: 'toggle'
      label: 'Show tooltip'
      default_value: true
    }
  }

  template: @vgl {
    "data": {
      "values": @{values}
    },

    "mark": {
      "type": "bar",
      "tooltip": @{options.tooltip.value},
    },

    "encoding": {
      "x": {
        "field": @{fields.a.name},
        "type": "temporal",
      },
      "y": {
        "field": @{fields.b.name},
        "type": "quantitative"
        }
      }
  };;
}
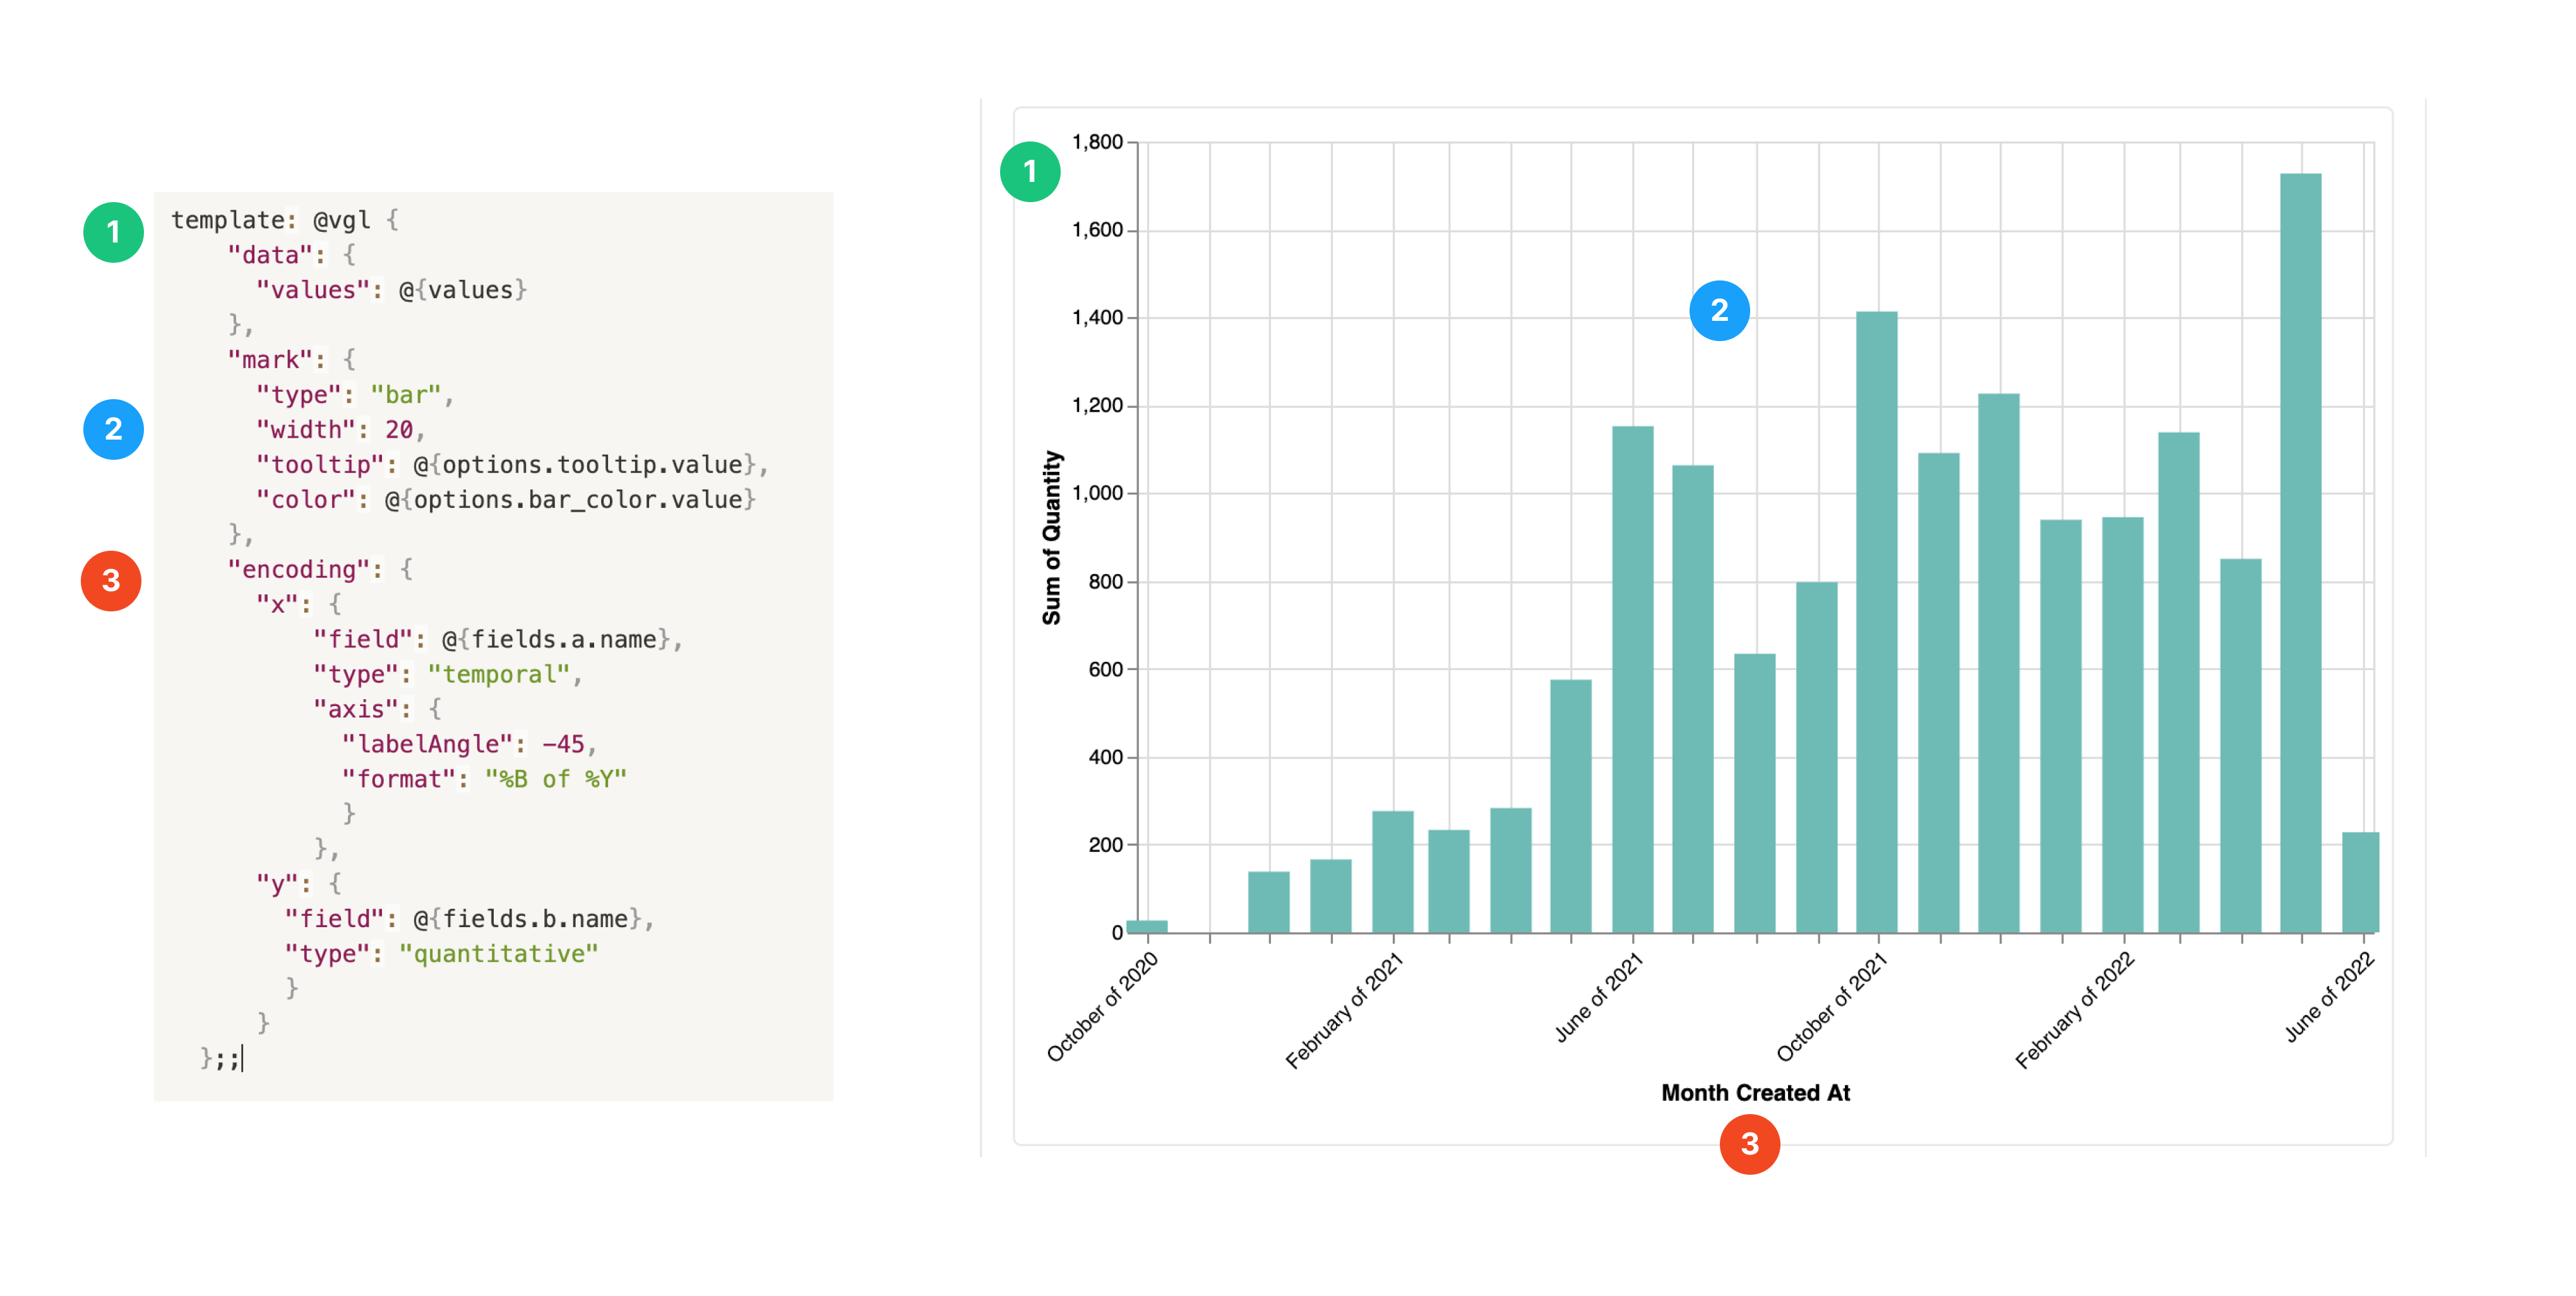
Suppose the user drags Created_at field into Dimension Field and Revenue field into Measure Field, and click Get Result. During runtime, the following things will happen:
- Holistics's engine queries the database according to the field combinations, and return the data. This data is inserted into the
valuesproperty. - Metadata of the fields such as name, data type, format... are passed into the designated places
- Value
true/falsereturned by toggling the Show tooltip option in the Styles tab will also be passed in.
After that, a complete Vega-lite chart definition will be compiled:
// Compiled Vega-lite chart definition
{
  "data": {
    "values": [
      {"a": "01/01/2022", "b": 28},
      {"a": "01/02/2022", "b": 55},
      {"a": "01/03/2022", "b": 43},
    ]
  },

  fields: {
    a: {
      name: "Created_at"      // value of @{fields.a.name} is passed in here
      type: "temporal"
    }

    b: {
      name: "Sum of Revenue"     // because the field is aggregated
      type: "quantitative"
    }
  },

  options: {
    tooltip: {
      value: true    // @{options.tooltip.value} returned `true` and is passed in here
    },
  }
}
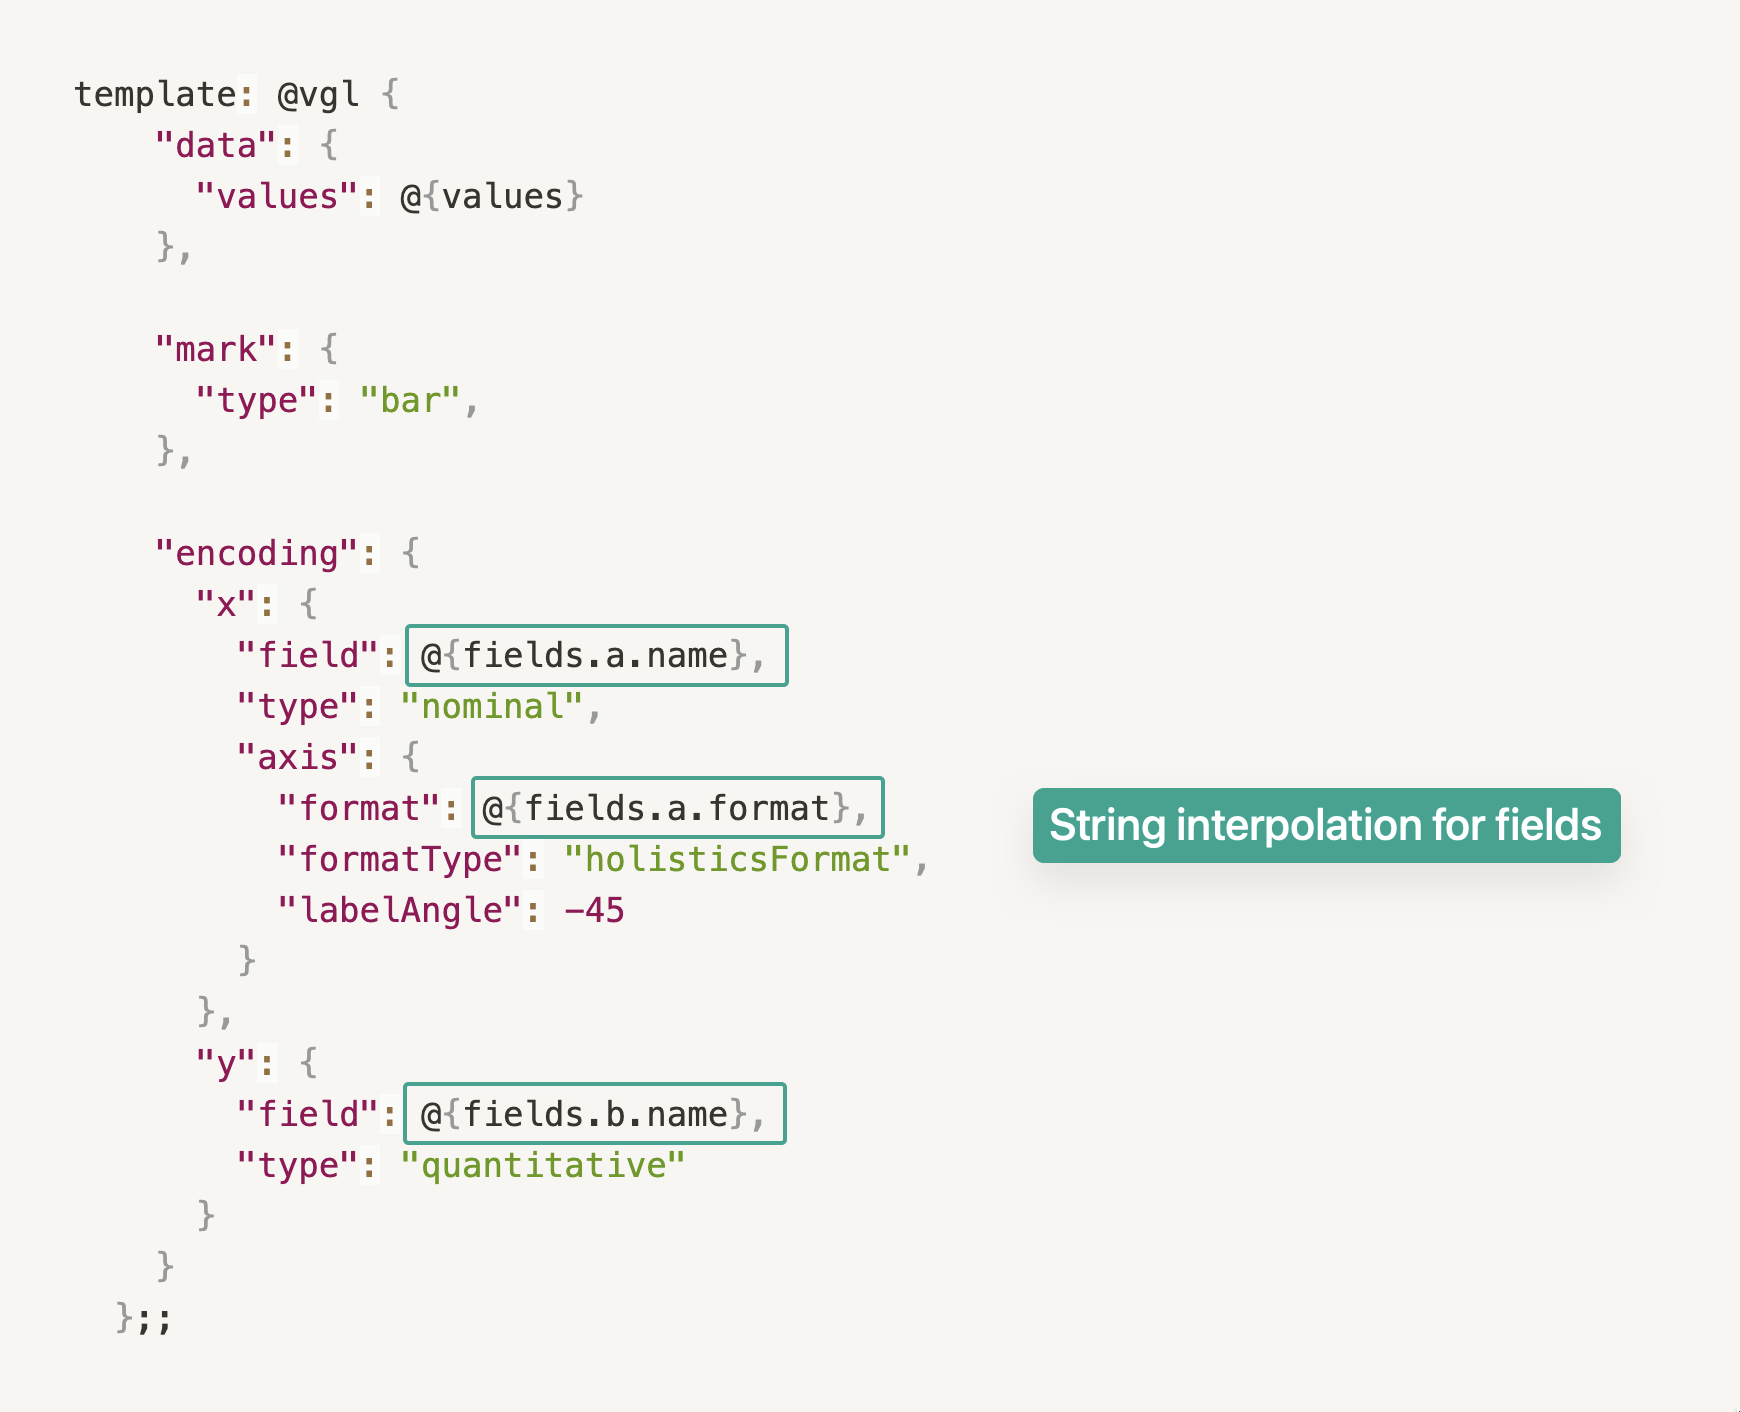
Reference syntax and string interpolation
To reference a property of a declared object and pass its value into the Vega-lite chart template, we use dot notation and string interpolation syntax:
@{object.object_name.object_property}
For example, to interpolate the name of a dataset field being dragged into field a (Dimension Field) into the chart template: @{fields.a.name}
Similar to field reference, to pass the value of an option to Vega-lite chart: @{options.option_name}
Legacy custom chart definition
Before as-code support, custom charts used a CustomChart block defined through Admin Settings > Custom Chart. Only admins can create or manage them there.
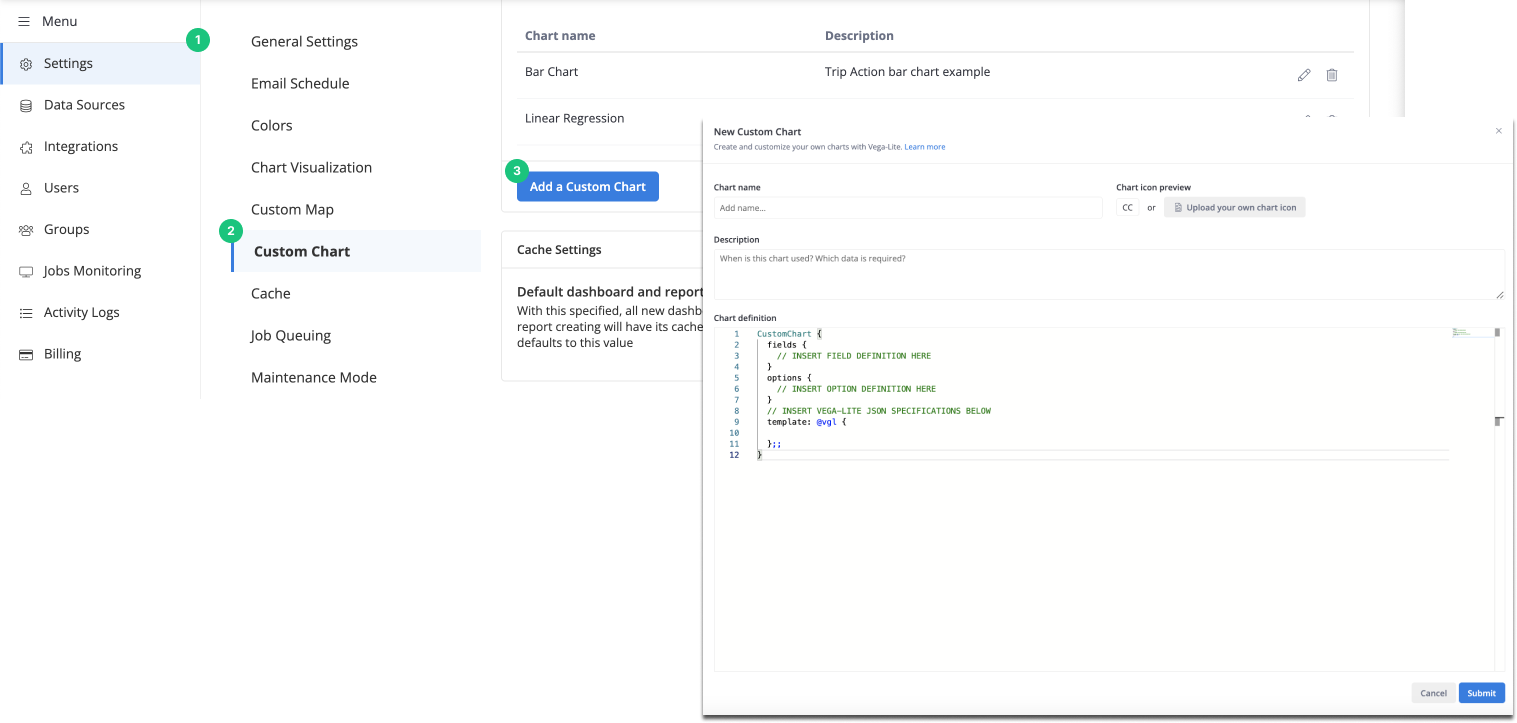
It has the same structure as CustomChartDef - fields, options, and template work identically - but without a name identifier, label, or description:
CustomChart {
  fields { ... }
  options { ... }
  template: @vgl { ... };;
}