Custom Charts
- Custom Chart feature is available to all customers in Standard Plan and above
- For customers who are eligible for this feature but cannot find it in-app, or customers in Entry Plan and would like to give this feature a spin, please let us know via this form: Holistics's Support Ticket
Introduction
While Holistics's default chart types are often good enough for quick data visualization and analysis, they may not cover many advanced use cases. This is where Custom Chart comes in to help you create complex but reusable chart templates that cater to your specific needs.
Custom Charts is powered by Vega or Vega-lite specifications, with Holistics's specifications on top to allow end-users to configure and interact with the charts in the same way as Holistics's built-in charts.
Getting started
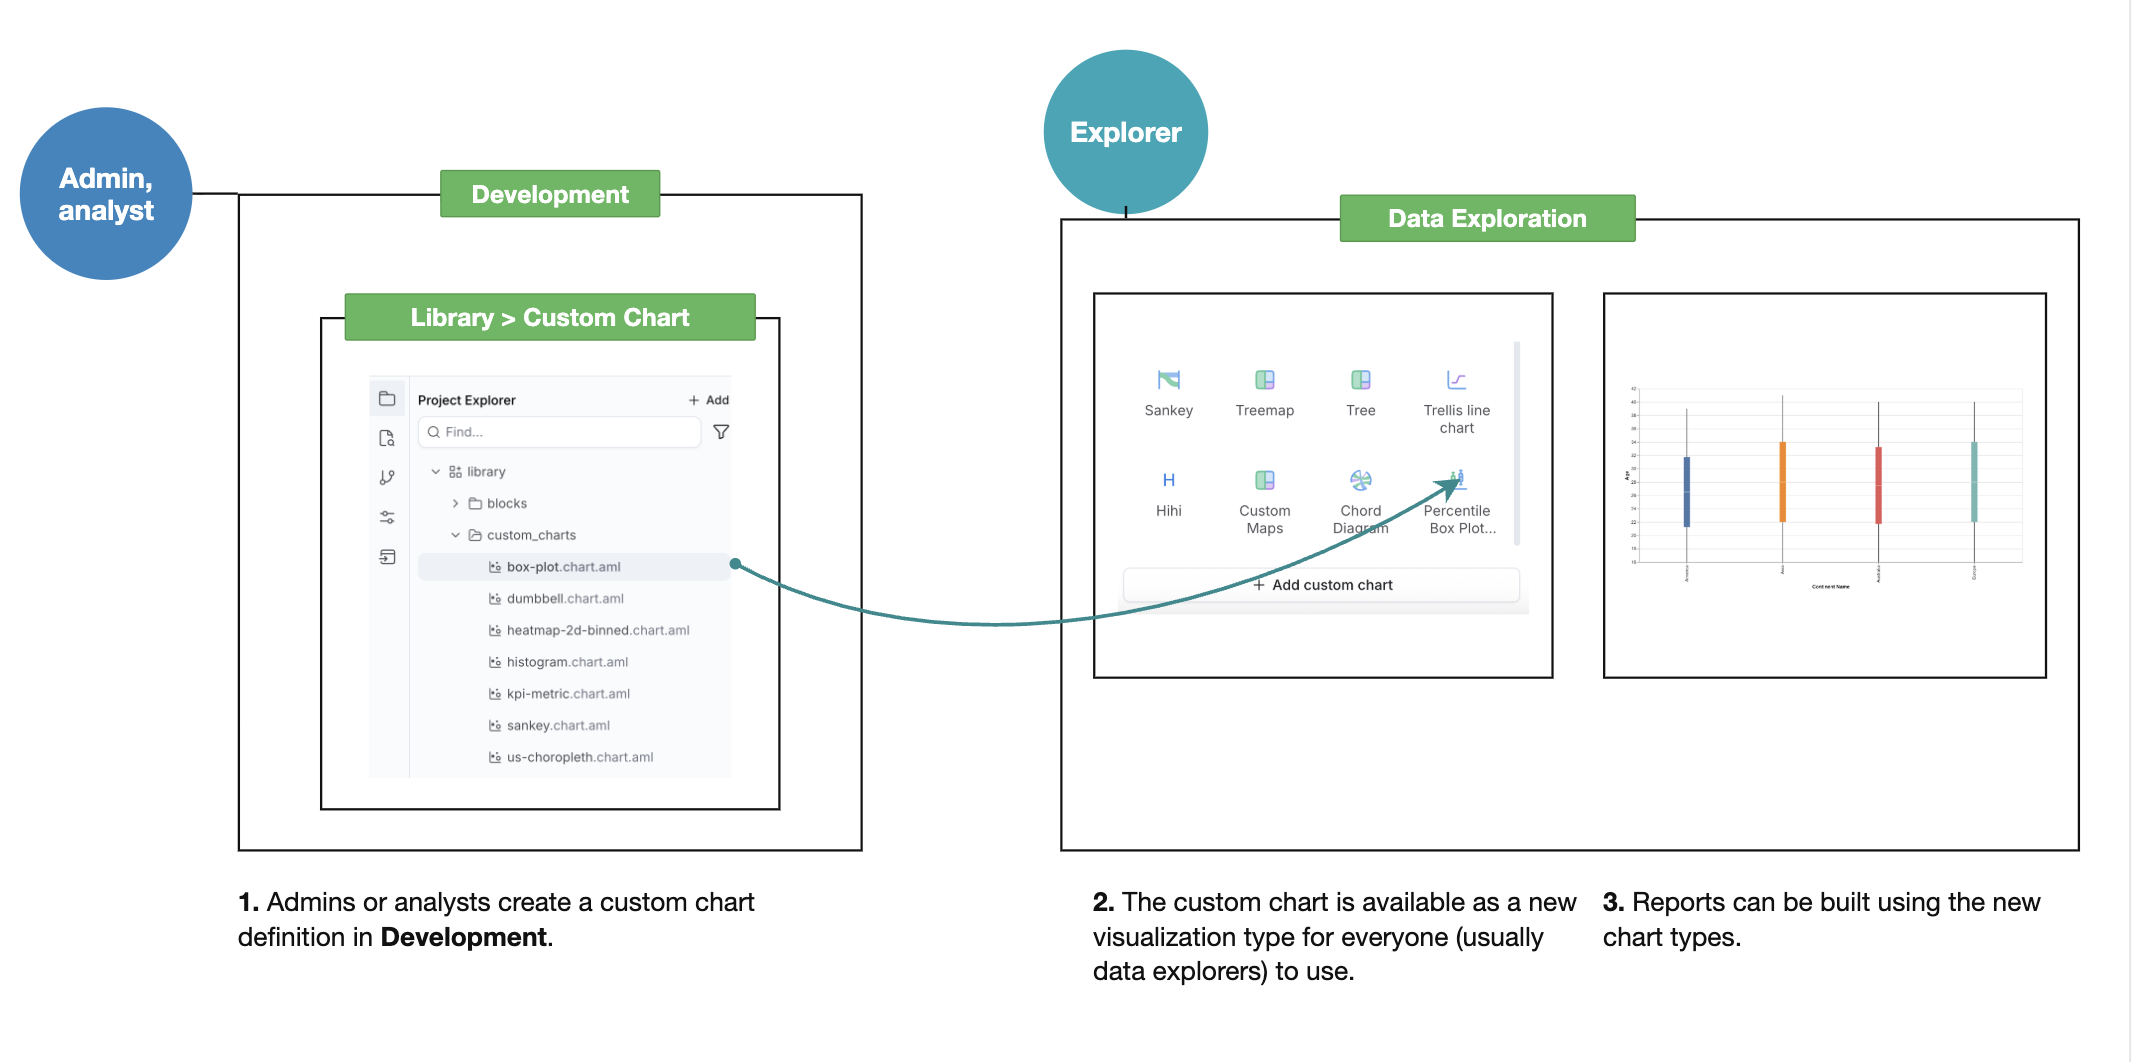
Step 1: Define a custom chart
In Development > Library > Custom Charts, create a new .chart.aml file and define your chart using the CustomChartDef block. This definition is a reusable template and does not contain data by itself.
CustomChartDef my_bar_chart {
  label: 'My Bar Chart'
  description: '...' // optional

  fields { ... }
  options { ... }

  template: @vgl { ... };;  // use @vg instead for Vega syntax
}
To learn how to write a custom chart definition:
- Understand Custom Chart
- AML Custom Chart Reference
- Video Tutorial: Create a Custom Chart
- Custom Chart Library
Step 2: Build a visualization from the definition
Once defined, the chart definition is available in the chart picker alongside built-in charts. When you add a custom chart to a visualization block, the generated code looks like this:
block my_block: VizBlock {
  viz: CustomChart {
    custom_chart: my_bar_chart  // reference the custom chart name
    dataset: my_dataset
    field x_axis: dimension_field
    field y_axis: measure_field
  }
}
Supported Holistics features
Custom charts support the following Holistics features:
- Interactive features (Explore, Date-drill, Cross-filter, Drill-through, etc.)
- Data Alert and Data schedules for reports
- Export reports to PNG/PDF/Excel/CSV
Syntax reference
For a full parameter reference for CustomChartDef and CustomChart, see the AML Custom Chart Reference.
Hover over CustomChartDef or CustomChart in the code editor to see suggestions for available parameters.