Treemap
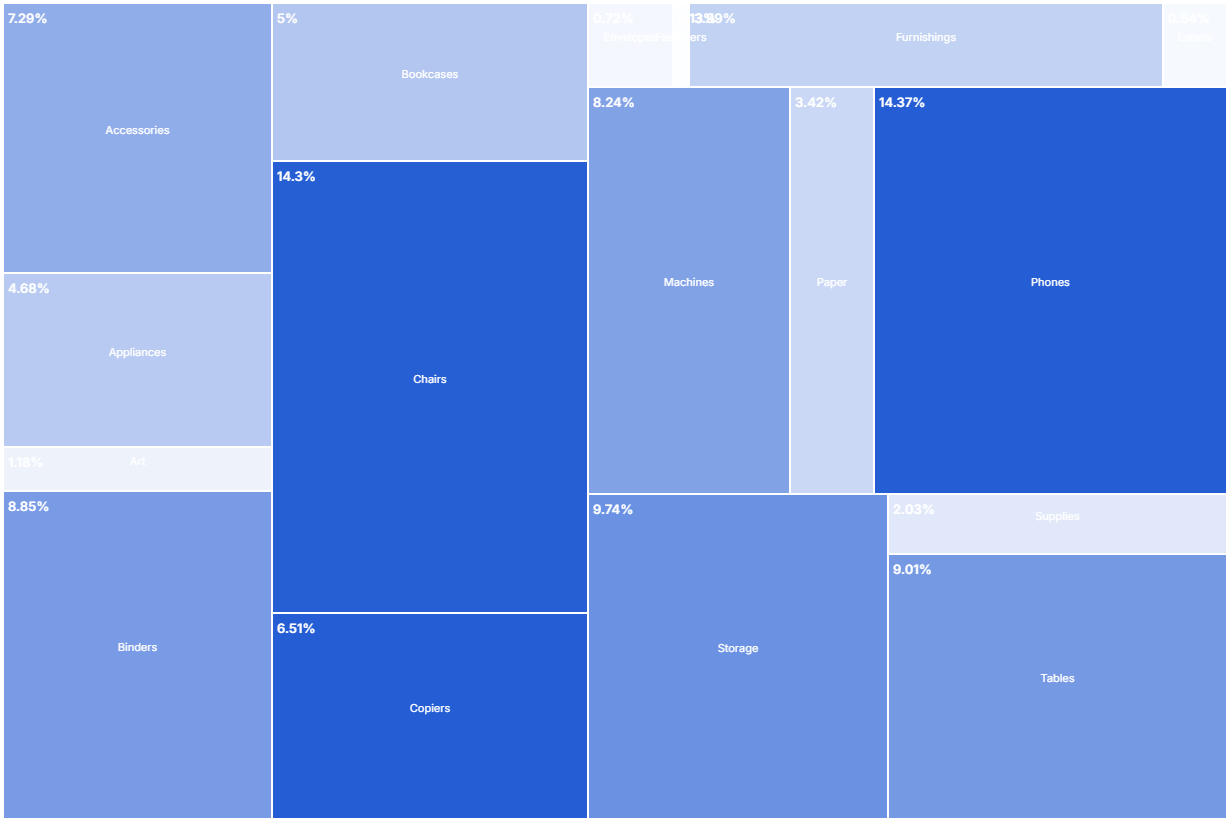
A treemap displays hierarchical data as a set of nested rectangles. Each branch of the tree is a rectangle whose area is proportional to a value in the data.
- Good for: part-to-whole composition across one category (revenue by product, storage by folder, headcount by team), comparing many categories by size in a compact space.
- Not great for: precise value comparison (use a bar chart), time series, flow between categories (use a Sankey Chart or Chord Diagram), or categories with negative values.
Syntax
Use the following AML definition to add the Treemap to your custom chart library.
CustomChartDef treemap {
  label: 'Treemap'
  description: 'To show how categories make up a total as nested rectangles sized by value.'
  fields {
    field dimension {
      label: 'Dimension'
      type: 'dimension'
      sort {
        apply_order: 1
        direction: 'asc'
      }
    }
    field value {
      label: 'Value'
      type: 'measure'
      sort {
        apply_order: 2
        direction: 'desc'
      }
    }
  }
  options {
    option fill_color {
      label: 'Fill color'
      type: 'color-picker'
      default_value: '#255DD4'
    }
    option text_color {
      label: 'Text color'
      type: 'color-picker'
      default_value: 'white'
    }
    option text_length_limit {
      label: 'Text length limit (px)'
      type: 'number-input'
      default_value: 200
    }
    option layout_method {
      label: 'Treemap method'
      type: 'select'
      default_value: 'squarify'
      options: ['binary', 'squarify', 'dice', 'resquarify', 'slice', 'slicedice']
    }
  }
  template: @vg {
    "$schema": "https://vega.github.io/schema/vega/v5.json",
    "signals": [
      {
        "name": "width",
        "init": "containerSize()[0] - 5",
        "on": [{ "events": "window:resize", "update": "containerSize()[0] - 5" }]
      },
      {
        "name": "height",
        "init": "containerSize()[1] - 5",
        "on": [{ "events": "window:resize", "update": "containerSize()[1] - 5" }]
      },
      {
        "name": "normalPointSelection",
        "value": null,
        "on": [
          {"events": "@rectMark:click", "update": "{'@{fields.dimension.name}': [datum['@{fields.dimension.name}']]}"},
          {"events": "click[!event.item]", "update": "null"}
        ]
      },
      {
        "name": "hoverPointSelection",
        "value": null,
        "on": [
          {"events": "@rectMark:mouseover", "update": "{'@{fields.dimension.name}': [datum['@{fields.dimension.name}']]}"},
          {"events": "@rectMark:mouseout", "update": "null"}
        ]
      }
    ],
    "holisticsConfig": {
      "crossFilterSignals": ["normalPointSelection"],
      "contextMenuSignals": ["hoverPointSelection"]
    },
    "data": [
      {
        "name": "tree",
        "values": @{values},
        "transform": [
          {
            "type": "filter",
            "expr": "datum['@{fields.value.name}'] !== null & datum['@{fields.value.name}'] > 0"
          },
          {
            "type": "joinaggregate",
            "ops": ["sum"],
            "fields": [@{fields.value.name}],
            "as": ["_total_size"]
          },
          {
            "type": "joinaggregate",
            "ops": ["max"],
            "fields": [@{fields.value.name}],
            "as": ["_max_size"]
          },
          {
            "type": "formula",
            "as": "_percentage",
            "expr": "round(datum['@{fields.value.name}'] / datum._total_size * 10000)/100 + '%'"
          },
          {
            "type": "formula",
            "as": "_opacity",
            "expr": "datum['@{fields.value.name}'] / datum._max_size"
          },
          {"type": "nest" },
          {
            "type": "treemap",
            "field": @{fields.value.name},
            "sort": {"field": @{fields.value.name}},
            "round": true,
            "method": @{options.layout_method.value},
            "size": [{"signal": "width"}, {"signal": "height"}]
          }
        ]
      }
    ],
    "scales": [
      {
        "name": "color",
        "type": "ordinal",
        "domain": {"data": "tree", "field": @{fields.dimension.name}},
        "range": [@{options.fill_color.value}]
      }
    ],
    "marks": [
      {
        "type": "rect",
        "name": "rectMark",
        "from": {"data": "tree"},
        "interactive": true,
        "encode": {
          "enter": {
            "stroke": {"value": "white"},
            "strokeWidth": {"value": 2},
            "fill": {"scale": "color", "field": @{fields.dimension.name}},
            "tooltip": {
              "signal": "datum['@{fields.dimension.name}'] + ': ' + datum['@{fields.value.name}'] + ' (' + datum._percentage + ')'"
            }
          },
          "update": {
            "x": {"field": "x0"},
            "y": {"field": "y0"},
            "x2": {"field": "x1"},
            "y2": {"field": "y1"},
            "opacity": {"field": "_opacity"}
          },
          "hover": {"opacity": {"value": 1}}
        }
      },
      {
        "type": "text",
        "from": {"data": "tree"},
        "interactive": false,
        "encode": {
          "enter": {
            "font": { "value": "Inter" },
            "align": {"value": "center"},
            "baseline": {"value": "middle"},
            "fill": {"value": @{options.text_color.value}},
            "text": {"field": @{fields.dimension.name}},
            "limit": {"value": @{options.text_length_limit.value}}
          },
          "update": {
            "x": {"signal": "0.5 * (datum.x0 + datum.x1)"},
            "y": {"signal": "0.5 * (datum.y0 + datum.y1 - 15)"}
          }
        }
      },
      {
        "type": "text",
        "from": {"data": "tree"},
        "interactive": false,
        "encode": {
          "enter": {
            "font": { "value": "Inter" },
            "fontSize": {"value": 13},
            "fontWeight": {"value": 600},
            "baseline": {"value": "top"},
            "fill": {"value": @{options.text_color.value}},
            "text": {"field": "_percentage"},
          },
          "update": {
            "x": {"signal": "datum.x0 + 5"},
            "y": {"signal": "datum.y0 + 10"}
          }
        }
      }
    ],
    "params": [
      {
        "bind": "..."
      }
    ]
  };;
}
Legacy syntax
CustomChart {
  fields {
    field dimension {
      label: 'Label'
      type: 'dimension'
    }
    field measure {
      label: 'Value',
      type: 'measure'
    }
  }
  options {
    option fill_color {
      label: 'Fill color'
      type: 'color-picker'
      default_value: '#255DD4'
    }
    option text_color {
      label: 'Text color'
      type: 'color-picker'
      default_value: 'white'
    }
    option text_length_limit {
      label: 'Text length limit (px)'
      type: 'number-input'
      default_value: 200
    }
    option layout_method {
      label: 'Treemap method'
      type: 'select'
      default_value: 'squarify'
      options: ['binary', 'squarify', 'dice', 'resquarify', 'slice', 'slicedice']
    }
  }
  template: @vg {
    "$schema": "https://vega.github.io/schema/vega/v5.json",
    "description": "A flat treemap layout for hierarchical data.",
    "signals": [
      {
        "name": "width",
        "init": "containerSize()[0] - 5",
        "on": [{ "events": "window:resize", "update": "containerSize()[0] - 5" }]
      },
      {
        "name": "height",
        "init": "containerSize()[1] - 5",
        "on": [{ "events": "window:resize", "update": "containerSize()[1] - 5" }]
      }
    ],
    "data": [
      {
        "name": "tree",
        "values": @{values},
        "transform": [
          {
            "type": "filter",
            "expr": "datum['@{fields.measure.name}'] !== null & datum['@{fields.measure.name}'] > 0"
          },
          {
            "type": "joinaggregate",
            "ops": ["sum"],
            "fields": [@{fields.measure.name}],
            "as": ["_total_size"]
          },
          {
            "type": "joinaggregate",
            "ops": ["max"],
            "fields": [@{fields.measure.name}],
            "as": ["_max_size"]
          },
          {
            "type": "formula",
            "as": "_percentage",
            "expr": "round(datum['@{fields.measure.name}'] / datum._total_size * 10000)/100 + '%'"
          },
          {
            "type": "formula",
            "as": "_opacity",
            "expr": "datum['@{fields.measure.name}'] / datum._max_size"
          },
          {"type": "nest" },
          {
            "type": "treemap",
            "field": @{fields.measure.name},
            "sort": {"field": @{fields.measure.name}},
            "round": true,
            "method": @{options.layout_method.value},
            "size": [{"signal": "width"}, {"signal": "height"}]
          }
        ]
      }
    ],
    "scales": [
      {
        "name": "color",
        "type": "ordinal",
        "domain": {"data": "tree", "field": @{fields.dimension.name}},
        "range": [@{options.fill_color.value}]
      }
    ],
    "marks": [
      {
        "type": "rect",
        "from": {"data": "tree"},
        "interactive": true,
        "encode": {
          "enter": {
            "stroke": {"value": "white"},
            "strokeWidth": {"value": 2},
            "fill": {"scale": "color", "field": @{fields.dimension.name}},
            "tooltip": {
              "signal": "datum['@{fields.dimension.name}'] + ': ' + datum['@{fields.measure.name}'] + ' (' + datum._percentage + ')'"
            }
          },
          "update": {
            "x": {"field": "x0"},
            "y": {"field": "y0"},
            "x2": {"field": "x1"},
            "y2": {"field": "y1"},
            "opacity": {"field": "_opacity"}
          },
          "hover": {"opacity": {"value": 1}}
        }
      },
      {
        "type": "text",
        "from": {"data": "tree"},
        "interactive": false,
        "encode": {
          "enter": {
            "font": { "value": "Inter" },
            "align": {"value": "center"},
            "baseline": {"value": "middle"},
            "fill": {"value": @{options.text_color.value}},
            "text": {"field": @{fields.dimension.name}},
            "limit": {"value": @{options.text_length_limit.value}}
          },
          "update": {
            "x": {"signal": "0.5 * (datum.x0 + datum.x1)"},
            "y": {"signal": "0.5 * (datum.y0 + datum.y1 - 15)"}
          }
        }
      },
      {
        "type": "text",
        "from": {"data": "tree"},
        "interactive": false,
        "encode": {
          "enter": {
            "font": { "value": "Inter" },
            "fontSize": {"value": 13},
            "fontWeight": {"value": 600},
            "baseline": {"value": "top"},
            "fill": {"value": @{options.text_color.value}},
            "text": {"field": "_percentage"},
          },
          "update": {
            "x": {"signal": "datum.x0 + 5"},
            "y": {"signal": "datum.y0 + 10"}
          }
        }
      }
    ],
    "params": [
      {
        "bind": "..."
      }
    ]
  };;
}
Required fields
A Treemap expects exactly two fields. Each row of input becomes one rectangle.
| Field | Label | Type | Role |
|---|---|---|---|
dimension | Dimension | dimension | Category each rectangle represents; also drives the rectangle label. Sorted ascending (apply_order: 1). |
value | Value | measure | Rectangle area, the percentage label, and the fill opacity (relative to the largest value). Sorted descending (apply_order: 2). |
Data requirements: Pre-aggregate to one row per category (for example, SUM(value) grouped by dimension); the template sizes a rectangle per row and does not combine duplicate categories. The template keeps only rows where value is non-null and greater than zero, so it drops any zero or negative rows before rendering.
Sample data:
| dimension | value |
|---|---|
| Electronics | 24000 |
| Apparel | 18000 |
| Home | 12000 |
| Toys | 7000 |
| Books | 4000 |
Options
Set these options to adjust the chart without editing the Vega template. The CustomChartDef block above declares each option's type and allowed values.
| Option | Default | Effect |
|---|---|---|
fill_color | #255DD4 | Base fill color for the rectangles. Each rectangle's opacity scales with its value relative to the largest one. |
text_color | white | Color of the category label and percentage text inside each rectangle. |
text_length_limit | 200 | Maximum width of the category label, in pixels. The template truncates longer labels. |
layout_method | squarify | Treemap tiling algorithm that controls rectangle shapes and arrangement. |
Known limitations
-
Pre-aggregate first. The template draws one rectangle per row and does not sum duplicate categories, so repeated category rows render as separate overlapping rectangles. Aggregate to one row per category first.
-
The template drops non-positive values. It filters out rows where
valueis null, zero, or negative, so categories with those values do not appear at all. -
Single level only. The template renders a flat set of rectangles from one dimension; it does not nest sub-categories. Use a Sunburst Chart for multi-level hierarchies.