Scatter Chart
A Scatter Chart, or scatter plot, uses values from two variables as coordinates to put data points on a two-dimensional graph.
When to use Scatter Chart?
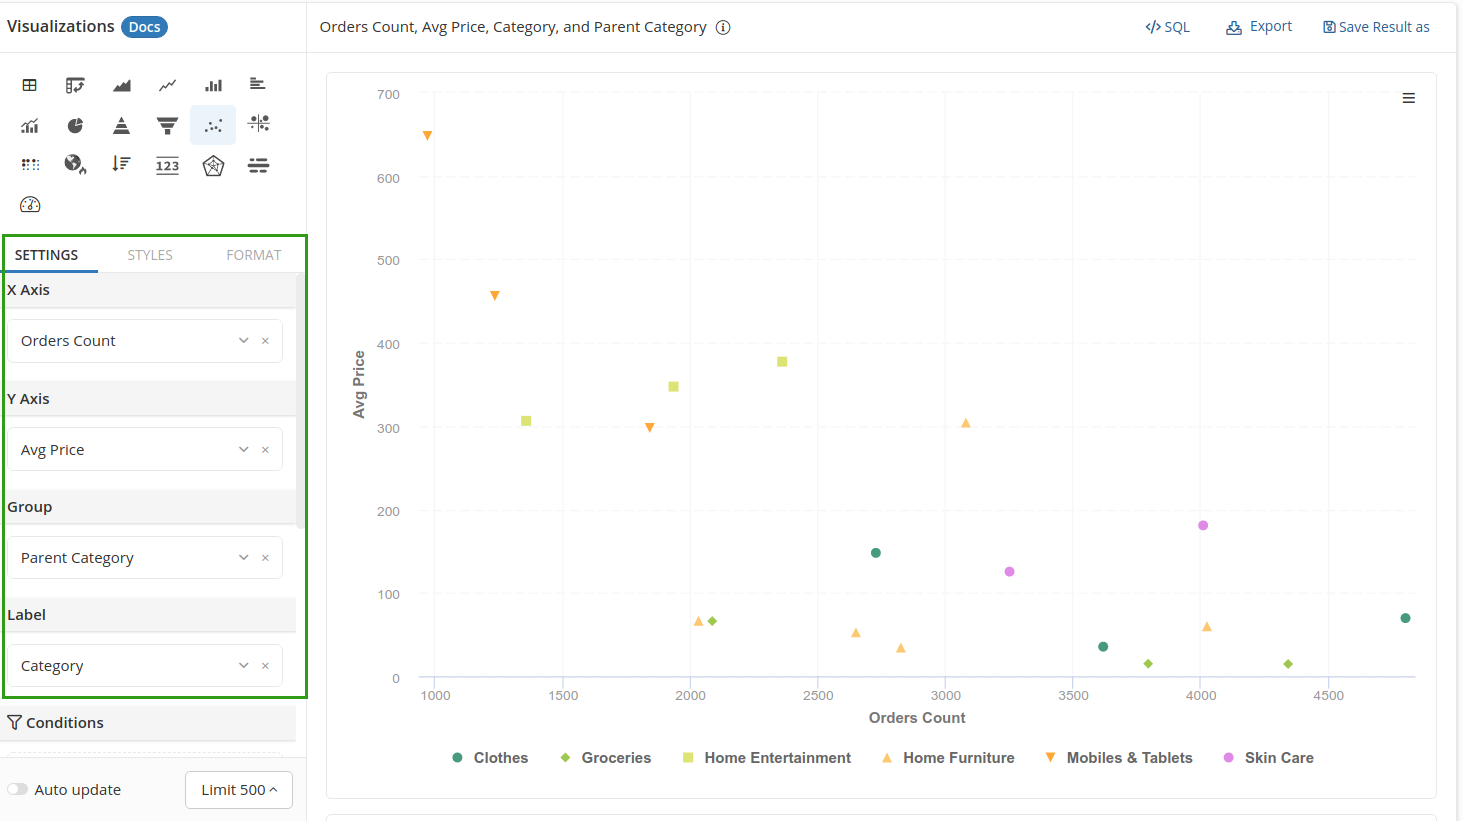
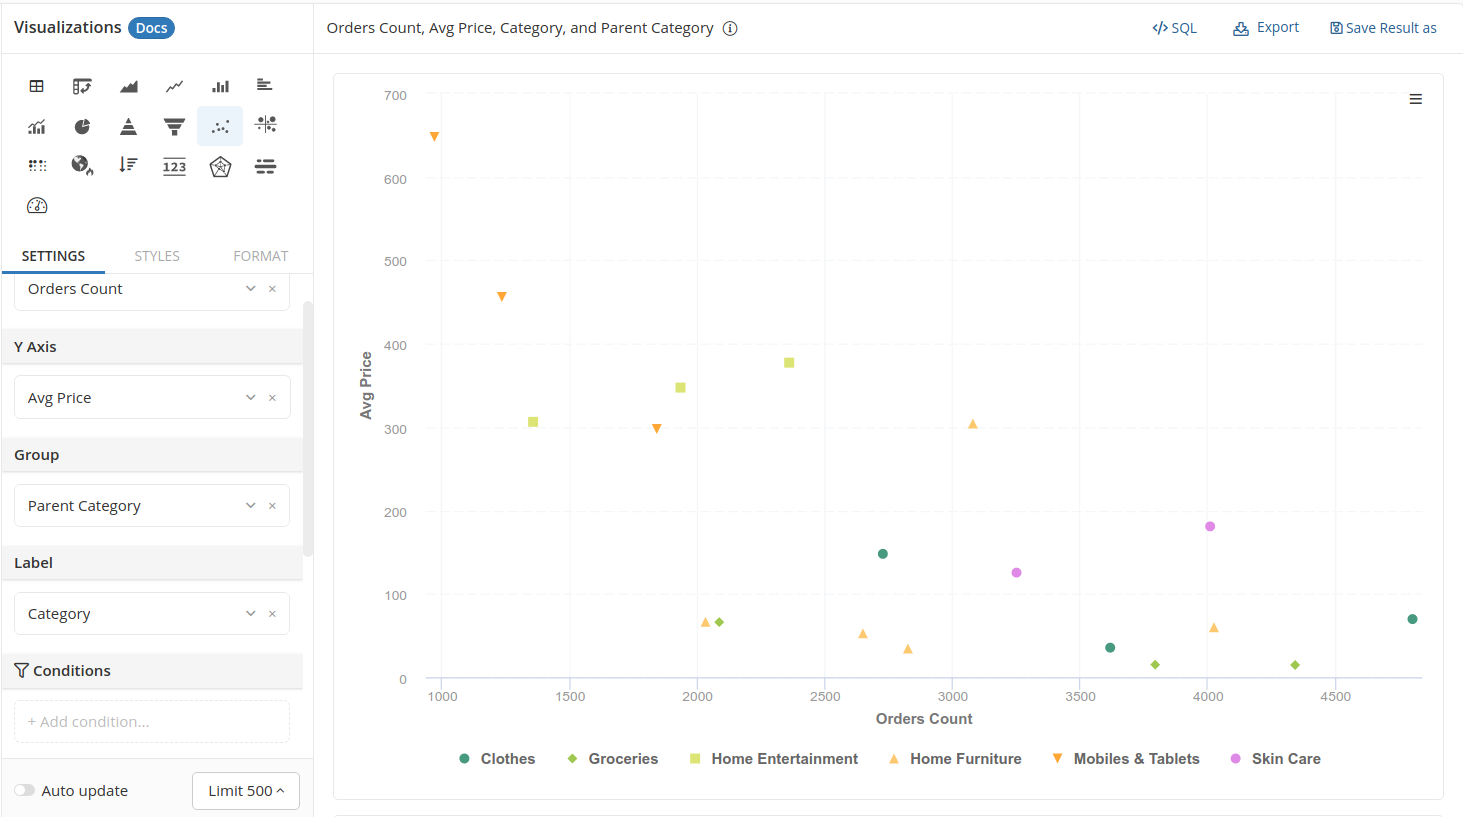
Scatter Chart is most useful when you want to visualize the relationship between two variables. In the example below, we plot Orders Count against Avg the price of different categories. We can easily see a negative correlation here: cheaper products are purchased more, and vice versa.
Typically, the two variables are continuous variables, though it is possible to use discrete categorical variables.
Create a Scatter Chart
To create a Scatter Chart, simply drag in the necessary variables:
- X-axis and Y-axis: The variables to be used as your "coordination system" will go here
- Group: Put the dimension that you want to use to categorize your data points here. If there is nothing here, all data points will be formatted with the same shape and color.
- Label: Put the dimension with values that can be used to label your data points here. The label will appear in the tooltips when you hover your mouse on the points