Galaxy schema (fact constellation)
What is galaxy schema?
Galaxy schema, also called fact constellation, is when you have multiple fact tables that share the same dimensions. Think of it as multiple star schemas connected through common dimensions.
Visual structure:
When to use galaxy schema
Galaxy schema is the right choice when you need to:
- Analyze multiple business processes together (like orders and inventory)
- Work with different facts that share common dimensions (products, dates, locations)
- Build metrics that span multiple fact tables
- Get a comprehensive view of your business
If you only have a single business process or your facts don't share dimensions, Star schema is simpler and more appropriate.
Handling multi-path selection
When multiple facts connect to the same dimensions, there are multiple possible paths between models. Holistics automatically chooses the most analytically correct path using a ranking algorithm based on path tier, weight, and length.
Example: When you query "total quantity available by product", Holistics intelligently selects the direct path:
-
Selected path:
dim_products→fct_inventory- Pattern: Dimension to fact (one-to-many)
- Tier: Tier 1 (Best - pure one-to-many relationships)
- Length: 2 hops
-
Not-selected path:
dim_products→fct_orders→dim_dates→fct_inventory- Pattern: Mixed - goes through multiple facts
- Tier: Tier 4 (Mixed pattern not following standard analytics patterns)
- Length: 4 hops
Holistics automatically selects the first path because Tier 1 ranks higher than Tier 4. The direct dimension-to-fact relationship follows the most common and reliable analytics pattern.
For more details on how path selection works, see Path ambiguity in dataset.
Step-by-step implementation
Step 1: Create your fact models
Start by defining each fact model for your different business processes. Each fact represents a distinct measurable event - in this example, we have orders and inventory.
Model fct_orders {
  type: 'table'
  table_name: 'ecommerce.orders'
  data_source_name: 'your_data_source_name'

  dimension id {
    label: 'Order ID'
    type: 'number'
    primary_key: true
    hidden: true
  }

  dimension product_id {
    label: 'Product ID'
    type: 'number'
    hidden: true
  }

  dimension created_at {
    label: 'Created At'
    type: 'datetime'
  }

  dimension item_value {
    label: 'Item Value'
    type: 'number'
  }

  measure total_gmv {
    label: 'Total GMV'
    type: 'number'
    definition: @aql sum(fct_orders.item_value);;
  }
}
Model fct_inventory {
  type: 'table'
  table_name: 'ecommerce.inventory'
  data_source_name: 'your_data_source_name'

  dimension id {
    label: 'Inventory ID'
    type: 'number'
    primary_key: true
    hidden: true
  }

  dimension product_id {
    label: 'Product ID'
    type: 'number'
    hidden: true
  }

  dimension created_at {
    label: 'Created At'
    type: 'datetime'
  }

  dimension quantity_available {
    label: 'Quantity Available'
    type: 'number'
  }

  measure total_quantity {
    label: 'Total Available Quantity'
    type: 'number'
    definition: @aql sum(fct_inventory.quantity_available);;
  }
}
Step 2: Create shared dimension models
These are the dimensions that both fact tables will connect to. Since they're shared across multiple facts, they act as the common ground for cross-process analysis.
Model dim_products {
  type: 'table'
  table_name: 'ecommerce.products'
  data_source_name: 'your_data_source_name'

  dimension id {
    label: 'Product ID'
    type: 'number'
    primary_key: true
    hidden: true
  }

  dimension name {
    label: 'Product Name'
    type: 'text'
  }

  dimension category {
    label: 'Category'
    type: 'text'
  }
}
Model dim_dates {
  type: 'table'
  table_name: 'ecommerce.dates'
  data_source_name: 'your_data_source_name'

  dimension date {
    label: 'Date'
    type: 'date'
    primary_key: true
  }

  dimension month {
    label: 'Month'
    type: 'text'
  }

  dimension quarter {
    label: 'Quarter'
    type: 'text'
  }
}
Step 3: Build dataset with all relationships
Now connect everything in a dataset. Notice that all relationships are active - Holistics will automatically choose the best path for each query based on what you're trying to analyze.
Dataset galaxy_schema {
  label: 'Orders and Inventory Analysis'
  data_source_name: 'your_data_source_name'

  models: [
    fct_orders,
    fct_inventory,
    dim_products,
    dim_dates
  ]

  relationships: [
    // Orders connections
    relationship(fct_orders.product_id > dim_products.id, true),
    relationship(fct_orders.created_at > dim_dates.date, true),

    // Inventory connections (all active - Holistics handles ambiguity automatically)
    relationship(fct_inventory.product_id > dim_products.id, true),
    relationship(fct_inventory.created_at > dim_dates.date, true)
  ]

  // Holistics automatically uses the direct path: fct_inventory → dim_products
  metric total_available_products {
    label: 'Total Available Quantity'
    type: 'number'
    definition: @aql
      fct_inventory | sum(fct_inventory.quantity_available)
    ;;
  }

  // Uses the direct path: fct_orders → dim_products
  metric total_gmv {
    label: 'Total GMV'
    type: 'number'
    definition: @aql fct_orders | sum(fct_orders.item_value);;
  }
}
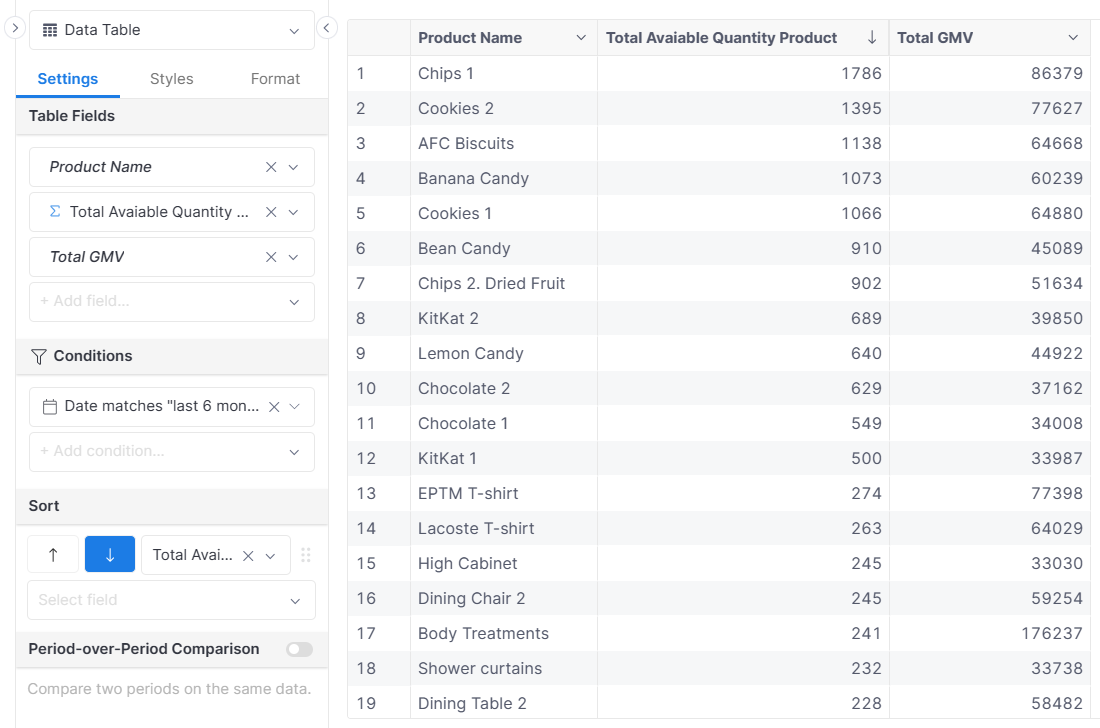
Using both facts together
explore {
  dimensions {
    dim_products.name
  }
  measures {
    total_available_products,
    total_gmv
  }
  filters {
    dim_dates.date matches @(last 6 months)
  }
}
Result:
Next steps
- Snowflake dimensions - Add dimension hierarchies
- Role-playing dimensions - Same dimension, multiple meanings
- Handle path ambiguity guide - Deep dive into ambiguity resolution