Trend Lines
Add a trend line
Trend Lines reveal the overall direction of your data.
Trend Lines are supported in Line, Column, Bar, Area, and Combination Charts, and when X-axis contains numerical values (number, datetime, or date).
Adding a Trend Line in Holistics is very simple:
Trend line types
Depends on what story you want to tell with your data, and the values of your data, you may want to use different trend line types in different cases.
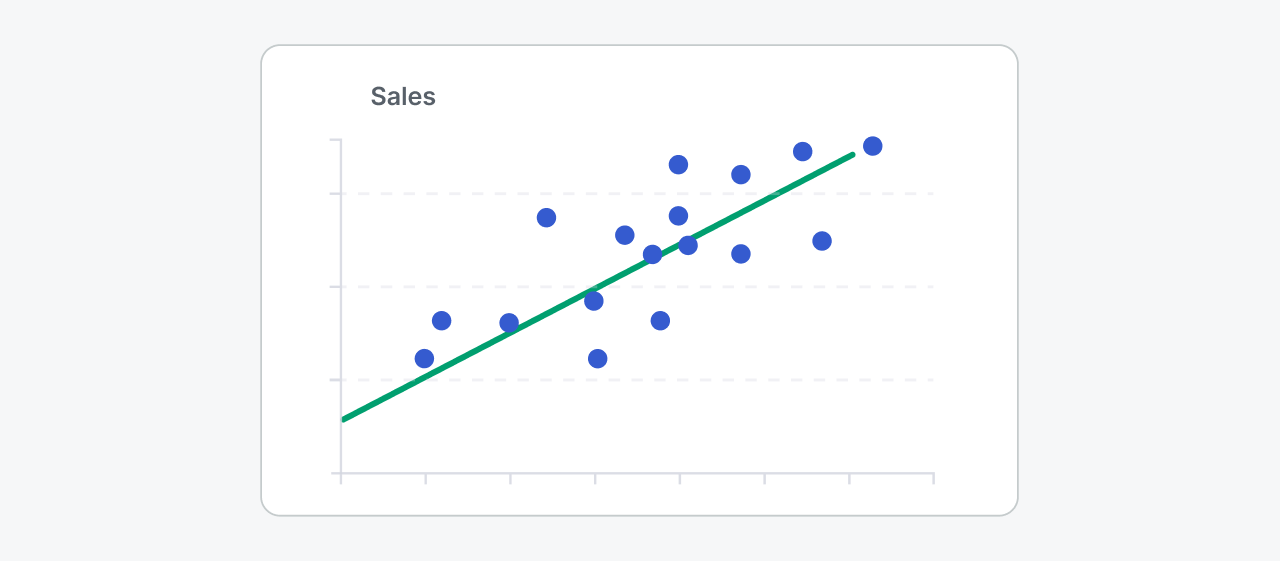
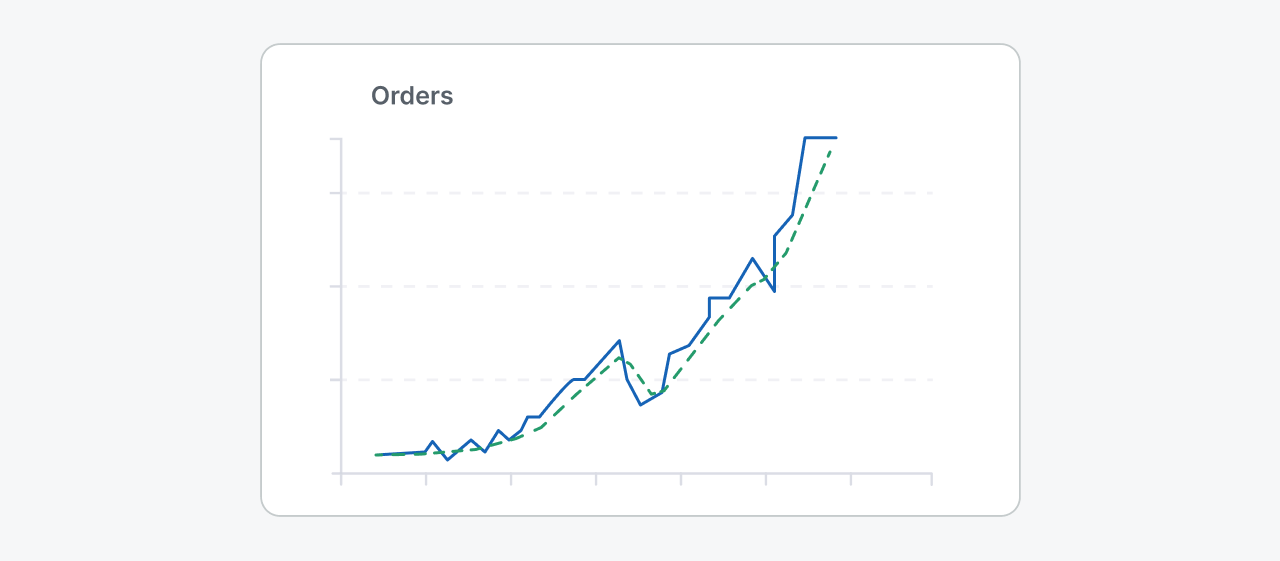
Linear
A linear trend line shows if your data is generally increasing or decreasing at a steady rate. You can also stick to linear when you just want to show the overall increasing or decreasing direction of your data overtime.
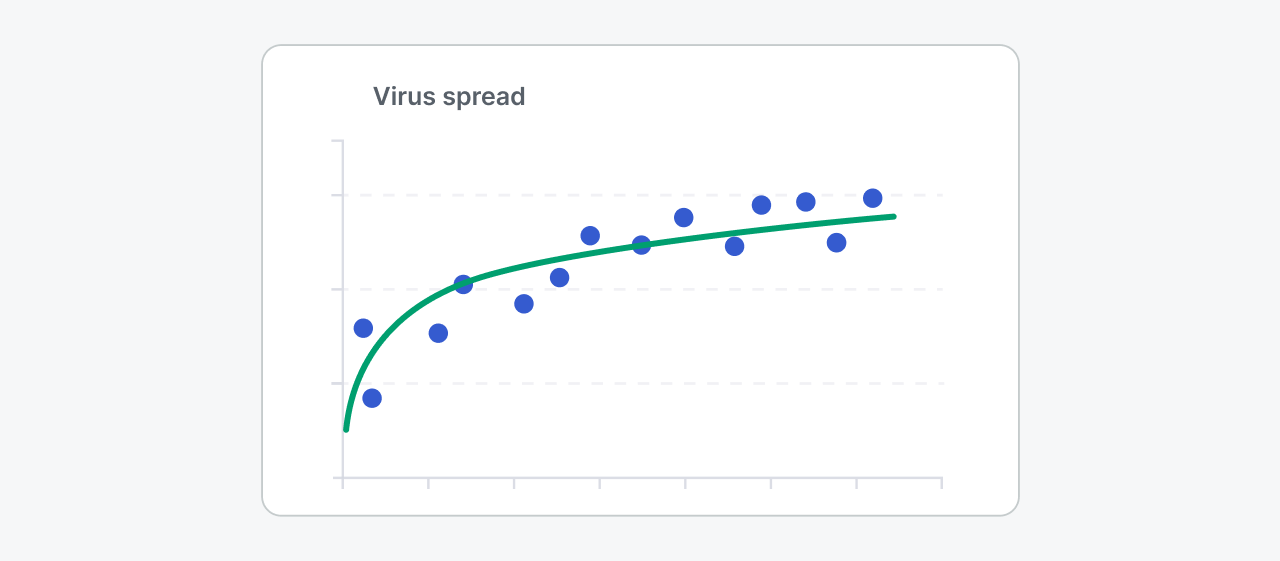
Logarithmic
This is useful when things are growing or shrinking really fast at first, then slow down and eventually flatten out. It works for both positive and negative values.
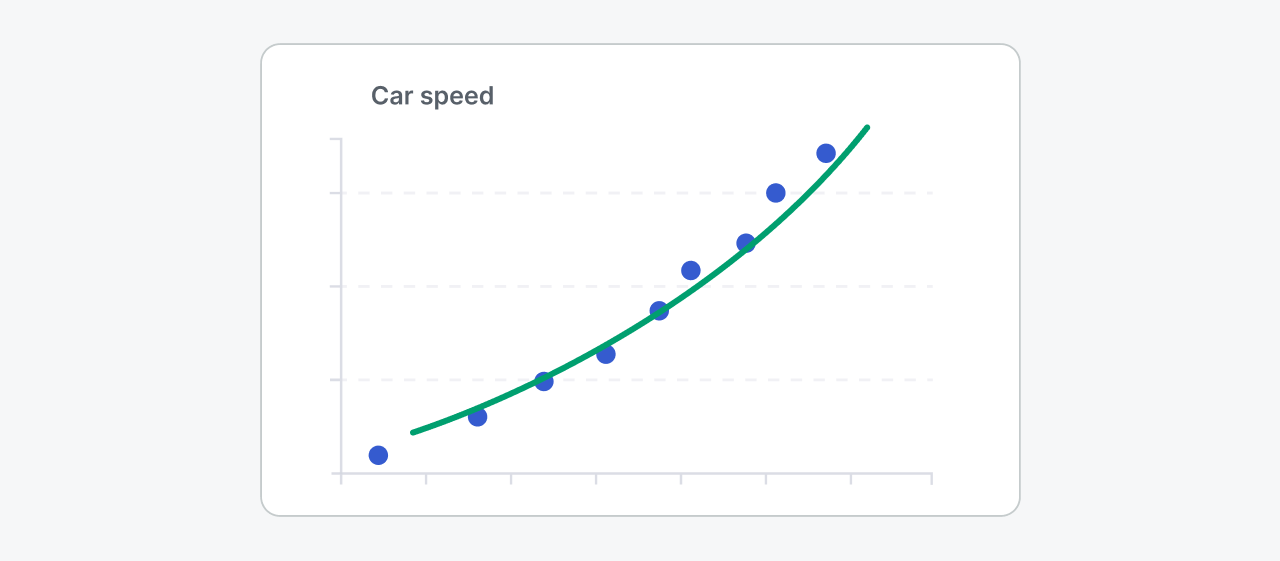
Power
Think of a curved line that shows something increasing faster and faster over time. Imagine a car speeding up. This is useful for data that grows quickly at first and keeps accelerating. You cannot create a power trend line if your data contains zero or negative values.
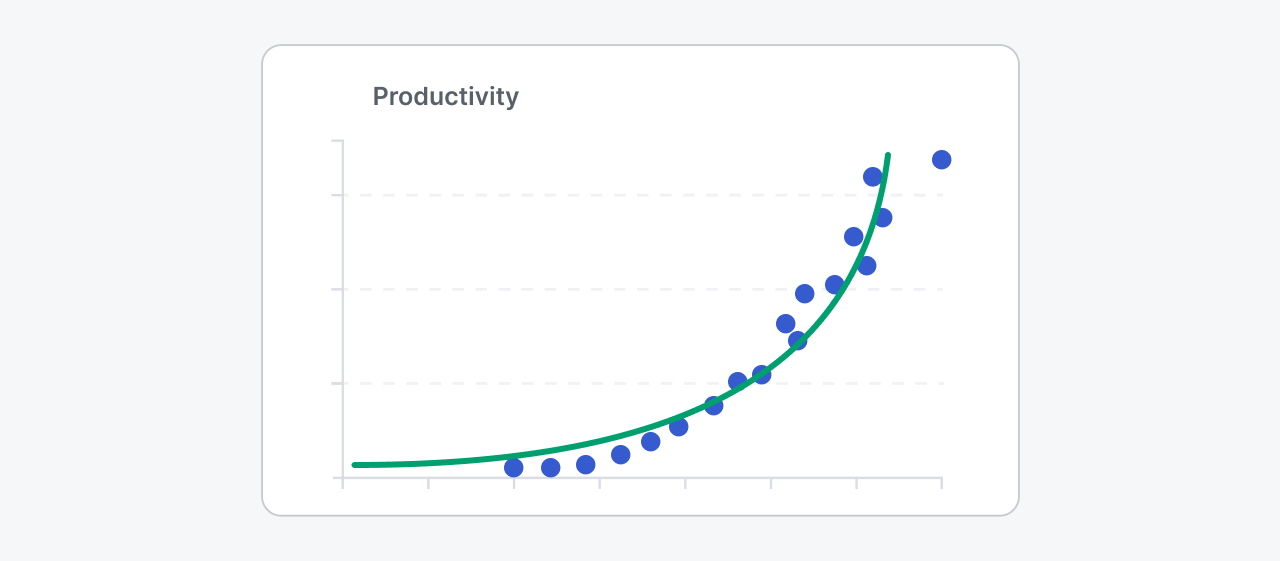
Exponential
Imagine a steep curved line, like rocket launching speed or user’s productivity when first using Holistics 😉 This is useful when things are growing or shrinking incredibly fast at first, then the speed of change keeps increasing. An exponential trend line won’t work if your data contains zero or negative values.
Moving Average
A moving average trend line smoothes out data fluctuations to reveal a clearer pattern or trend.
Tip: for "Number of periods", we show the quick options of up to 3, but you can type in any number you want (e.g. 7 or 15).
Note: Moving Average is only available in Holistics 4.0.
Displaying one or multiple trend lines
When a Legend is present in the chart, Holistics will, by default, display a separate trend line for each legend value, resulting in multiple trend lines. However, you have two toggles, break down by legend and merge into one line, to turn them into one single trend line that better suits your analytical needs.
Please note that both toggles are available only in AQL-enabled datasets.
Option 1: Turn off the “break down by legend” toggle
- This toggle disables the effect of the Legend on the trend line. With the "Break down by legend" toggle turned off, the trend line will be the same as it would be in a chart without a legend.
- This option is suitable when you want to visualize the trend line of the total values, irrespective of the Legend.
- Here’s an example for what “break down by legend” toggle can do:
-
Image 1 is a visualization with no Legend at all.

-
Image 2 is a visualization with a Legend “Gender”, but the trend line’s toggle “break down by legend” is turned off.

-
You’ll see that the purple trend lines in both images have the same values.
-
Option 2: Turn on the “merge into one line” toggle
- This toggle calculates a single trend line based on all the segmented data points in the chart, similar to a scatter plot.
- This option is ideal if, after breaking down the total values, you wish to see the trend line among those segmented values.
- Here’s an example for the comparison of Option 1 and Option 2:
-
Image 1 is the visualization with a Legend “Gender”, but the trend line’s toggle “break down by legend” is turned off.
-
Image 2 is a visualization where we turn on both toggles “break down by legend” and “merge into one line” for the trend line.

-
You’ll see that the orange trend line in the second image are generally lower than the those of the purple trend line in the first image. This is because the orange trend line is calculated based on every segmented data point of the blue "f" line and the green "m" line.
-