How to create a Custom Map
Introduction
Your company might have hyper-local geographical data that Holistics has not supported (see: Supported location formats). However, you can still build a beautiful custom map by uploading and using your own data.
Custom map requirements
To create a Custom map in Holistics, you need two components:
A GeoJSON file that contains the location name and polygons to draw on the map. If you only have a JSON file, follow these steps to convert it to GeoJSON:
- Visit https://geojson.io
- Sign in with your Github account
- On the top left, select Open > File > Choose the JSON file on your computer. The file will be uploaded and you'll see the location data being visualized immediately. Below is a typical JSON file format and display.

- On the top left, select Save > GeoJSON and download the GeoJSON file to your computer. You will later upload this file to Holistics.
Your dataset must contain the location fields. Please note that the location names in your dataset must match exactly that of the GeoJSON file. The locations whose names do not match will not be displayed on the map.
You need to have Admin role to be able to upload the Custom map data to Holistics.
Creating a Custom map in Holistics
Sample data
- For demonstration purposes, we'll try to visualize the population of Alabama's counties. (Data source: Github You can download the already converted GeoJSON file here.
- Create a dataset using our sample data on Google Sheet here. Let's name our dataset Alabama_pop.
Steps
1. Upload GeoJSON file
In Holistics, on the top right corner, select Your Tenant name > Organization Settings > More Settings. At the Settings screen, navigate to Custom Map.
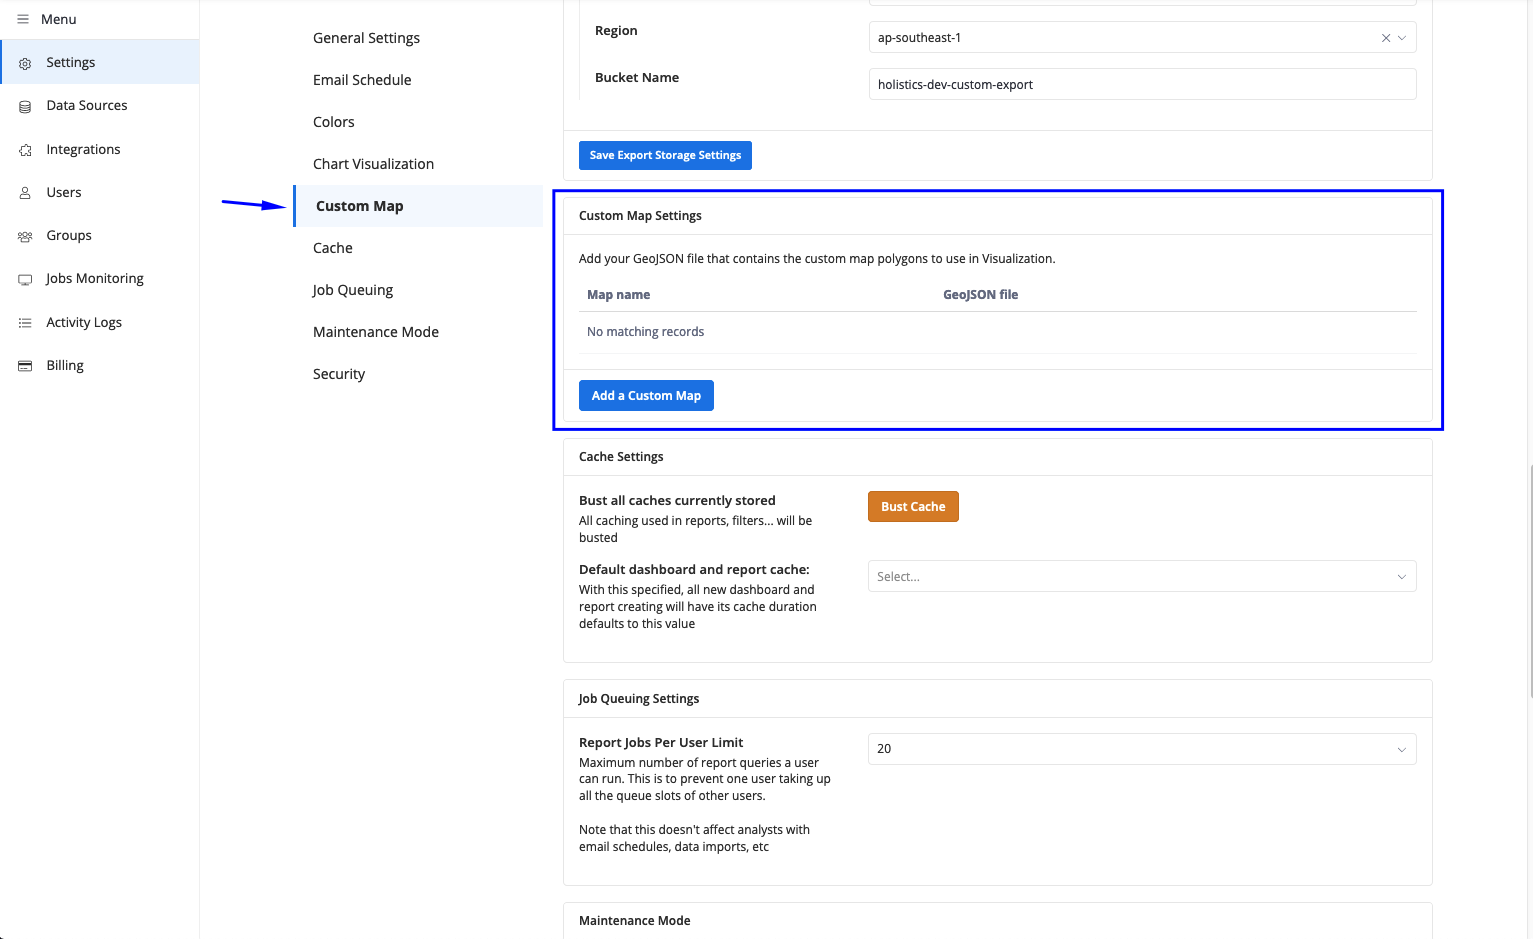
Click on Add a Custom Map to start uploading your GeoJSON file. Please note that Holistics only supports GeoJSON format and a maximum file size of 10MB at the moment.
After uploading the GeoJSON file, you'll be presented with a few settings:
- Map name: How you want to call this map. This will help you differentiate the maps in the Settings screen. Let's name our map Alabama-population.
- Select the field that contains the location name data: When you upload the file, Holistics will scan all the properties in the file and list them by each row. You just need to find the property/row that contains the location name data (i.e. United States, Singapore...) - you can see this in the Sample data. In our example, let's go ahead and select NAME (Sample data is Morgan, Randolph...).
noteWhy do you need this step? By selecting the property that contains the location names, you are telling Holistics to use this property as a location type. Later on, when building the map, you'll define the location field in your dataset with this location type so Holistics can draw the map precisely.

- Display name: After selecting the NAME property, let's change the Display name into County Name so we can easily recognize it later. Then click Submit and this step is complete.
2. Build Custom map in Viz Settings
- Navigate to our dataset Alabama_pop, then select the Visualizations type Filled Map.

Holistics supports building Custom map for Filled map only.
Drag field Name into Location. The field will auto-expand so you can select the Location type. Since we have already specified the Location type to be County Name in the previous step, let's go ahead and select Use Custom Map > County Name.

In Value field, we select Population as the input. Then click Get Result. Voila!

3. Customize the Custom map
Before we customize our Custom map, let's add Ruc Code into Legend. In Alabama, some counties will share the same Ruc Code. We can use this to color these counties later on. Then click Get Results again.
Navigate to Style tab. There are two sections here:
3.1. Map display settings
- Show color scale: To display/hide the color scale at the bottom right of the map.
- Color scale layout: To display the color scale horizontally or vertically.
- Map background: To change the map's layer display. Holistics supports 5 options: Light, Dark, Street, Satellite, Outdoor.

3.2. Color Formatting
- This section allows you to customize this map's color. We can color this map by each county's name, Ruc Code, or population. Let's go with Population (value) for now as it's the most common to color by value.
- Color formatting options
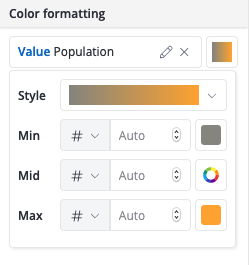
Style: Click on the color scale to change the color style of the map. Choose Smooth to generate a color gradient for both the map and the scale. Choosing Steps to explicitly divide the color scale into color blocks, each of which will contain a range of values. For example, if our data ranges from 0-100, and we set 5 steps, there will be 5 corresponding blocks of color: 0-20, 20-40…
Min - Mid - Max: by default, these fields’ values will be set to Auto. However, you can select from the drop-down list to the left of the input field to change to Number or Percent. Then, you can type your own data and the changes will be applied immediately to the color scale in Style.
Note: If your input data in min or max is out of range (i.e. your data range is 1-100 but you input 101 in min), Holistics will choose the max color as the displaying color. If your input data in mid is out of range (i.e. you put 1000 in mid), Holistics will not make any change to the color scale.
After we tweak with the settings, here's our final Custom map:

If you want to color the map by Legend, remove Population (value) from the Color formatting option, then choose Ruc Code (Legend). By default, Holistics will display all the locations in yellow.

Let's try to color the counties with Ruc code 6. Select the small colored square to the right of 6, then change it into Blue. We will see the results immediately.

Improving map precision
Sometimes, Holistics will not recognize one or more of the location names in your data.
When this happens we will display a small notice modal on the lower right of the preview window. Hovering on this will help you understand which location names we failed to recognize.
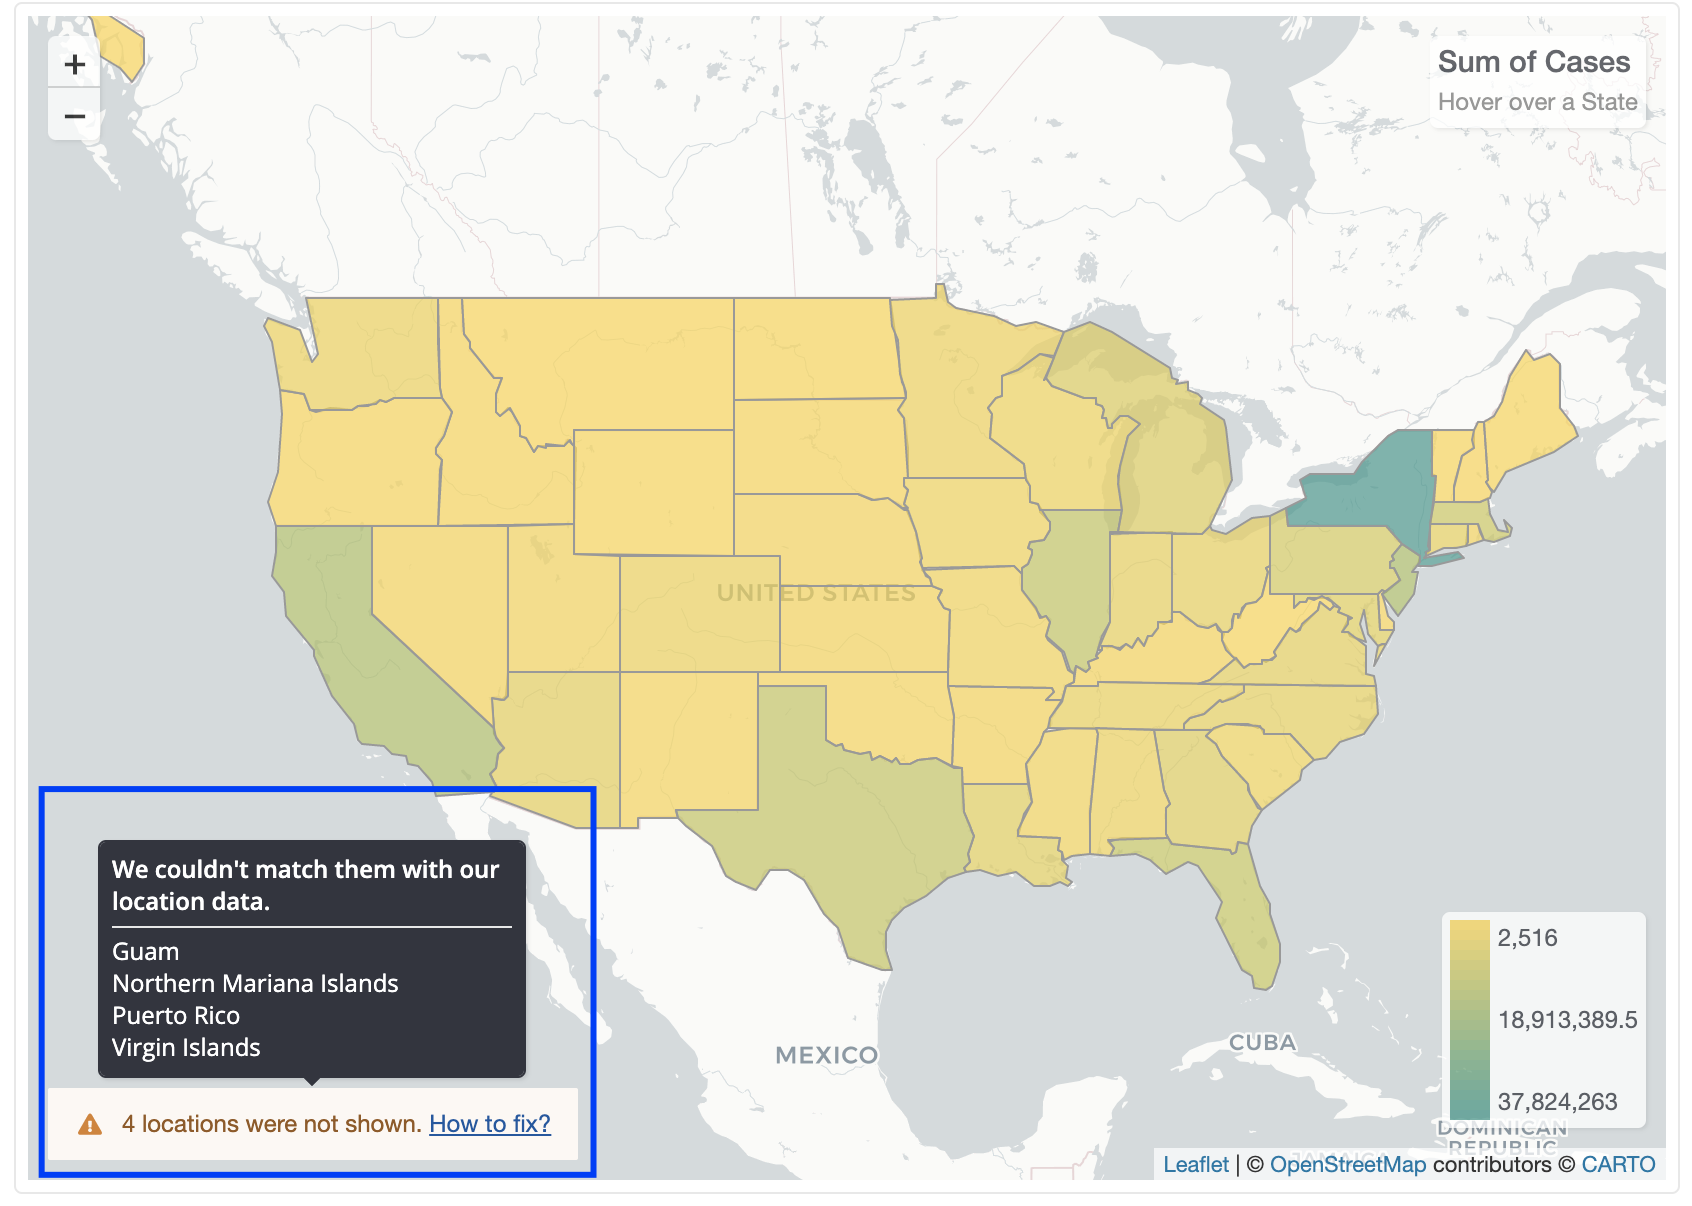
This happens when the location name in your dataset does not match correctly the location name in the GeoJSON file. For example, in your dataset, the United States is stored as the U.S, but in your GeoJSON file, it is stored as United States. Although they are technically the same, Holistics cannot match them.
To fix this, change the location name in either your data source or the GeoJSON file. This will fix the problem.