Running Total
Running Total is not supported for ClickHouse database in Holistics.
Introduction
A Running Total is a common calculation method that shows how a metric has changed over time. In Holistics, we use the word "Total" in its broader sense, which includes: Sum, Average, Min, Max, etc.
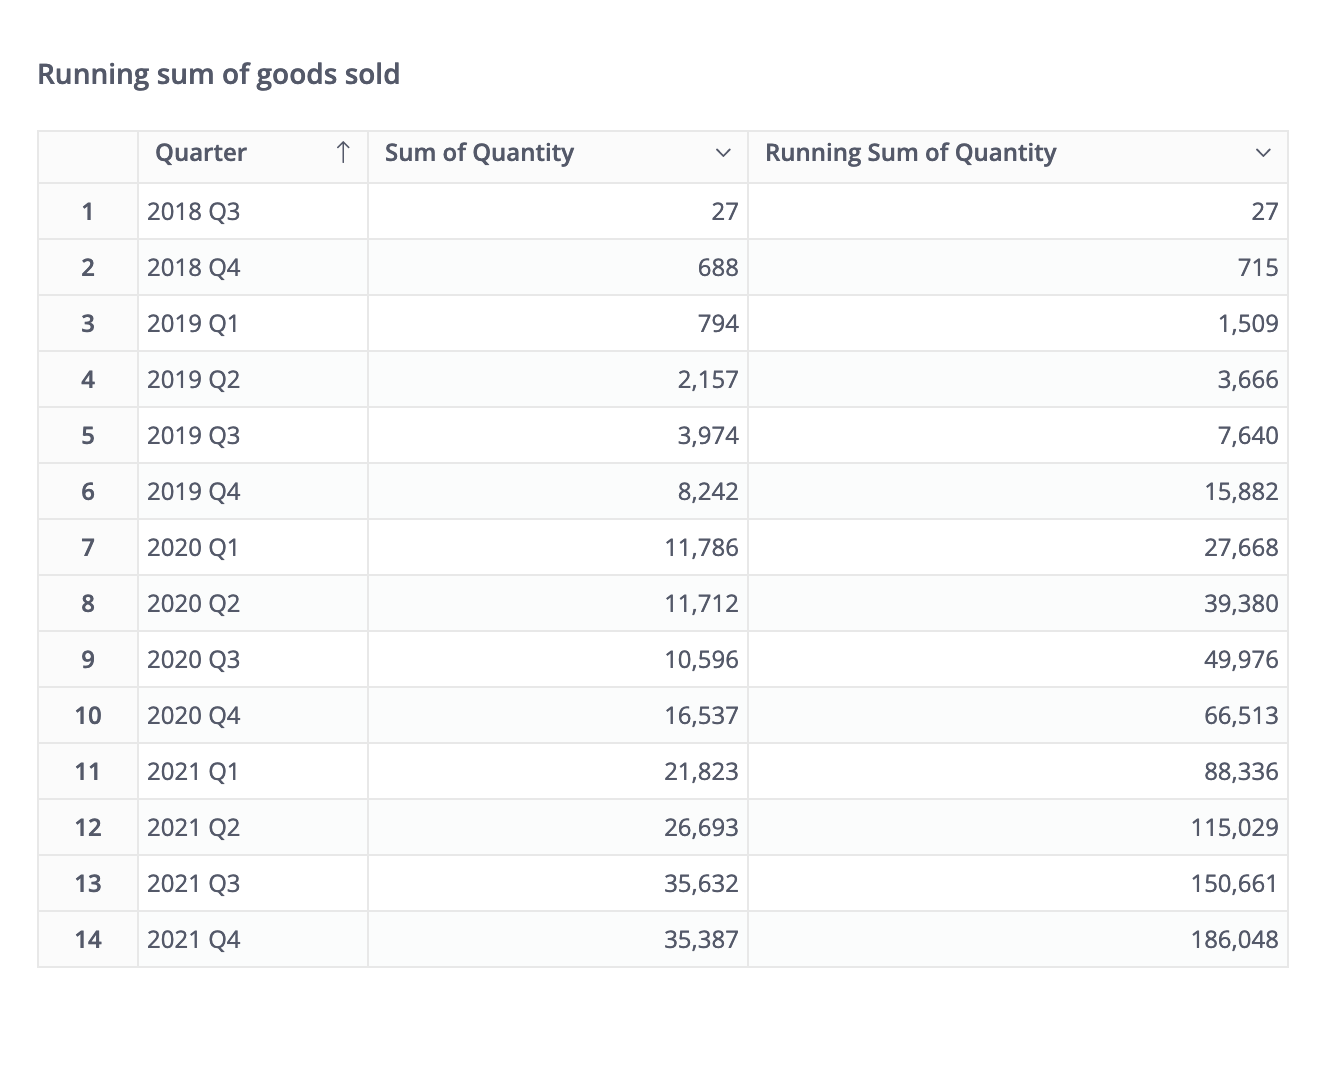
For example, you might want to use a running sum to calculate the accumulated amount of goods sold up to a specific quarter.
How to create a Running Total
- Drag or type the field's name into the Visualization Settings
- Click on it to display the aggregation drop-down. Here you can choose among four currently supported types of Running Total: Sum, Average, Min, Max.
- Click Get Result.
Mechanism
A Running Total consists of two main components:
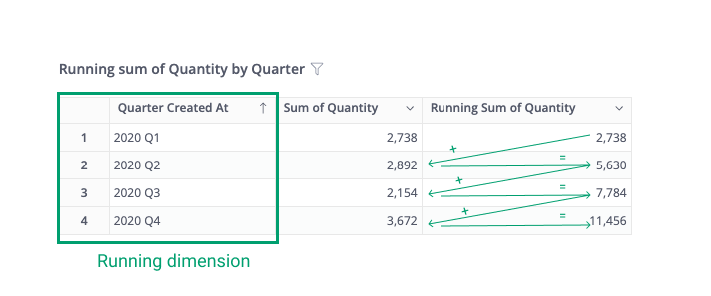
- Running Dimensions: The dimensions that the total will “run along” with. Each running direction will have a direction of its own.
- Measures: The measures that you want to calculate the running total.
The following part will give you a detailed look into running dimensions.
Running Dimensions
Definition
The running dimensions are the dimensions based on which the measures are aggregated.
Let's take our previous example again: when we calculate the running sum of quantity of goods sold up to a specific quarter, the quarter is the Running Dimension. It means Holistics will stack up the quantity of goods sold from one quarter to another.
Holistics automatically selects all the date dimensions as the running dimensions and sorts by the most granular date dimension.
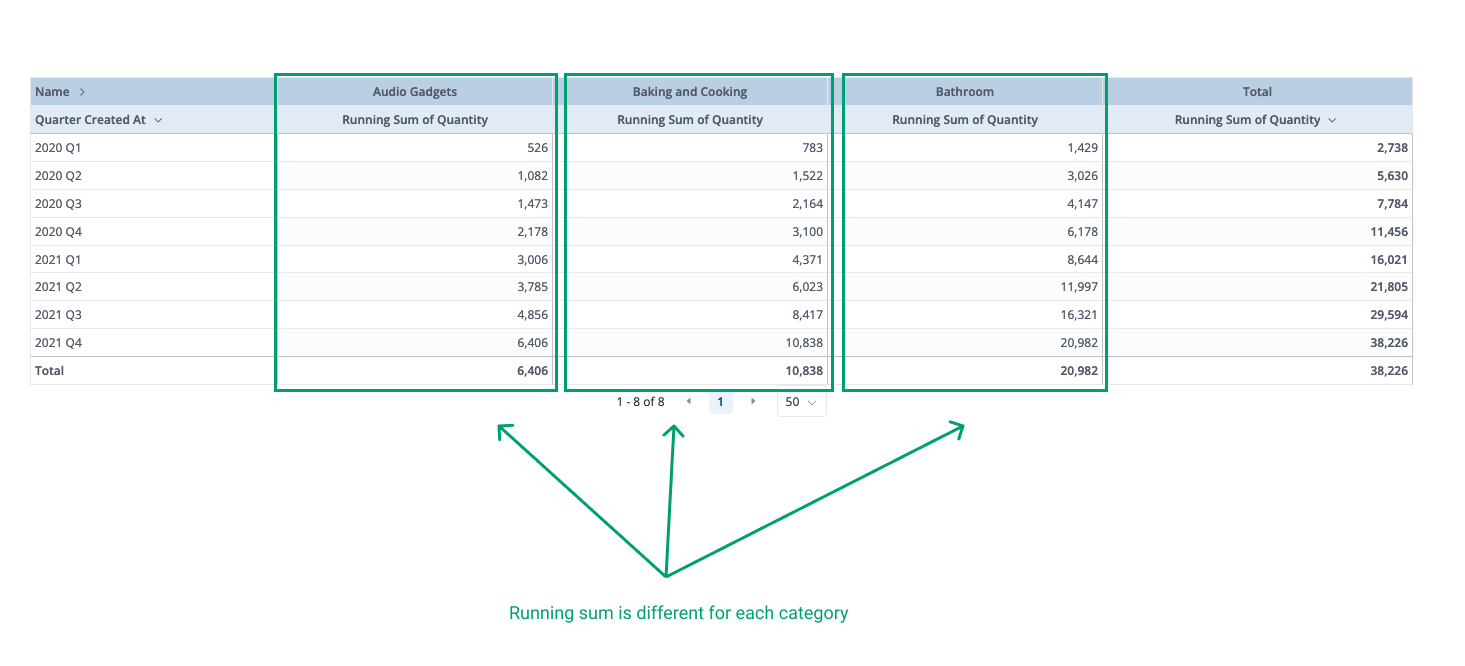
Grouping
The Running Total will be grouped by all non-date dimensions.
Let's say you have a date field, a category field and a running sum of quantity of goods. The running sum will be stacked up by quarter, and grouped by each category. In other words, the Running Total will start all over again for each category.
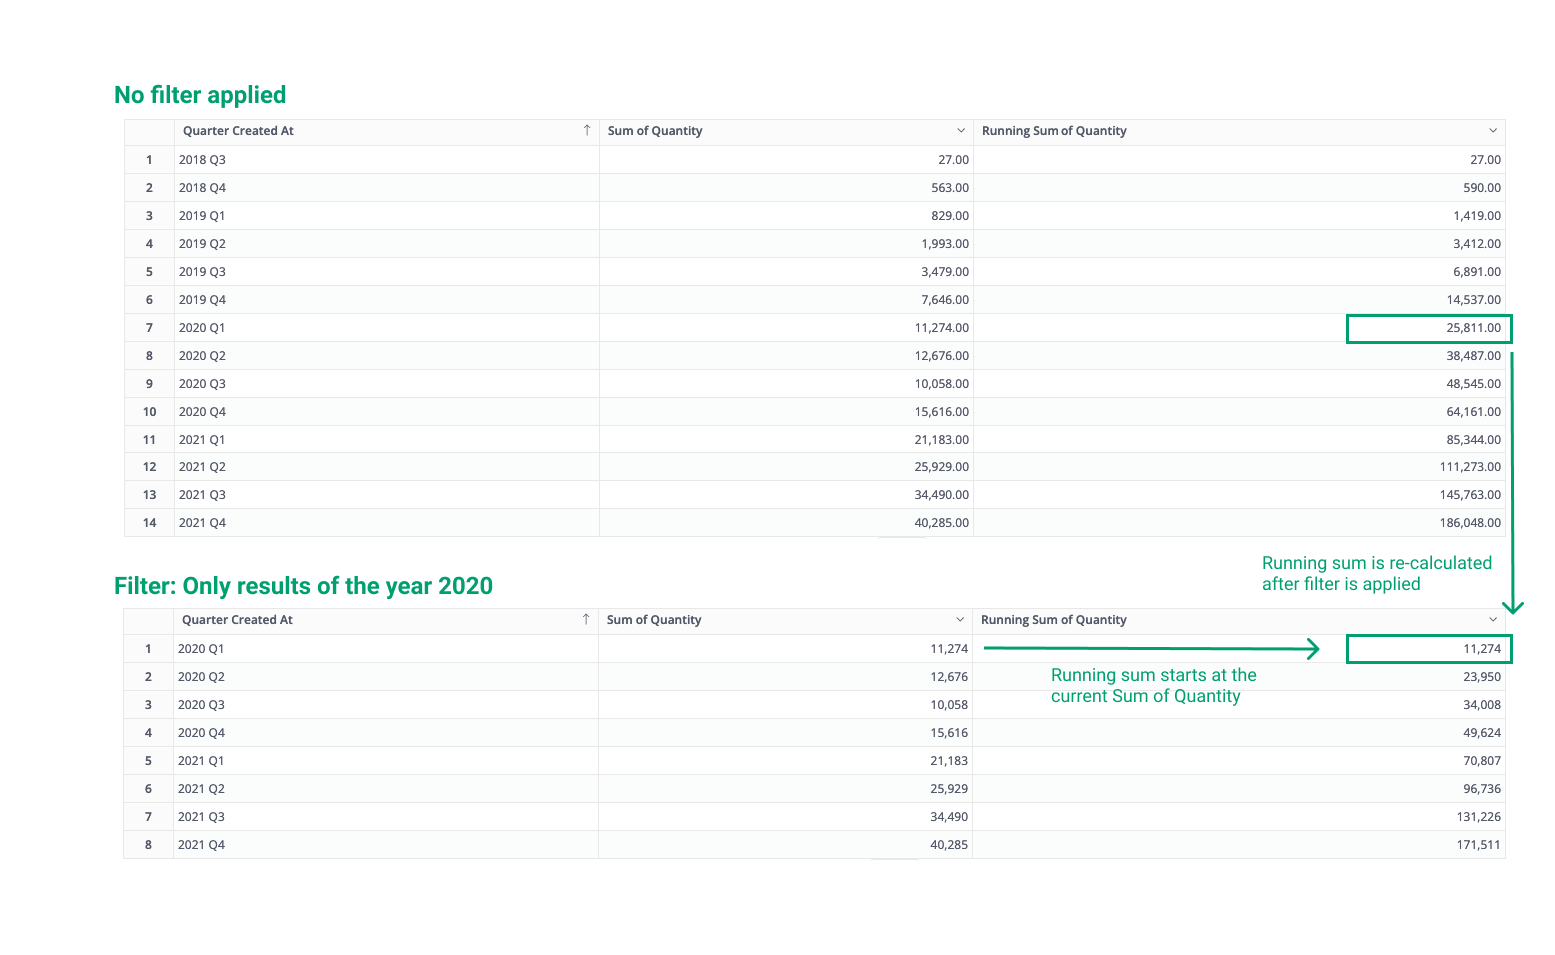
Running dimensions and filter
The running total is recalculated after the filter/condition is applied to the running dimensions.
The direction of each running dimension
The direction of each running dimension determines whether Holistics will calculate the Running Total by ascending or descending order of that dimension.
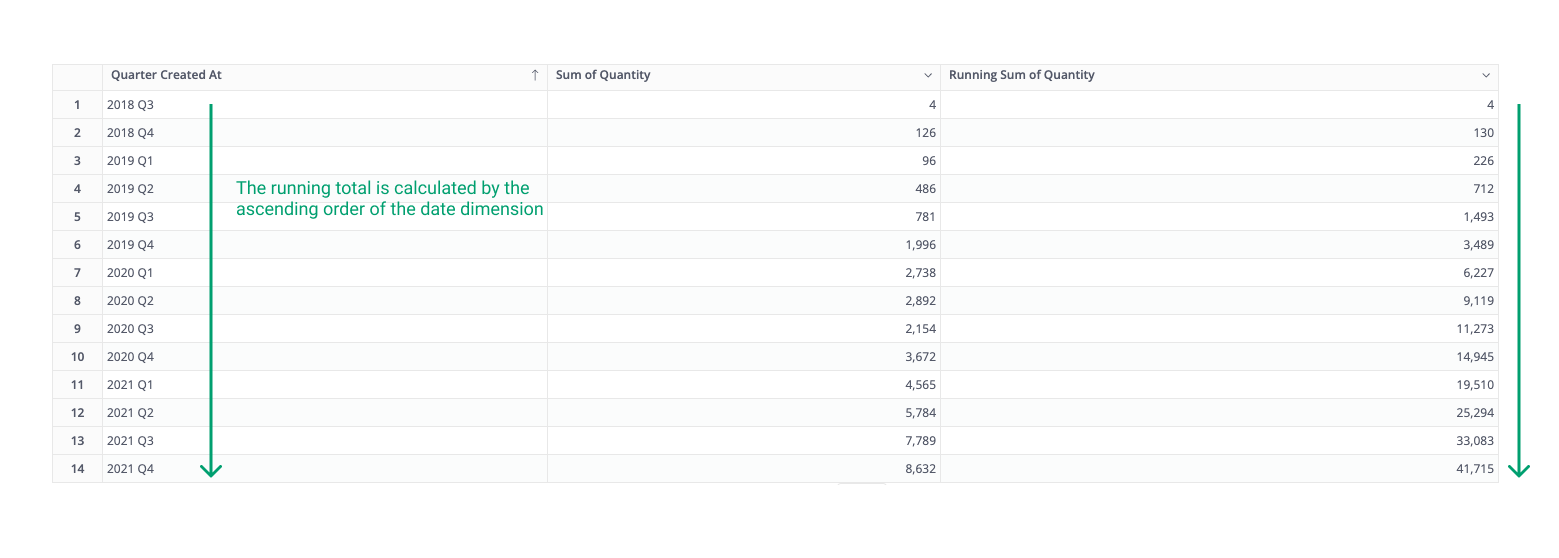
Holistics calculates the Running Total in ascending order of all date dimensions in the report. Contact us if you want to change the direction of each running dimension.
On our roadmap
To cater to more advanced use-cases, we have the following features in our plans:
- Ability to choose your preferred running dimensions
- Ability to choose the order of running dimensions
- Ability to change the direction of each running dimension
If you need one of the aforementioned features, please share with us your use-case in our community so we can prioritize it in our backlog.